The main tag of Crypto News Articles.
You can use the search box below to find what you need.
[wd_asp id=1]

15 10, 2025

SOL Holds $200 As Buyers Defend Trendline And DEX Volumes Surpass Ethereum

By |2025-10-15T23:29:46+03:00October 15, 2025|Crypto News, News|0 Comments

  • Solana price today trades near $203 after bouncing from $180–$185 support.
  • On-chain flows show weak accumulation with just $1.95M net outflow on October 15.
  • Solana’s $136.9B 30-day DEX volume outpaces Ethereum and BNB Chain.

Solana price today trades near $203, stabilizing after a volatile week that saw buyers step in around the $180–$185 support area. The recovery comes as SOL defends its long-term ascending trendline and reclaims the $200 psychological level, even as on-chain flows show lighter activity compared to earlier in the month.

Solana Price Defends Rising Trendline Support

SOL Price Dynamics (Source: TradingView)

The daily chart shows Solana holding above its ascending trendline from April, which continues to define the broader uptrend. Buyers reacted strongly near $180, aligning with the previous support zone from July and the base of the we…

Read The Full Article Solana Price Prediction: SOL Holds $200 As Buyers Defend Trendline And DEX Volumes Surpass Ethereum On Coin Edition.

Source link

15 10, 2025

Institutional Merger Fuels Bullish Momentum

By |2025-10-15T21:28:46+03:00October 15, 2025|Crypto News, News|0 Comments

  • Dogecoin trades near $0.204, stabilizing above the $0.20 psychological level after last week’s selloff.
  • Coinglass data shows $15.1M in outflows, signaling mild accumulation but limited speculative demand.
  • House of Doge merger with Brag House (NASDAQ: TBH) brings $50M backing and 837M DOGE reserves.

Dogecoin price today trades near $0.204 after recovering from last week’s sharp selloff that briefly pushed the token below $0.17. The rebound came as buyers defended the $0.20 psychological level, aligning with the lower boundary of the long-term ascending trendline. Focus now turns to whether DOGE can reclaim resistance between $0.228 and $0.234, where all major EMAs have converged.

Dogecoin Price Attempts To Stabilize Near Key Support

DOGE price forecast (Source: TradingView)

The daily chart shows DOGE consolidating between $0.20 and $0.23 after breaking bel…

Read The Full Article Dogecoin Price Prediction: Institutional Merger Fuels Bullish Momentum On Coin Edition.

Source link

15 10, 2025

This XRP Price Prediction From Ex-Goldman Analyst Eyes $1,000 by 2030

By |2025-10-15T19:27:45+03:00October 15, 2025|Crypto News, News|0 Comments

More Volume, More Revenue, Better Traders: Crypto Derivatives with Shift Markets


More Volume, More Revenue, Better Traders: Crypto Derivatives with Shift Markets

More Volume, More Revenue, Better Traders: Crypto Derivatives with Shift Markets


More Volume, More Revenue, Better Traders: Crypto Derivatives with Shift Markets

More Volume, More Revenue, Better Traders: Crypto Derivatives with Shift Markets


More Volume, More Revenue, Better Traders: Crypto Derivatives with Shift Markets

Derivatives trading has rapidly overtaken spot trading as the driving force in crypto markets. In this exclusive webinar with Shift Markets, we explore the rise of crypto derivatives and how exchanges, brokerages, and new market venues can leverage them for growth.

Ian McAfee, Co-Founder & CEO of Shift Markets, and Michael Zimkind, VP of Business Development, break down:

➤The mechanics of futures, perpetual swaps, and options

➤Why derivatives are reshaping the industry and outpacing spot markets

➤How integrating derivatives can boost trading activity, retention, and profitability

➤Real-world case studies from centralized and decentralized exchanges that scaled successfully with derivatives

Whether you run a spot-only crypto exchange, an FX brokerage, or are building a new platform, this session provides a clear roadmap to unlocking revenue and attracting higher-quality traders.

📣 Stay updated with the latest in finance and trading! Follow Finance Magnates across our social media platforms for news, insights, and event updates.

Connect with us today:

🔗 LinkedIn: / https://www.linkedin.com/company/financemagnates/
👍 Facebook: / https://www.facebook.com/financemagnates/
📸 Instagram: / https://www.instagram.com/financemagnates_official/?hl=en
🐦 X: https://x.com/financemagnates?
🎥 TikTok: https://www.tiktok.com/tag/financemag…
▶️ YouTube: / @financemagnates_official

#CryptoDerivatives #CryptoTrading #FuturesTrading #OptionsTrading #PerpetualSwaps #CryptoExchange #TradingInsights #CryptoMarkets #ExchangeGrowth #FintechInnovation #TradingEducation #CryptoWebinar #ShiftMarkets #OnlineEvent


Source link

15 10, 2025

Solana Price Prediction: Optimism Grows as SOL Builds Strong Reversal Base Near $185

By |2025-10-15T17:26:58+03:00October 15, 2025|Crypto News, News|0 Comments

Solana price has regained momentum above the key $200 level, as bullish signals and growing institutional confidence point towards a potential trend reversal.

Momentum is returning to Solana as market watchers highlight improving technicals and a solid foundation forming on-chain. Grayscale’s new insights add weight to the SOL’s bullish narrative. With Solana price holding support and volume ticking higher, participants are now watching whether this recovery above $200 can evolve into a full trend reversal.

Grayscale Highlights Solana’s Expanding On-Chain Economy

Grayscale Research noted that Solana’s diverse on-chain economy is building the necessary foundation for long-term valuation growth. The firm emphasized that Solana’s ecosystem has become a self-sustaining network of activity. This diversified structure supports consistent transaction throughput and fee generation even during market corrections.

Solana’s expanding on-chain economy signals growing network maturity, with Grayscale highlighting its sustainable long-term growth potential. Source: Grayscale Research via X

The bullish narrative from Grayscale reinforces institutional confidence, suggesting that Solana’s fundamentals are aligning for a sustainable growth cycle. With strong developer momentum and ecosystem adoption, SOL continues to position itself as a top performer heading into 2026.

Technical Outlook Suggests Bottom Formation Near $185

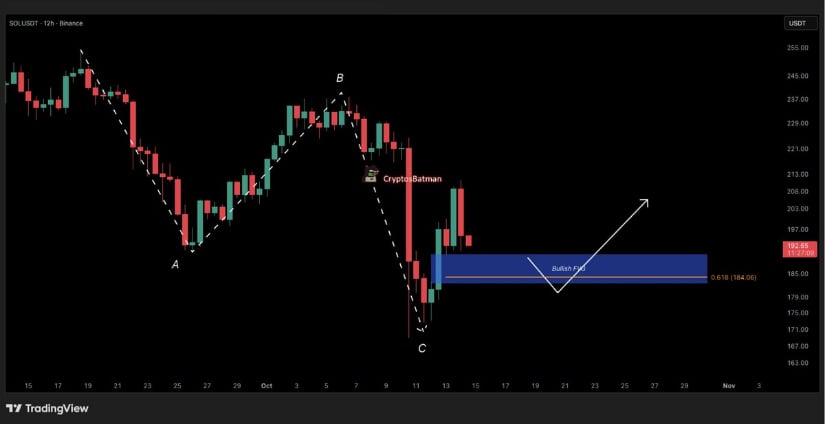
According to Crypto Batman, Solana price completed a textbook A–B–C corrective structure, aligning with the reaction to recent macro headlines such as the Trump tariff news. The pattern’s completion near $185 signals that a potential major bottom may have formed, supported by a fair value gap (FVG) at that level.

Solana Price Prediction: Optimism Grows as SOL Builds Strong Reversal Base Near 5

Solana completes a clean A–B–C corrective structure near the $185 zone. Source: Crypto Batman via X

From a structural standpoint, maintaining price above $185 keeps the setup bullish in the near term. The corrective phase looks complete, setting the stage for a rebound as momentum indicators begin to flatten. Should the ETF narrative continue to build, Solana price could reclaim higher zones around $210 and $225 with conviction.

Solana Price Sentiment Shifts as Key Support Holds

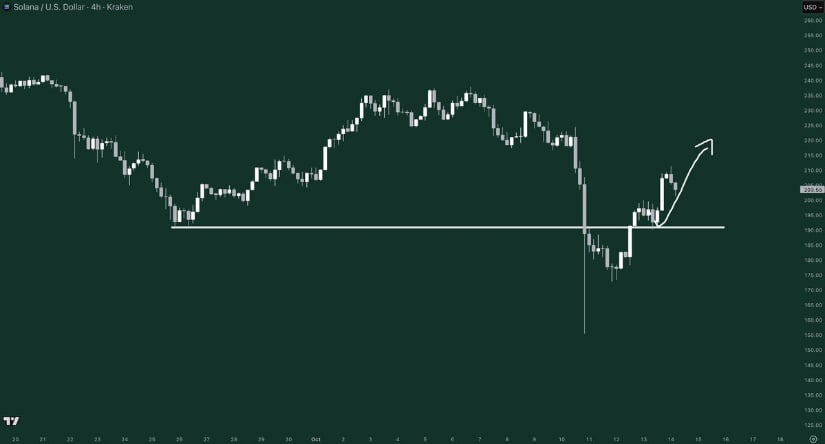
After multiple tests of horizontal support, Solana has rebounded perfectly off its previously drawn line of defense near $190. Gordon’s latest update shows how price respected this structure with precision, triggering a sentiment shift among participants.

Solana Price Sentiment Shifts as Key Support Holds

Solana price rebounds sharply from its $190 support zone, with Gordon highlighting a clear sentiment shift as the structure holds firm. Source: Gordon via X

This reclaim signals more than just a bounce; it represents renewed belief in the underlying trend. As long as SOL maintains higher lows above this support, the sentiment will likely continue improving, providing the stability needed for a more sustained recovery leg.

Solana Indicators are Starting to Show Strength

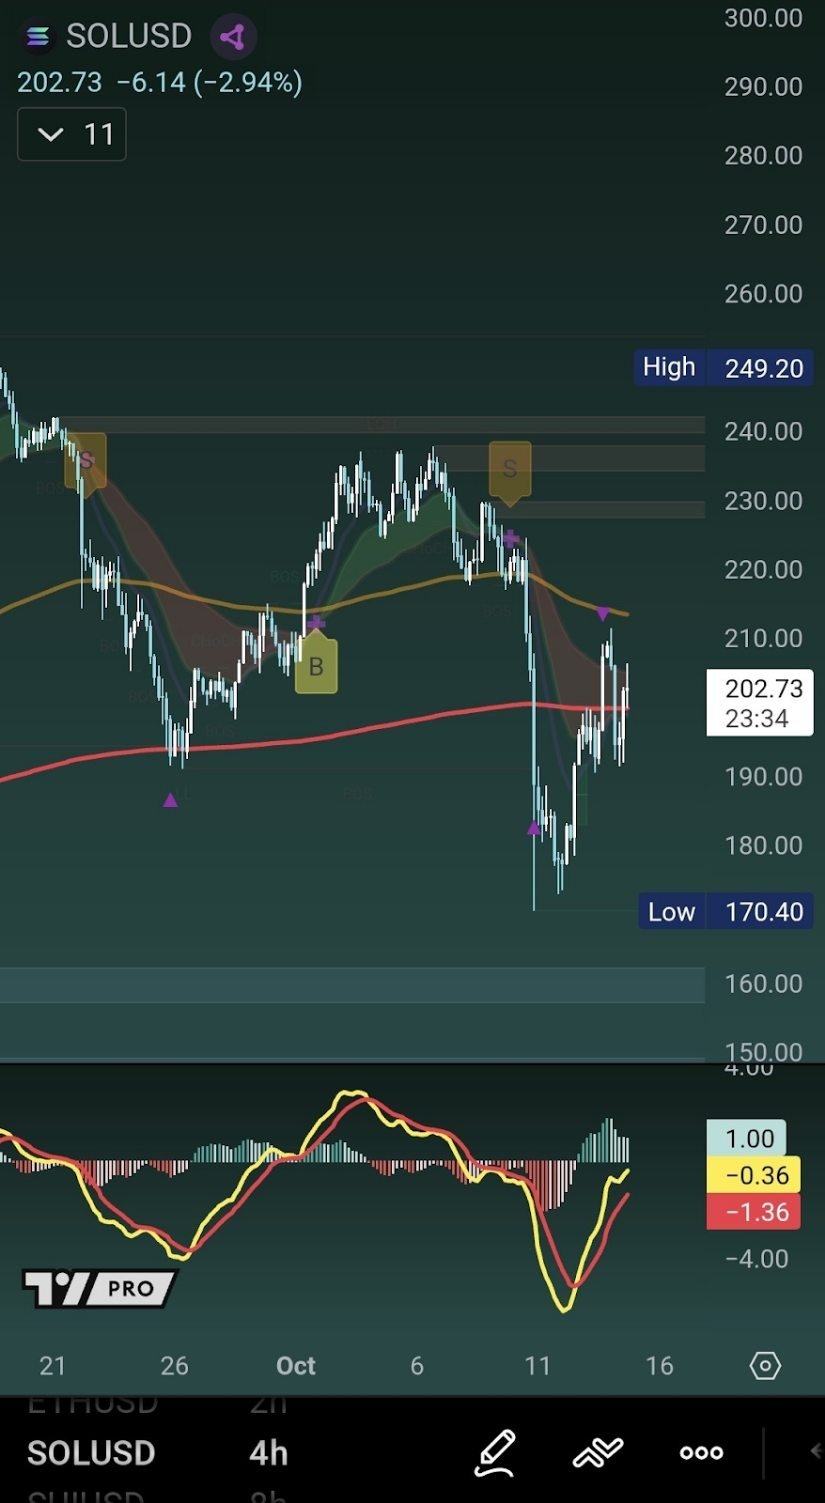
Solana’s recent price action shows SOL is attempting to reclaim the Ichimoku Cloud region on the 4-hour chart. Crypto Seth pointed out that the price is currently retesting the cloud alongside the 100-day and 200-day moving averages, showing the market’s attempt to reestablish structure after last week’s volatility.

Solana Indicators are Starting to Show Strength

Solana is attempting to reclaim the Ichimoku Cloud and key moving averages, with MACD strength signaling renewed buyer momentum. Source: Crypto Seth via X

Momentum indicator, MACD is showing strength from its oversold region, signaling the beginning of renewed buyer participation. The recovery above $195 to $200 is a constructive sign that the market is attempting to reset its mid-range bias in preparation for another push.

Solana Price Prediction: Price Back Above $200

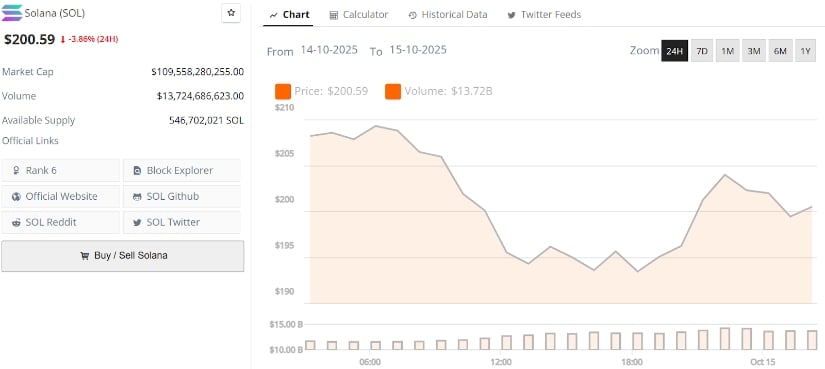
Solana currently trades around $200.59, with 24-hour volume exceeding $13.7B and a market cap above $109B. This recovery above $200 marks a critical psychological and structural level that keeps the bullish case intact.

Solana Price Prediction: Price Back Above $200

Solana current price is $200.59, down -3.86% in the last 24 hours. Source: Brave New Coin

Technically, $185 remains the key short-term support to defend, while resistance lies between $215 and $230. A daily close above this range could confirm continuation towards $250, while maintaining above $200 solidifies the market’s renewed strength.

Final Thoughts

Solana’s ability to reclaim the $200 mark after completing a clean A–B–C correction highlights both structural resilience and improving investor sentiment. With multiple confirmations from on-chain data, institutional narratives, and technical patterns, the broader setup continues to favor medium-term upside momentum.

As long as Solana price maintains support above $185 and momentum indicators stay constructive, the Solana Price Prediction outlook remains positive. A sustained close above $215 could re-ignite bullish continuation towards $250 and beyond, reaffirming Solana’s leadership role among Layer-1 networks heading into late 2025.


Source link

15 10, 2025

Why could BTC, ETH and XRP extend price correction?

By |2025-10-15T15:26:01+03:00October 15, 2025|Crypto News, News|0 Comments

Bitcoin (BTC), Ethereum (ETH), and Ripple (XRP) prices are struggling to regain upward momentum as broader market sentiment remains cautious on Wednesday. BTC and ETH face technical rejections at key levels, while XRP’s declining futures Open Interest reflects waning trader participation. 

The broader crypto market continues to consolidate, and the recovery momentum appears to be losing steam due to resurfacing broader macroeconomic pressures. Renewed US-China trade tensions and the prolonged US government shutdown have dampened market sentiment, keeping investors cautious.

Data spotlight: Bitcoin and Ethereum record mild ETF inflows while XRP’s OI drops to 1-year low

Bitcoin institutional demand shows some signs of optimism. SoSoValue data shows that Bitcoin spot Exchange Traded Funds (ETFs) recorded a mild inflow of $102.58 million on Tuesday, breaking the two-day outflow streak. However, the size of the inflow is smaller compared to that seen during early October when BTC hit a new all-time high of $126,199.

Total Bitcoin Spot ETF Net Inflow daily chart. Source: SoSoValue

Demand for Ethereum spot ETFs has also shown mild strength. The chart below shows that Ethereum spot ETFs recorded a mild inflow of $236.22 million on Tuesday, breaking the three-day outflow.

Total Ethereum Spot ETF net inflow daily chart. Source: SoSoValue

Total Ethereum Spot ETF net inflow daily chart. Source: SoSoValue

Meanwhile, XRP derivatives show signs of weakness, with futures Open Interest (OI) dropping to $563.57 million on Wednesday, reaching levels not seen since November 2024, reflecting waning investor participation.

XRP Futures Open Interest | Source: CoinGlass

XRP Futures Open Interest | Source: CoinGlass

Chart of the day: Bitcoin momentum indicators signal potential for further correction

Bitcoin price recovered slightly on Sunday and closed above $114,900 after a sharp fall on Friday. At the time of writing on Wednesday, BTC hovers around $112,500 after being rejected from the 78.6% Fibonacci retracement level at $115,137, drawn from the April low of $74,508 to the October 6 high of $126,199, and the 50-day Exponential Moving Average (EMA) at $115,409 earlier in the week.

If BTC continues its correction, it could extend the decline toward the daily support level at $107,245.

The Relative Strength Index (RSI) indicator at 43 on the daily chart suggests that bearish momentum is gaining traction. Additionally, the Moving Average Convergence Divergence (MACD) showed a bearish crossover on Friday, further supporting the bearish view. 

On the other side, if BTC recovers, it could extend the recovery toward the 50-day EMA at $115,400.

BTC/USDT daily chart 

BTC/USDT daily chart 

Altcoins update: Ethereum and XRP bears are in control of the momentum 

Ethereum price found support around the 61.8% Fibonacci retracement level at $3,953 (drawn from the April low of $1,385 to the record high of $4,956) on Saturday and recovered by 13% over the next two days. On Tuesday, ETH declined slightly after falling below the daily resistance level at $4,232, which roughly coincides with the 50-day EMA and the 78.6% Fibonacci retracement level. At the time of writing on Wednesday, it hovers around $4,140.

If ETH continues its pullback, it could extend the decline toward the 61.8% Fibonacci retracement level at $3,953.

The Relative Strength Index (RSI) reads 46 on the daily chart, indicating bearish momentum is gaining traction. Additionally, the Moving Average Convergence Divergence (MACD) showed a bearish crossover on Friday, further supporting the bearish view. 

However, if ETH breaks above the $4,232 level and finds support around it, the rally could extend toward the next daily resistance at $4,488.

ETH/USDT daily chart 

ETH/USDT daily chart 

Ripple price found support around the daily support level at $2.35 on Saturday and recovered over 10% in the next two days. On Tuesday, XRP declined after founding resistance around the lower trendline of a falling wedge pattern. At the time of writing on Wednesday, it hovers around $2.49.

If XRP continues its correction, it could extend the decline toward the daily support at $2.35.

Like Ethereum, XRP’s momentum indicators RSI and MACD also support the bearish view.

On the other hand, if XRP recovers, it could extend the recovery toward the 50-day EMA at $2.83.

XRP/USDT daily chart

XRP/USDT daily chart

Cryptocurrency metrics FAQs

Source link

15 10, 2025

XRP Price Prediction Ahead of Ripple Swell 2025

By |2025-10-15T11:23:57+03:00October 15, 2025|Crypto News, News|0 Comments

$26 Million Transfer to Binance Raises Bearish Concerns for Ethereum

Recent data shows that the digital asset management company Metalpha has withdrawn 10,000 ETH totaling about $26 million from the liquid stacking platform Lido and transferred them to Binance. This action has raised concerns about potential bearish implications for the price of Etherium.

Source link

15 10, 2025

ChatGPT Forecasts Rally for the Best Altcoins

By |2025-10-15T07:21:31+03:00October 15, 2025|Crypto News, News|0 Comments

Key Points:

➡️ Cardano’s long consolidation inside a descending triangle could soon explode into a major breakout.
➡️ ChatGPT’s Cardano price prediction points to a potential 200% upside, with $2 being the next major target.
➡️ With Cardano heating up, now’s the time to load up on the best altcoins – like $SNORT, $MAXI, and $XRP.

Cardano ($ADA), like almost every other blue-chip crypto, took quite the hit on Friday when President Donald Trump announced the new 100% tariff on China.

That said, the token immediately found strong support at the $0.53 level – a zone that has been Cardano’s backbone ever since November 2024. Most recently, it triggered a massive 73% rally in July 2025.

Unlike other cryptos like Bitcoin, Ethereum, or Solana that have been in a strong uptrend ever since November’s breakout, Cardano has been sideways this entire year.

While it’s understandably frustrating for investors who want to see the 10th largest crypto in the world gain some momentum, savvy players know that the longer the consolidation, the more explosive the breakout. And that could indeed be the case with Cardano.

When we asked ChatGPT to churn out an objective Cardano price prediction, the AI pointed towards the token’s building descending triangle pattern.

As you can see, before Friday’s events, the token was close to breaking out of this consolidation zone. ChatGPT believes that it should soon get back to challenging the upper resistance line, following which we could see $ADA join the list of top-trending cryptos.

Now for the next potential Cardano target, ChatGPT resorted to classic technical analysis, measuring the width of the descending triangle pattern and mapping it onto the projected breakout level of around $0.90.

This gives us a potential target of $2, i.e., a massive 200% upside from current levels. In other words, ChatGPT expects Cardano to triple in price in the coming weeks.

Even better, we can look at Cardano’s historical performance to gain confidence in this trading pattern. For instance, its November breakout came from a very similar descending triangle that also lasted for nearly seven months.

Last but not least, the AI did point out that Cardano still has around 30% to go before it could break out from this level, so it’s worth taking this upside with a pinch of salt.

To fully capitalize on Cardano’s brewing momentum, we asked ChatGPT to suggest three other altcoins with the potential to deliver outsized returns.

1. Snorter Token ($SNORT) – Telegram-Native Trading Bot for Meme Coin Sniping

Snorter Token ($SNORT) is the firepower behind Snorter Bot – a new Telegram-based trading tool built with the game-changing goal of making meme coin trading more accessible and simpler for retail participants.

Currently, the meme coin trading space – albeit one of the most profitable crypto segments – is dominated almost entirely by institutional players who use advanced trading tools and algorithms to eat up all the liquidity.

Snorter Bot, however, will deliver sub-second swiping and automatic order execution, empowering everyday traders to participate in those initial meme coin frenzies that often churn out life-altering gains.

All you’ll have to do is send commands – buy/sell limit or stop orders – to Snorter Bot via Telegram chat and it’ll automatically execute them once liquidity kicks in for the token.

ChatGPT Forecasts Rally for the Best Altcoins

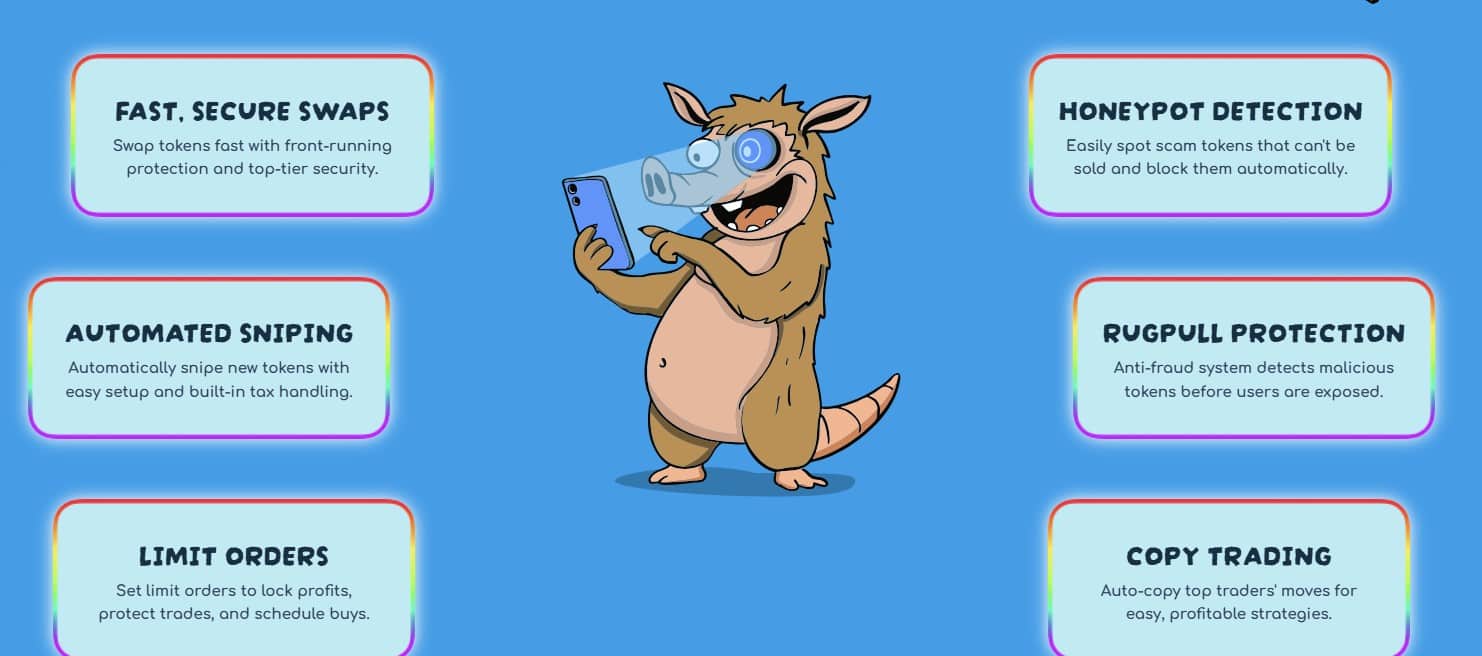
Even better, Snorter Bot is set to come equipped with top-notch security to ensure you’re not bombarded by malicious actors. It will feature safeguards against rug pulls, honeypots, front-running, and even complex sandwich attacks.

According to our Snorter Token price prediction, a $100 investment today could turn into $1K by the end of 2025.

In addition to raw gains, buying Snorter Token unlocks a new tier of exclusive benefits, including:

  • Reduced trading fees (just 0.85% versus 1.5% for non-holders)
  • No daily sniping limits
  • Access to advanced analytics
  • Staking rewards currently yielding 108%

Currently in presale, $SNORT has already pulled in over $4.6M from early investors. Each token is available for just $0.1079, with staking at 108% APY. A heads-up, though – the presale ends next Monday, so time is running out if you want to buy in early.

Join the meme coin revolution – grab your $SNORT tokens today.

2. Maxi Doge ($MAXI) – New Dog-Themed Meme Coin Eyeing Dogecoin-Like Glory

A hype-driven meme coin like Maxi Doge ($MAXI) could help you unlock the full potential of the upcoming altcoin boom.

Maxi is Dogecoin’s distant cousin, meaning he shares Dogecoin’s OG DNA but combines it with a never-before-seen ferociousness and hunger for 1000x gains. That’s because $MAXI wants to surpass $DOGE as the number one meme coin in the world.

His elder cousin’s popularity and wholesome aura grabbed all the attention at family gatherings, leaving Maxi lonely and unattended to, which became the very trigger points behind his anti-Dogecoin stance.

Don’t mistake Maxi Doge for a bulked-up, deadly-looking canine with only temper and no smarts.

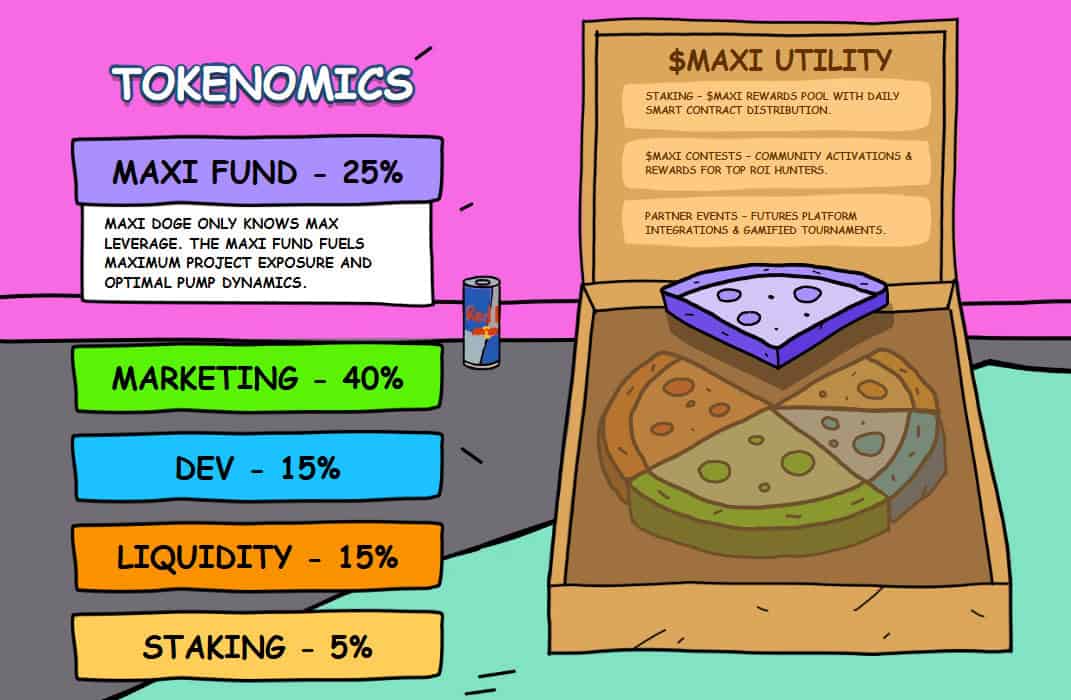
It has very strategically allocated a massive 40% of its total token supply for marketing and PR events, including influencer collaborations and social media blitzes.

Maxi Doge tokenomics.

$MAXI knows that to challenge Dogecoin’s supremacy, it has to go viral across the crypto landscape. In fact, to stand out, Maxi Doge has gone against the trend of meme coin mascots being cute and adorable.

Instead, Maxi embodies a rugged, gladiator-like persona – one that’s quickly becoming a hit among degen investors hungry for a fierce mascot they can rally behind like an army.

Speaking of loyalty, Maxi Doge has already pulled in over $3.6M from its ongoing presale, proving that investors, too, want to see some real competition in the meme coin space and not let Dogecoin run away with the crown.

💵 Check out our step-by-step guide on how to buy $MAXI for just $0.000263 and stake it for 83% APY.

Even better, $MAXI token holders will get access to weekly trading competitions, leaderboard rewards, and an active community of meme coin traders.

The token also plans to list on futures platforms, aiming to become the perfect tool for leveraged plays and moonshot gains.

Buy $MAXI and become part of the next Doge mania.

3. XRP ($XRP) – Blue-Chip Crypto Hinting at a Massive 500% Rally

XRP ($XRP) has already recouped much of the losses from Friday, thanks to the incredibly strong support zone at $1.8–$2.

Given the token’s strong reaction to this zone, experts believe that XRP could now be headed toward its recent swing high of $3.1 – a solid 26% upside from current levels.

However, the most notable piece of this XRP price prediction is the token’s retest of an important breakout resistance level on the two-week chart.

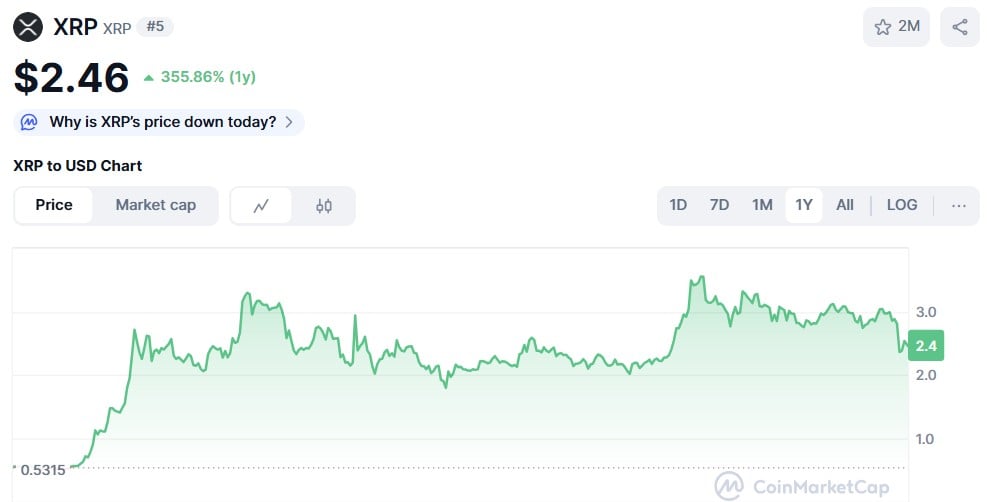
XRP ($XRP) price chart on CoinMarketCap.

After rising above a long-drawn descending triangle pattern, $XRP has now completed a successful retest of the pattern.

As for a potential target, we can measure the maximum width of this descending triangle and map it onto the breakout level around $1.20.

According to this pattern, XRP could be headed toward the $15 mark. Keep in mind, though, that this is a long-term price prediction. It’s highly unlikely the token will get there without some trials and tribulations along the way.

Interested in buying the fifth-biggest crypto? Get your $XRP tokens on Binance today.

Source link

15 10, 2025

BNB Prediction: Is Binance Coin Topping Out After Record Boom?

By |2025-10-15T05:19:53+03:00October 15, 2025|Crypto News, News|0 Comments

BNB extended gains and traded to a new all-time high above $1,350. The price now shows signs of cooling and might correct below $1,250.

BNB Price Extends Surge Despite Sharp Selloff

After trading to a new all-time high at $1,300, the BNB price saw a sharp decline, like Bitcoin. There was a move below $1,200 and $1,000. However, the bulls remained active near $900, and the price started a fresh increase.

There was a clear move above the $1,120 and $1,200 resistance levels. The bulls pushed the price above the last high and surpassed $1,350. A new all-time high was formed at $1,376, and the price is now consolidating gains.

BNB/USD daily chart | Source: TradingView.com

BNB is now trading well above the $1,150 pivot level and the 50-day simple moving average (blue). There is also a key bullish trend line in place with support at $1,000 on the daily chart.

The current price action suggests that the bulls are losing strength. Therefore, there are chances of a downside correction from $1,376. Immediate support is near the $1,260 level and the 23.6% Fib retracement level of the upward move from the $891 swing low to the $1,376 high.

A downside break below the $1,260 and $1,250 levels could start a major downside correction. The first major support is now forming near the $1,150 level. If the bulls fail to protect the $1,150 support, the price could drop to the trend line region at $1,000. It is close to the 76.4% Fib retracement level of the upward move from the $891 swing low to the $1,376 high, and the 50-day simple moving average (blue).

The next area of interest for the bulls could be $960. The main support is $820. A daily close below $820 could increase selling pressure. In the stated scenario, BNB price might dive and revisit the $730 support.

Another Surge?

If BNB remains stable above $1,250, there could be a fresh increase. Immediate hurdle sits near the $1,320 level. A clear move and close above the $1,320 resistance could open the doors for a move toward $1,375.

The next major resistance could be near the $1,450 zone. If there is a close above the $1,450 resistance, the price might gain bullish momentum. In the stated case, the price might rally to $1,550.

Overall, BNB price is showing signs of uptrend exhaustion near $1,375. If there is a pullback, the bulls might remain active near the trend line support and $1,000. On the upside, a close above $1,375 might send the price to $1,550.


Source link

15 10, 2025

ADA Eyes a 40% Rally if $0.70 Support Holds — Here Is Why Traders Are Getting Bullish

By |2025-10-15T03:18:54+03:00October 15, 2025|Crypto News, News|0 Comments

  • Cardano (ADA) is defending key support at $0.70, hinting at a potential 40% rally.
  • Analysts see a possible move toward $0.82–$0.92 short term and $1.20 if the breakout confirms.
  • Derivatives data shows $62M in liquidation clusters, signaling volatility and potential upside pressure.

Cardano (ADA) has been holding firm after one of its sharpest pullbacks this quarter, defending key support levels and flashing signs of renewed buying momentum. Despite widespread sell pressure, traders appear optimistic that ADA’s price structure remains intact — and that the next leg higher could be forming if bulls continue to protect the $0.70 support zone.

Cardano’s Technical Setup Points to Recovery

Technical charts from Growk Finance highlight that ADA is still trading within a four-year symmetrical triangle, a consolidation pattern that has historically preceded major breakouts. The current structure shows ADA repeatedly defending the $0.70–$0.72 range, confirming this zone as strong short-term support.

Momentum indicators are also shifting upward from oversold levels, signaling that buyers may be regaining control. Analysts suggest that if ADA holds above $0.68, the recent flush could serve as the final shakeout before a sustained rebound. A confirmed breakout from the upper trendline of the pattern could propel ADA toward $1.10–$1.20, aligning with the top boundary of its long-term formation.

Price Targets and Short-Term Outlook

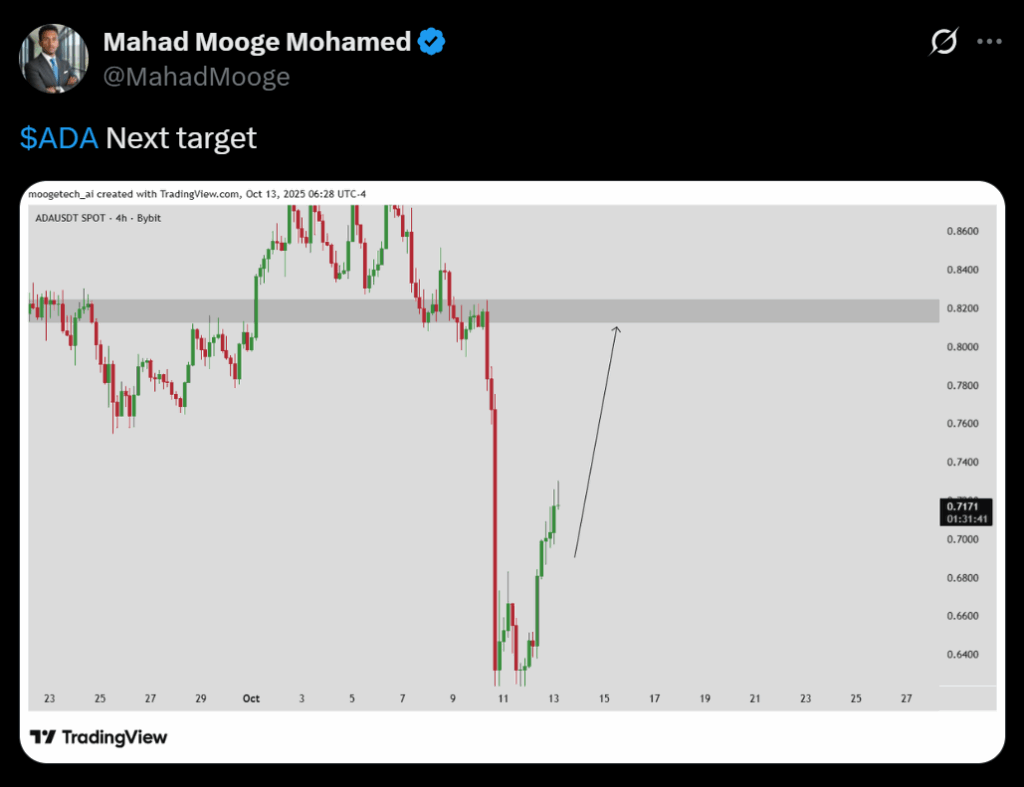
In the short term, ADA is forming a V-shaped recovery, reclaiming key price levels after briefly dipping below $0.65. Charts shared by Mahad Mooge show ADA targeting $0.82 as the next resistance zone — an area that coincides with historical supply and trading volume imbalances. If buyers manage to maintain strength above $0.70, analysts expect a move toward $0.92, which would complete a full retrace of last week’s decline.

However, failure to hold the $0.70 support could trigger renewed downside pressure, pushing prices back toward $0.65. The reaction around $0.82 will likely determine whether ADA enters a new bullish phase or remains range-bound through the end of October.

Derivatives Data Signals Incoming Volatility

Data from TapTools reveals that more than $62 million in leveraged ADA positions sit near the $0.81 level, making it a key liquidity zone. If price moves higher, these positions could be liquidated, leading to a short squeeze and amplifying ADA’s upside momentum.

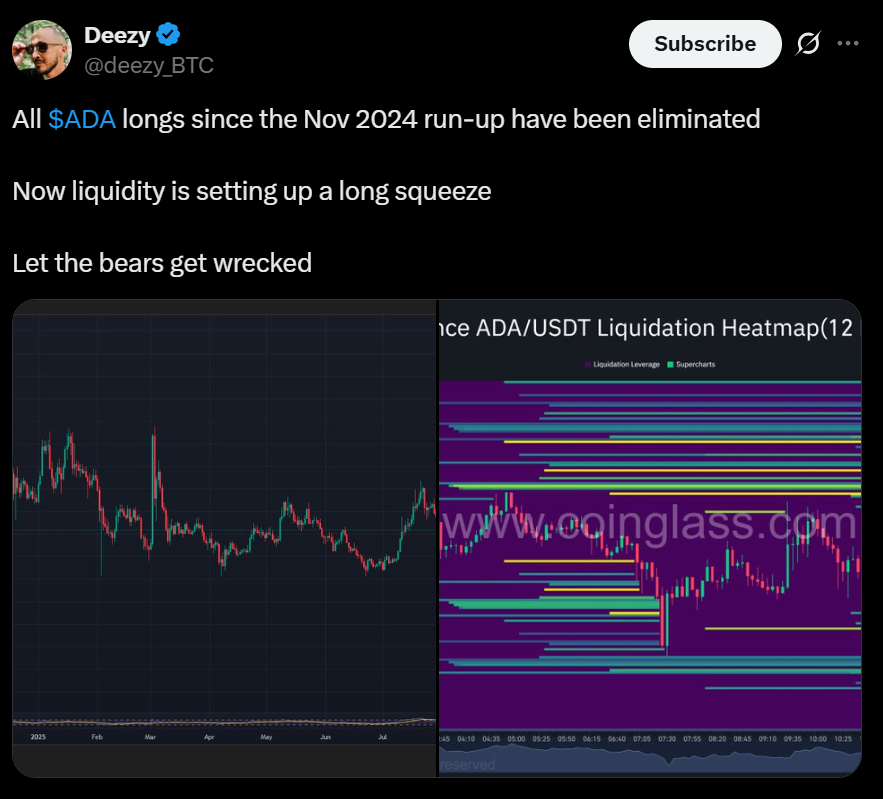
Analyst Deezy added that most long positions from the November 2024 rally have been wiped out, resetting open interest and creating ideal conditions for a clean structural rebound. This reset could pave the way for a long squeeze-driven rally, with volatility expected to rise sharply between $0.78 and $0.82.

Historical Parallels and Long-Term Outlook

When compared to ADA’s 2020–2021 cycle, current patterns show remarkable similarities. Both phases feature deep corrections followed by months of tight consolidation within descending channels. Historically, such formations have preceded explosive upward moves once momentum returns.

Technically, the ADA/BTC pair is also sitting near a major support zone that previously marked macro bottoms. A breakout above diagonal resistance could reestablish ADA’s longer-term uptrend against Bitcoin, potentially setting the stage for a broader bull rotation into altcoins.

Final Thoughts: ADA’s Path Ahead

Cardano’s price remains in a recovery phase, with traders watching the $0.70 support as the make-or-break level. Sustained buying above this zone could drive ADA toward the $0.82–$0.92 corridor in the coming weeks, with a longer-term target of $1.20–$1.40 if the 4-year triangle finally breaks to the upside.

At press time, ADA trades near $0.72, up 0.66% in 24 hours — a small but steady sign that the market may be stabilizing before its next move.

The post Cardano Price Forecast: ADA Eyes a 40% Rally if $0.70 Support Holds — Here Is Why Traders Are Getting Bullish first appeared on BlockNews.


Source link

15 10, 2025

XRP Price Prediction: XRP’s Logarithmic Breakout Marks Beginning of Potential $10 Bull Run

By |2025-10-15T01:17:47+03:00October 15, 2025|Crypto News, News|0 Comments

XRP is turning heads once again as a powerful multi-year breakout pattern emerges on its long-term chart, hinting at the potential beginning of a historic bull run toward the $10 mark.

The cryptocurrency, which has spent nearly a decade trapped inside a descending channel, is flashing a technical signal rarely seen in traditional or digital markets. With institutional momentum rising and technical indicators aligning, market sentiment is quietly shifting toward a major breakout phase that could redefine the XRP price prediction narrative.

Peter Brandt Highlights Rare XRP Breakout Pattern

Veteran classical chartist Peter Brandt has pointed to XRP’s multi-year logarithmic chart, describing it as a “textbook breakout” from a descending channel spanning back to 2014. Brandt, who has over five decades of trading experience, compared the structure to historical commodity bull runs that preceded explosive price movements.

Veteran chartist Peter Brandt identifies XRP’s breakout from a decade-long descending channel, signaling a potential rally beyond $10 from $2.50 support. Source: Peter Brandt via X

“XRP is showing a clean breakout from a multi-year downtrend. Patterns like this don’t appear often, and when they do, they tend to lead to strong upside,” Brandt noted in his analysis.

The breakout is occurring with XRP trading around $2.50, well below its all-time high near $3.84. If the resistance levels continue to hold, Brandt’s chart geometry suggests a potential rally that could carry the price of XRP beyond the $10 mark. This would represent a significant multi-fold increase from the current XRP price and could signal the beginning of a new long-term uptrend.

Institutional Demand Rises With CME XRP Options Launch

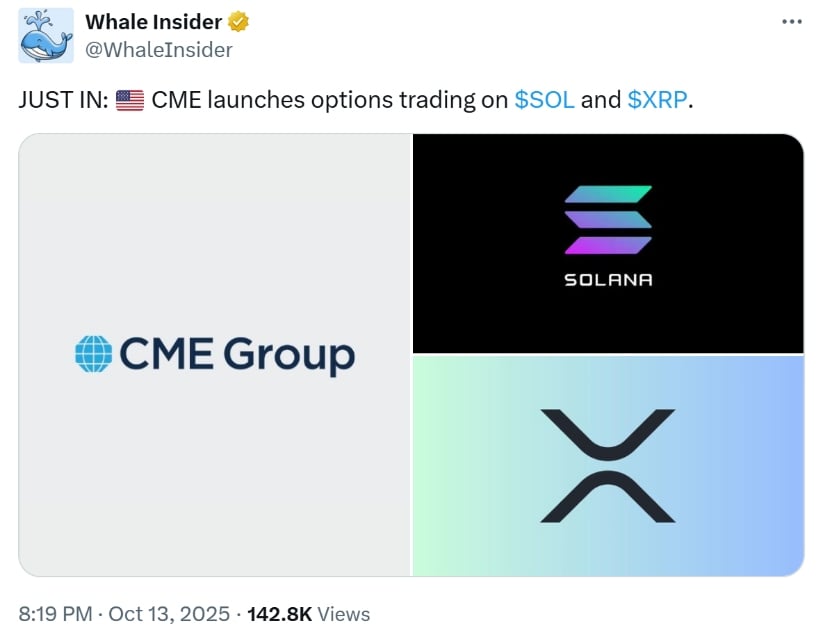
Adding to the bullish backdrop, CME Group has expanded its crypto derivatives lineup to include regulated options on XRP futures. This move follows the earlier introduction of XRP futures in April 2025, shortly after Ripple Labs reached a settlement in its long-running legal battle with the U.S. Securities and Exchange Commission.

XRP Price Prediction: XRP’s Logarithmic Breakout Marks Beginning of Potential  Bull Run

CME launches options trading on Solana and XRP, signaling growing institutional interest in altcoin derivatives. Source: Whale Insider via X

CME’s decision to roll out XRP options aligns with increasing institutional demand and growing regulatory clarity in the U.S. The launch on October 13, 2025, comes as policymakers move closer to designating the CFTC as the primary crypto regulator, a shift that could further boost market confidence.

Analysts believe that physically settled contracts for XRP will appeal to both institutional and retail investors, broadening the asset’s market reach. This heightened participation could also fuel momentum for the next phase of the rally.

Oversold Conditions Fuel Recovery Expectations

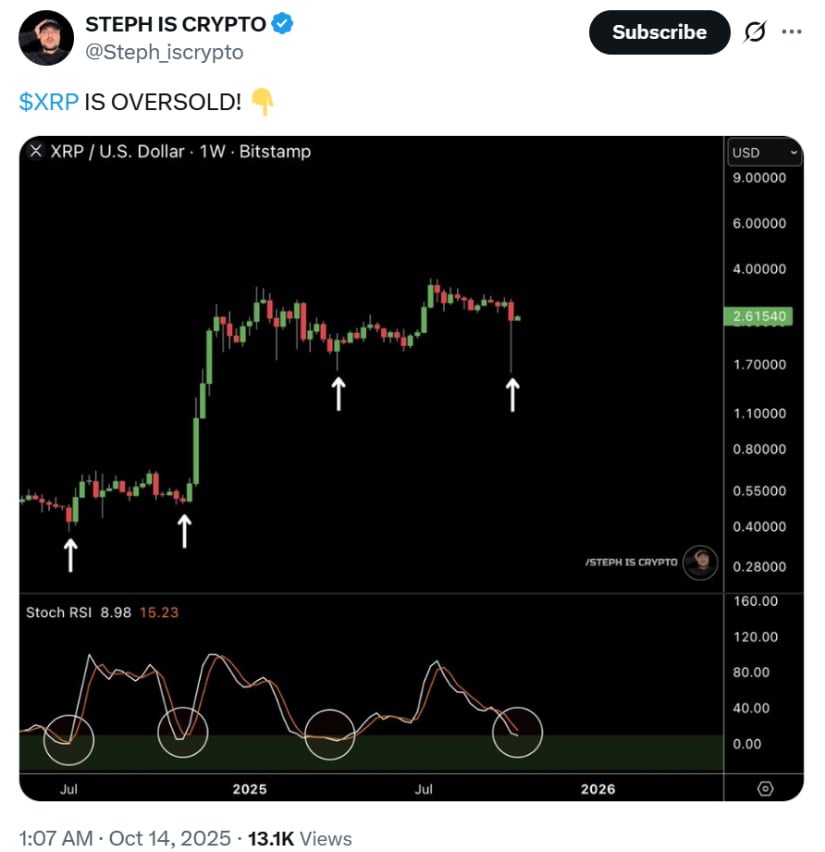
On the technical front, XRP’s recent price action shows signs of resilience. Despite a sharp 41% flash crash earlier in the week that briefly sent the token down to $1.52, XRP has rebounded strongly, trading back around $2.50. A Stochastic RSI reading of 8.98 on the weekly chart signals deep oversold territory—a zone that historically coincides with major reversals.

Oversold Conditions Fuel Recovery Expectations

XRP is oversold based on a weekly chart with a Stochastic RSI of 8.98, prompting mixed community reactions amid recent price volatility and ETF speculation. Source: @Steph_iscrypto via X

Previous rebounds from similar conditions have often preceded extended rallies. The recent bounce from the $2.37 area, coupled with improving derivatives stability, suggests the market could be laying the foundation for a broader bullish structure.

Derivatives Market Stabilizes as Leverage Unwinds

Ripple XRP derivatives data indicate that excessive leverage was flushed out during last week’s sell-off, leaving the market in a healthier state. Open Interest (OI) currently averages $4.34 billion, slightly higher than Sunday’s four-month low. This stabilization could pave the way for renewed participation from traders and investors.

Derivatives Market Stabilizes as Leverage Unwinds

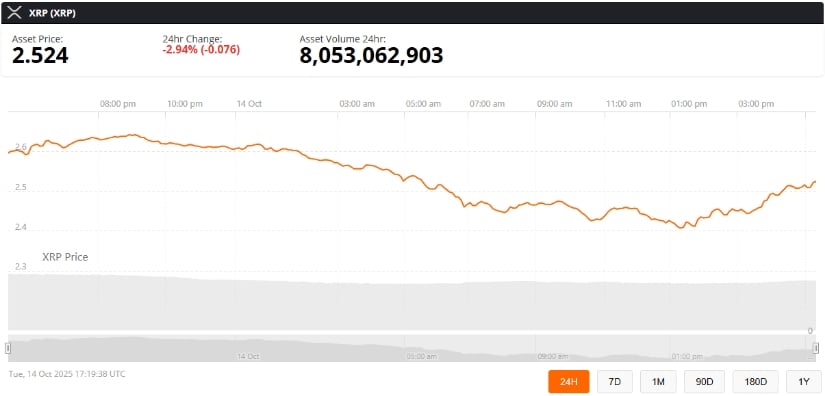
XRP was trading at around $2.52, down 2.94% in the last 24 hours at press time. Source: XRP price via Brave New Coin

“With excessive leverage purged and structural risks reduced, the market setup now looks far healthier. We view the coming weeks as an opportune window for capital deployment,” noted K33 Research in its latest report.

However, short-term momentum remains fragile. The Relative Strength Index (RSI) hovers around 35, signaling weak upside conviction. To confirm a stronger breakout, traders are watching for a decisive move above the 200-day Exponential Moving Average at $2.63. Clearing this level could open the door for a test of the $3.00 psychological barrier.

$10 Target Gains Traction Among Analysts

While near-term volatility may persist, the technical and fundamental signals surrounding XRP price have grown increasingly constructive. The breakout from a decade-long descending channel, rising institutional participation through regulated derivatives, and oversold technical conditions all point toward a potentially transformative phase for the cryptocurrency.

If these trends continue, analysts believe XRP could set its sights on the $10 price target, a level not seen before. The next few weeks may prove crucial in determining whether this pattern develops into a full-fledged bull run or faces renewed resistance.

For now, XRP remains above the key $2.50 support, and traders are closely monitoring whether this momentum can turn into the breakout that many have anticipated for years.

Source link

Go to Top