The main category of The Gold News.
You can use the search box below to find what you need.
[wd_asp id=1]
The main category of The Gold News.
You can use the search box below to find what you need.
[wd_asp id=1]
India, the world’s second-largest wheat consumer, has been endeavouring to control wheat prices following consecutive years of production decline due to heat waves. Subsequently, the government had to release unprecedented quantities to bolster domestic stocks.
India previously enforced restrictions on the amount of wheat stock traders could retain to stabilise prices. However, with the expiration of this limit scheduled for March 31st, traders are now required to disclose their wheat stocks, as announced by the government.
The government has said that the measure is aimed to “manage overall food security and prevent hoarding and unscrupulous speculation”.
The government aims to boost wheat stocks by ramping up procurement efforts this year, with a focus on monitoring private purchases for efficiency, Reuters reported quoting a trader.
“In case of necessity, the government retains the option to reapply stock limits to facilitate procurement,” the trader added.
Wheat inventories in government warehouses fell to 9.7 million metric tons at the beginning of this month, marking the lowest level since 2017.
In 2023, the government purchased 26.2 million tons of wheat from local farmers, falling short of its target of 34.15 million tons.
With inputs from Reuters
“The prices soared to VND95,000 per kilogram in the domestic market, which has never seen before,” said Doan Huu Tue, CEO of My Viet International Group.
According to Tue, coffee supply was always plentiful this time last year, when harvesting had just finished. But now the inventory level at enterprises and the coffee volume stored by farmers are modest.
“We have to refuse orders for 600-700 tons of coffee beans, because we are not sure if we can collect coffee beans,” he said.
Analysts said that coffee prices have reached all-time high, but export companies signed future contracts some months ago at low prices. As a result, they now have only two choices, either collect coffee from farmers at high prices and incur losses, or cancel the deals and compensate for this.
The domestic prices were low at the times exporters signed contracts. But when they began collecting coffee from farmers, the prices began escalating.
Some exporters said they placed orders with farmers and paid a deposit, but they still cannot collect coffee because farmers have broken the contracts.
Nguyen Ngoc Luan, founder of Meet More brand in HCM City, said that coffee prices have increased by twofold.
The current input coffee prices are at VND85,000-95,000 per kilogram, while enterprises signed contracts on collecting coffee at VND50,000-60,000.
“We dare not close deals with low-price contracts. The company is trying to hold out until June,” Luan said.
The director of a large coffee export company on March 22 told VietNamNet that he has canceled several contracts, because the more he exports, the bigger losses he will incur.
“The prices have skyrocketed, making it impossible to respond to the latest happenings,” he said. “The coffee volume stored in our warehouse is just enough to fulfill 60 percent of orders.”
Coffee prices have soared in the international market. On March 22, Robusta coffee with delivery in May 2024 surged by $70 per ton on the London trading floor to $3,385, while products with delivery in July surged by $67 per ton to $3,288.
In the domestic market, coffee bean prices hit the VND95,000 per kilogram peak.
Chair of the Vietnam Coffee and Cocoa Association (Vicofa) Nguyen Nam Hai said the prices were around VND40,000 per kilogram this time last year.
With the production cost of VND35,000-40,000 per kilogram and the current selling price of VND95,000 per kilogram, farmers can pocket big money.
In contrast, exporters are worried as prices have escalated. Importers don’t want to share risks and adjust buying prices.
Demand high
Asked about coffee price prospects, Hai said prices would stand high.
Hai said global coffee output has decreased because of climate change. El Nino has caused droughts in coffee growing areas, resulting in an output drop everywhere, including Vietnam.
In addition, many farmers had chopped down coffee plants to cultivate other crops after coffee prices remained low for a long time.
The situation is also getting more serious because of geopolitical conflicts and the tensions in the Red Sea. Shipping freights and other costs have escalated, prompting financial investors to hoard for speculation. This has contributed to pushing coffee prices up.
The strong purchasing power of investors has triggered automatic buy orders, pushing coffee futures prices to new record highs.
Vietnam’s inventory level of 2022-2023 was the lowest in history. Signs of coffee shortages first appeared in August 2023 and since then, prices have been increasing.
According to Hai, Vietnam is the biggest Robusta coffee supplier in the world, and global roasters still have high demand for Robusta. However, inventories are not high.
“I think both farmers and exporters will run out of coffee by the end of April,” he said, adding that export companies need to assess the situation thoroughly when negotiating futures contracts.
The General Department of Customs (GDC) reported that Vietnam exported 200,000 tons of coffee in the first half of March, up 119.5 percent over the same period last year, worth $320 million.
Tam An
(With inputs from Reuters)
Unlock a world of Benefits! From insightful newsletters to real-time stock tracking, breaking news and a personalized newsfeed – it’s all here, just a click away! Login Now!
Demonstrations begin Monday at locations across Canada, and are planned to continue until tax is rescinded
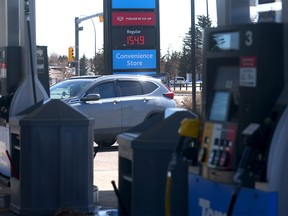
Dozens of people gathered on the Trans-Canada Highway at Highway 22 west of Calgary as part of a nationwide protest against the federal carbon tax, which increased Monday.
Protesters called for the tax — levied on individuals, families, small and medium-sized businesses, First Nations and public institutions such as cities and schools — to be abolished.
Article content
The demonstration was one of several across the country Monday, with plans to continue them until the tax is rescinded, organizers said.
Advertisement 2
Article content
Shaun Derman was one of many who stood at the side of the highway, holding a sign that read, “Axe the tax.”
“It’s a nationwide carbon tax protest, but they’re going to have to have petitions and everything to try and stop the carbon tax,” he said.
“I come out for the protests because I believe there should be a Western Canada now — stop the carbon tax, stop the transfer payments to the east, stop it all.”
The federal carbon tax and its associated rebates rose Monday from $65 per tonne of carbon emissions to $80.
Gas, diesel, propane and natural gas prices will increase — some by cents, and in other industries by as much as nearly $2.
Derman criticized the tax for causing an increase in the cost of gas, groceries and other consumer goods.
“I’d like to have more people aware of it so that more people will get involved,” he said.
Several RCMP vehicles were parked nearby, and police advised motorists of potential delays on Highway 1.
“If you have travel plans in this area during this time, consider alternate routes,” Mounties said in a written statement issued Monday morning. “Alberta RCMP and partner organizations will be present to ensure that the impact on travellers will be minimized and to ensure traffic disruption will not affect public safety.”
Noon News Roundup
Article content
Advertisement 3
Article content
Members of the Calgary Police Service’s public safety unit were on hand to assist — “a normal practice in these types of events,” according to the service.
The protest maintains a non-partisan stance, organizers said in a statement issued Sunday, aiming to show the variety of Canadians that disapprove of the carbon tax.
One protester who drove from B.C. and wished to remain anonymous called the carbon tax “atrocious”, saying it affects everybody.
Pointing to the Petro-Canada gas station at the Highway 22-TransCanada interchange nearby, the protester said she noticed a 30 cent increase at the pump from Sunday night to Monday morning.
“I’ve talked to people today who cannot afford fuel to go to work . . . how can they make the money to live?” she said.
The increase in the federal carbon tax comes at a time when Canadian members of Parliament will get their customary pay raise on April 1, resulting in increases of anywhere between $8,500 and $17,000 this year.
“Did you know Justin Trudeau and his cabinet got raises today? On the very day that he decides to empty Canadians’ bank accounts a little bit more. That’s why we’re here.
Advertisement 4
Article content
“There are more people in this country that are not fine, and it’s getting worse.”

Some provinces have called on Ottawa to cancel the hike because of the affordability crisis. Prime Minister Justin Trudeau has said the increase also means larger quarterly rebate cheques.
Trudeau has accused conservative premiers of lying about the policy’s effect on inflation and has challenged his provincial critics to present alternative plans to reduce emissions.
Protester Judy Martens said people are running out of options, and the demonstration is one way everyone can come together to oppose the carbon tax.
“Seeing what’s happening to Canada, seeing how everybody’s starting to suffer more and more . . . my hometown never had a tent city; now there’s a giant tent city,” she said.

Alberta was hit with another hike Monday as the provincial government fully reinstated its fuel tax, meaning an increase of four cents per litre. The 13-cents-per-litre tax was suspended for all of 2023 and partially reinstated in January 2024.
Gary Lambert of Innisfail, a military veteran, said he’s upset about both federal and provincial tax hikes.
Advertisement 5
Article content
“People gotta realize it’s not just the one tax,” he said.
Allan Hunter of Airdrie said he was also troubled by the double whammy.
“The Alberta gas tax increase is a bit hypocritical of the (United Conservative Party government), but the carbon tax isn’t just about the carbon going in your tank,” said Hunter.
“Everything you purchase, every one of these trucks going by, every one of these cars going by, everything we consume in this country is going up today.
“Thanks Justin, you just made things even less affordable for Canadians.”
Elsewhere in Canada, dozens of people gathered on Parliament Hill, some waving “axe the tax” signs while others draped themselves in Canadian flags or expletive-laced messages about the prime minister.
Protesters also temporarily blocked part of the Trans-Canada Highway linking Nova Scotia and New Brunswick, Manitoba and Saskatchewan, and Saskatchewan and Alberta.
TV reports showed demonstrators near Aulac, N.B., carrying signs that read “Axe the tax” and “Trudeau must go.”
Advertisement 6
Article content
One eastbound lane was open for commercial vehicles only, and one westbound lane had reopened to all traffic, but motorists travelling between the two provinces were advised to expect delays, said New Brunswick RCMP.
In British Columbia, BC United Opposition Leader Kevin Falcon joined about 70 protesters in Richmond.
Falcon said the 23 per cent increase in the levy is a “cruel April Fool’s joke” on B.C. residents, especially those who pay the highest gas taxes in the country.
John Rustad, the leader of the Conservative Party of BC, also attended the rally. He said by 2030 the average family of four will have paid close to $27,000 in the carbon fees.

Monday’s carbon tax increase will be noticed most with the price of gasoline and diesel. Clothing and food costs may be indirectly affected, but the effect of the increase has yet to be determined.
Drivers in the Calgary region experienced an increase in fuel prices last week, ahead of the carbon tax hike and a simultaneous increase in the provincial gas tax.
Trudeau and other carbon pricing proponents say critics are ignoring the fact that Canadian families receive quarterly rebate cheques, which are more generous to low-income households, to help them offset the upfront costs.
Advertisement 7
Article content
The federal government increased the quarterly carbon rebate amounts to keep up with the cost increase. Albertans will be getting $225 for a single person, $337.50 for a couple and $450 for a family of four. Rural residents are to receive 20 per cent more.
The next rebate is due April 15.
Carbon tax supporters point to the costs climate change has imposed on Canadians through disasters such as wildfires and floods.
Last week, some 200 economists and academics from universities across the country released an open letter defending carbon pricing as the most low-cost way to reduce emissions, as opposed to imposing stricter regulations.
— With files from Mackenzie Rhode and The Canadian Press
Recommended from Editorial
Article content
The price of platinum opened at $905.88 per ounce, as of 9 a.m. That’s down 0.01% from the previous day and down 8.29% from the beginning of the year.
The lowest trading price within the last day: $903.10 per ounce. The highest platinum spot price in the last 24 hours: $917.00 per ounce.
The chart below shows how the spot price of platinum is trending over the year.
Year to date, platinum is down 8.29%, as of 9 a.m. The 52-week high reached $1,135.49 on April 21, 2023, and the 52-week low dropped to $843.15 on Nov. 10, 2023.
The precious, silvery-colored metal is priced in U.S. dollars. This means that the fluctuations in the value of the U.S. dollar can impact its price.
The price of XPT/USD reflects the value of one ounce of platinum in U.S. dollars, and it is traded like traditional currency pairs. Because platinum trades occur globally, investors can also track the spot price of platinum in other currencies, such as XPT/EUR for euros and XPT/GBP for British pounds.
Factors that can influence the price of platinum include changes in demand, geopolitical events and tensions in major platinum-producing countries. Of course, investor opinion and speculation can also affect prices.
Platinum is one of four main precious metals investors can trade via physical bullion, exchange-traded products or futures contracts. Gold, silver and palladium spot prices are also updated 24/7 in various currencies.
Currently, platinum trades at $905.88 per ounce, as of 9 a.m., compared to gold, which trades at $2,252.65 per ounce. Year to date, platinum prices are down by 8.29% and gold prices are up by 9.02%.
“Historically, platinum has often been more expensive than gold due to its relative scarcity and unique properties. However, the price of platinum can fluctuate in response to changing market conditions,” said John Bergquist, president of Elysium Financial.
Political instability and supply disruptions in major platinum-producing regions like South Africa and Russia affect prices.
The silvery metal also tends to be a less reliable store of value than gold.
While historically, platinum has been pricier than gold, that flip-flopped briefly in August 2011. When looking at the gold-to-platinum price ratio, platinum was priced above gold from January 2013 until December 2014. Since then, gold has more than doubled its value compared to platinum prices.
Like any metal, the price of platinum can be volatile. Various factors affect it, the most significant being supply and demand dynamics. Other factors, such as economic conditions, geopolitical events, and changes in industrial and investment demand, can also impact the price of platinum.
At the start of the new millennium, the precious metal’s spot price was around $420. Fast-forward over 20 years, and the current price of platinum has more than doubled.
The spot price soared to new heights, trading in February 2008 at around $2,200 per troy ounce. In November of that year, the price returned to less than $1,000.
Platinum’s spot price has fluctuated between around $800 to $1,400 for the past decade, hovering around the $1,000 threshold on average.
Platinum prices today remain historically low. Prices dropped as low as $623.50 in March 2020 during the COVID-19 pandemic. While prices have recovered, platinum is nowhere near its all-time high of $2,213.20, set on March 3, 2008.
Futures contracts let investors speculate on the future price movements of an underlying asset like platinum.
These financial contracts represent an agreement between two parties to trade a set amount of platinum at a specified price at a future date. They can be settled by exchanging the physical commodity or cash in place of the commodity.
Futures contracts differ from spot prices in that futures contracts establish a future price whereas spot prices are for immediate delivery. These contracts can be fulfilled by trading the physical commodity or exchanging cash in place of the underlying asset. They are usually traded through an exchange.
The automotive industry creates the highest demand for platinum. Platinum is a key component in manufacturing catalytic converters, which are responsible for reducing vehicle emissions.
In addition to the automotive industry, platinum is widely used in the industrial industry to create medical products, nitric acid and glass. As the demand for these products rises, so does the price of platinum.
It is anticipated that platinum will play an essential role in the development of hydrogen technology. Platinum is used to produce carbon-free hydrogen from renewable energy.
“If hydrogen-based power meets expectations in the coming decade, then one could expect a material demand tailwind in platinum,” said Stash Graham, managing director of Graham Capital Wealth Management.
Precious metals such as platinum, gold and silver have long been used to diversify an investment portfolio.
When choosing investments, it is crucial to consider potential drawbacks. While there may be an increase in the demand for platinum, other factors may throw a wrench in the investment benefits.
When considering an investment, it is essential to consider your current holdings and individual financial goals.
Platinum is rarer than both silver and gold, which could make it attractive to investors seeking a scarce metal. This practice helps protect other holdings, such as stocks, in an economic downturn. Investing in platinum can help balance inflation and economic uncertainties.
The price of the WTI crude oil futures are settling at $83.71 – its highest close since October 27, 2023. The price is up $0.54 or 0.77% on th day. The high price today reached $84.49. The low price was at $82.60.The gains today come after a 3.2% increase last week.
China’s Caixan Manufaturing PMI Data came in better than expected. The positive manufacturing data from China, showed expansion for the first time in six months in March, and supported the demand outlook for oil. The Caixan index came in at 51.1.
The economic challenges in the Chinese property sector, do not seem to be impacting the demand for crude oil.
Crude oil rose for the third consecutive month in March with a gain of 6.27%. That comes after a gain of 3.18% in February and a gain of 5.86% in January.
Meanwhile, OPEC and its allies have pledged to extend production cuts until the end of June, potentially tightening the supply during the summer months in the Northern Hemisphere.
Technically, the price moved above the March 19 high at $83.12 today (see chart below), and extended up to test the 61.8% retracement of the move down from the 2023 high at $84.59. The high price today fell short of that retracement level by $0.10 before rotating lower into the close.
Crude oil extended up toward the 61.8% retracement target
ChiniMandi, Mumbai: 1st April 2024
Domestic Market

Domestic sugar were mixed today
Domestic sugar prices in major markets were reported to be mixed, with prices falling in Uttar Pradesh while rising in Maharashtra. However, given the higher monthly prices, they are expected to remain under pressure in the coming days. Furthermore, demand is said to be weak in the major markets, which is likely to weigh on prices.
In Muzaffarnagar, M-grade sugar costs between Rs 3,750 and Rs 3,780 per quintal, while S-grade sugar is expected to cost between Rs 3,420 and Rs 3,460. Agrimandi expects the price of S grade sugar in the Kolhapur market to fall to between Rs 3,380 and Rs 3,460 per quintal within the next two weeks.
Ex-mill Sugar Prices as on April, 1 2024 :
|
State |
S/30 [Rates per Quintal] |
M/30 [Rates per Quintal] |
|
Maharashtra |
₹3410 to 3450 |
₹3490 to 3530 |
|
Karnataka |
₹3625 |
₹3675 |
|
Uttar Pradesh |
₹3750 to 3780 |
|
|
Gujarat |
₹3461 to 3491 |
₹3511 to 3551 |
|
Tamil Nadu |
₹3600 to 3800 |
₹3680 to 3850 |
|
Madhya Pradesh |
₹3600 to 3610 |
₹3650 to 3660 |
|
Punjab |
₹3825 to 3860 |
|
|
(All the above rates are excluding GST) |
||
Destination-wise Spot Prices as on April, 1 2024 :
|
City |
Grade |
Rate |
|
Delhi |
M/30 |
₹3,990.00 |
|
Kanpur |
M/30 |
₹3,942.75 |
|
Kolhapur |
M/30 |
₹3,727.50 |
|
Kolkata |
M/30 |
₹3,969.00 |
|
Muzaffarnagar |
M/30 |
₹3,937.50 |
International Market
At the time of writing this update London White Sugar #5 front month contract is not trading today on an occasion of Easter Monday, whereas the New York Sugar #11 front month contract is trading at 22.62 c/lb.
Currency, Commodity & Indian Indices
The rupee traded against the US dollar at 83.393 whereas USD was trading with BRL at 5.0147, Crude futures traded at ₹6916, Crude WTI traded at $82.88 barrel. Sensex closed 363.20 points higher at 74014.55 whereas Nifty ended 135.10 points higher at 22462.00
News Round-Up
Sugar production in Maharashtra crosses more than 107 lakh tonnes; 140 mills end operations
Sugar production in Maharashtra crosses more than 107 lakh tonnes; 140 mills end operations
Industry needs to adopt forward-looking approach to produce sugar as per changing consumer behaviour and other factors
Sensex, Nifty hit new highs
You have reached your limit of 5 free articles for this month.
Access all our articles, insights, and analysts.
Your coupon code
Gold price retreats from a fresh record high of $2,265.58 a troy ounce. XAU/USD rallied during Asian trading hours but turned south during European ones. XAU/USD currently trades around $2,240, as the US Dollar gathered momentum following the release of a much-better-than-anticipated United States (US) ISM Manufacturing PMI. The report showed that economic activity in the manufacturing sector expanded in March after contracting for 16 consecutive months, with the index jumping to 50.3 from 47.8 in February.
S&P Global also released the final estimate of its Manufacturing PMI, which was confirmed at 51.9, below the 52.5 expected but still with expansionary levels. The report added that “signs of improving wider economic conditions and market demand fed through to a further expansion of US manufacturing production in March, with the rate of expansion hitting a 22-month high. The rate of job creation also quickened, but new order growth softened.”
Meanwhile, Wall Street turned south. US indexes are down following the extended weekend, with the Dow Jones Industrial Average down over 200 points. Markets are posting a late reaction to Friday’s events. On the one hand, the Bureau of Economic Analysis (BEA) reported that the core Personal Consumption Expenditures (PCE) Price Index rose 0.3% MoM and 2.8% YoY in February, as expected. On the other hand, Federal Reserve (Fed) Chairman Jerome Powell participated in an interview open to questions, in which he repeated that the Fed is in no hurry to cut rates, as economic growth remains strong and inflation is above target.
Treasury yields are firmly up, with the 10-year note offering 4.33%, up 12 basis points (bps) and the 2-year note yielding 4.71% after adding 10 bps, both flirting with March highs.
The daily chart for the XAU/USD pair shows it filled an opening gap and bounced back while currently trading unchanged around its daily opening. The same chart shows moving averages maintain their bullish slopes far below the current level, reflecting bulls’ dominance. At the same time, technical indicators have lost their upward strength but remain within positive levels, with the Relative Strength Index (RSI) indicator currently consolidating around 76, with no signs of giving up.
Spot gold is correcting near-term extreme overbought conditions, as the 4-hour chart shows technical indicators retreated sharply, heading south almost vertically although well above their midlines. At the same time, moving averages have partially lost their upward momentum but are developing below the current level, with the 20 SMA currently providing dynamic support at around $2,208.05.
Support levels: 2,228.40 2,208.05 2,184.70
Resistance levels: 2,250.00 2,265.60, 2,280.00

03:33:09 PM IST, 01 April 2024
Oil And Natural Gas Corporation closed at a price of Rs 270.0, marking a modest increase of 0.73% for the day.
03:16:18 PM IST, 01 April 2024
Oil And Natural Gas Corporation is currently trading at Rs 270.1, marking a 0.77% increase today. The 3-day Simple Moving Average stands at Rs 265.1, indicating a positive trend in the stock’s performance.
02:48:38 PM IST, 01 April 2024
Oil And Natural Gas Corporation is currently trading at Rs 269.8, showing a marginal increase of 0.66% today. Over the past year, the stock has delivered impressive returns of 78.48% to its investors.
02:15:50 PM IST, 01 April 2024
Oil And Natural Gas Corporation is currently trading at Rs 269.80, marking a 0.66% increase today. The 7-day Simple Moving Average stands at Rs 263.51, indicating a positive trend in the stock’s performance.
02:01:46 PM IST, 01 April 2024
01:47:32 PM IST, 01 April 2024
Oil And Natural Gas Corporation is currently trading at Rs 269.90, showing a modest increase of 0.7% today. Over the past 6 months, the stock has delivered impressive returns of 40.84%, reflecting strong performance in the market.
01:17:33 PM IST, 01 April 2024
Oil And Natural Gas Corporation is currently trading at Rs 269.75, showing a marginal increase of 0.64% today. Over the past week, the stock has delivered a return of 2.39%. Investors are closely monitoring the company’s performance amidst fluctuating market conditions.
12:47:57 PM IST, 01 April 2024
Oil And Natural Gas Corporation is currently trading at Rs 270.30, showing a modest increase of 0.84% today. The stock has delivered a 1-day return of 0.86%, reflecting steady performance in the market.
12:17:42 PM IST, 01 April 2024
Oil And Natural Gas Corporation is currently trading at Rs 270.20, showing a modest increase of 0.81% today. Over the past 5 years, the stock has delivered impressive returns of 71.73% to its investors.
12:03:36 PM IST, 01 April 2024
11:48:41 AM IST, 01 April 2024
Oil And Natural Gas Corporation is currently trading at Rs 269.95, showing a marginal increase of 0.71% today. Over the past month, the stock has experienced a slight decline of -0.09% in returns.
11:18:53 AM IST, 01 April 2024
Oil And Natural Gas Corporation is currently trading at a price of Rs 270.35, showing a modest increase of 0.86% today. Over the past three months, the stock has delivered impressive returns of 31.53% to its investors.
10:48:12 AM IST, 01 April 2024
Oil And Natural Gas Corporation is currently trading at Rs 270.35, marking a 0.86% increase today. The 5-day Exponential Moving Average stands at Rs 264.52, indicating a positive trend in the stock’s performance.
10:16:43 AM IST, 01 April 2024
Oil And Natural Gas Corporation is currently trading at Rs 270.85, marking a 1.05% increase from the previous day. The 5-day Simple Moving Average stands at Rs 264.3, indicating a positive trend in the stock’s performance.
10:03:37 AM IST, 01 April 2024
09:47:49 AM IST, 01 April 2024
Oil And Natural Gas Corporation is currently trading at Rs 270.15, marking a 0.79% increase today. The trading volume stands at 1,513,013 shares, while the average volume over the past 7 days is 17,826,989 shares.
09:29:18 AM IST, 01 April 2024
The stock price of ONGC has recently dipped below its 20-day Simple Moving Average, with the current price at Rs 267.80 showing a decrease of 0.09% compared to the previous day’s closing price of Rs 267.82.
09:13:53 AM IST, 01 April 2024
Oil And Natural Gas Corporation ended the previous trading day at a closing price of Rs 268.05, marking a negative 1-month return of -0.57%. Despite recent fluctuations, the company continues to navigate the volatile energy market with resilience.
09:02:28 AM IST, 01 April 2024
Oil And Natural Gas Corporation ended the previous trading day at a closing price of Rs 268.05, marking a weekly return of 1.94%. Investors witnessed a positive trend in the stock’s performance over the past week.
08:49:48 AM IST, 01 April 2024
Oil And Natural Gas Corporation closed at Rs 268.05 on the previous day with a trading volume of 18,888,942 shares, surpassing the average 7-day volume of 16,145,554 shares.
08:41:00 AM IST, 01 April 2024
Oil And Natural Gas Corporation ended the previous day at a closing price of Rs 268.05, with a remarkable 3-month return of 28.68%. Investors witnessed a significant growth in their investments over the past quarter.
Gold price is consolidating the latest uptick to a new all-time high of $2,260, kicking off Easter Monday and the second quarter of 2024 on a positive note. Extended Easter holiday-induced thin liquidity conditions aid the Gold price uptrend amid a broadly subdued US Dollar.
The US Dollar remains defensive, as markets set off the new quarter with optimism, especially after China’s Manufacturing and Services PMI data surpassed expectations in March. On Sunday, China’s official Manufacturing Purchasing Managers’ Index (PMI) jumped to 50.8 in March, compared with the 49.1 contraction reported in February and above the estimates of a 49.9 figure. The Non-Manufacturing PMI rose to 53.3 in the same period vs. February’s 51.4. Meanwhile, China’s Caixin Manufacturing Purchasing Managers’ Index (PMI) edged higher to 51.1 in March on Monday, beating estimates of 51.0.
Additionally, increased bets that the US Federal Reserve (Fed) will begin lowering interest rates in June, following Friday’s US Personal Consumption Expenditures (PCE) Price Index, exert downside pressure on the US Dollar, keeping Gold price underpinned.
Inflation in the US, as measured by the change in Personal Consumption Expenditures (PCE) Price Index, increased slightly to 2.5% on a yearly basis in February, data released by the US Bureau of Economic Analysis (BEA) showed Friday. The reading met the consensus forecast and followed January’s 2.4% increase. The Core PCE Price Index, which excludes volatile food and energy prices, rose at an annual pace of 2.8%, in line with the market expectations but slowing from a 2.9% increase reported previously.
Markets are currently pricing a 68% probability of a June Fed rate cut, up from 63% seen before the PCE data release. Heightened expectations of a June Fed rate cut come even after Fed Chair Jerome Powell said Friday that “the economy is strong” and there is “no hurry to cut rates.” Powell participated in a discussion at the Macroeconomics and Monetary Policy Conference, in San Francisco, on Friday.
Looking ahead, the US Nonfarm Payrolls data, due on Friday, will be critical to sealing in a June Fed rate cut, having a significant impact on the value of the US Dollar and on the Gold price direction. In the meantime, the return of full markets in the US after the long Easter weekend break could trigger a bout of profit-taking in Gold price, as markets resort to position readjustment, in anticipation of the US employment data, trickling in from Tuesday.
Later on Monday, the US ISM Manufacturing PMI data will be also closely scrutinized for fresh hints on the strength of the US economy, influencing the market’s pricing of the Fed rate cut expectations and, in turn, the non-interest-beating Gold price.
As observed on the day chart, Gold price achieved the Bull Flag target measured at $2,251 on its way to renewing the lifetime highs at $2,260 on Monday.
The 14-day Relative Strength Index (RSI), lies in the extremely overbought zone near 80.0, suggesting that Gold price remains primed for a corrective pullback any time soon.
If that happens, the immediate support could be found at the previous record high of $2,236 set on Thursday. A breach of the latter could fuel a sharp drop toward the $2,200 threshold.
Further south, Thursday’s low of $2,187 will be challenged, followed by the bullish 21-day Simple Moving Average (SMA) at $2,168.
Should Gold buyers manage to defy the bearish odds, a test of the $2,270 round level cannot be ruled out.
The next on Gold buyers’ radars will be the $2,300 psychological level.
Gold has played a key role in human’s history as it has been widely used as a store of value and medium of exchange. Currently, apart from its shine and usage for jewelry, the precious metal is widely seen as a safe-haven asset, meaning that it is considered a good investment during turbulent times. Gold is also widely seen as a hedge against inflation and against depreciating currencies as it doesn’t rely on any specific issuer or government.
Central banks are the biggest Gold holders. In their aim to support their currencies in turbulent times, central banks tend to diversify their reserves and buy Gold to improve the perceived strength of the economy and the currency. High Gold reserves can be a source of trust for a country’s solvency. Central banks added 1,136 tonnes of Gold worth around $70 billion to their reserves in 2022, according to data from the World Gold Council. This is the highest yearly purchase since records began. Central banks from emerging economies such as China, India and Turkey are quickly increasing their Gold reserves.
Gold has an inverse correlation with the US Dollar and US Treasuries, which are both major reserve and safe-haven assets. When the Dollar depreciates, Gold tends to rise, enabling investors and central banks to diversify their assets in turbulent times. Gold is also inversely correlated with risk assets. A rally in the stock market tends to weaken Gold price, while sell-offs in riskier markets tend to favor the precious metal.
The price can move due to a wide range of factors. Geopolitical instability or fears of a deep recession can quickly make Gold price escalate due to its safe-haven status. As a yield-less asset, Gold tends to rise with lower interest rates, while higher cost of money usually weighs down on the yellow metal. Still, most moves depend on how the US Dollar (USD) behaves as the asset is priced in dollars (XAU/USD). A strong Dollar tends to keep the price of Gold controlled, whereas a weaker Dollar is likely to push Gold prices up.


