The main category of Forex News.
You can use the search box below to find what you need.
[wd_asp id=1]
The main category of Forex News.
You can use the search box below to find what you need.
[wd_asp id=1]
The EUR/USD pair closes July with modest gains near the 1.1500 mark, adding over 1.1% in the last trading week. Price action throughout the month was dull to say the least as investors remained clueless, although the pair managed to hit 1.1530 ahead of the close. The lack of action was compounded by persistent uncertainty, centered on developments in the Middle East and the United States (US) Federal Reserve’s (Fed ) monetary policy path.
Regarding the first, an escalation of the US-Iran war spurred US Dollar (USD) demand at the beginning of the week after continued tit-for-tat attacks around the Strait of Hormuz, which, by the way, is once again closed. Mood improved early in the week amid a pause in attacks and headlines suggesting a fresh round of negotiations.
Renewed war headlines, however, were quickly overshadowed by the US Fed monetary policy announcement on Wednesday. The USD plunged after the central bank decided to leave the benchmark rate unchanged, with the split vote leaving it at a range of 3.50%-3.75%. Three regional bank presidents dissented, preferring an immediate 25-basis-point (bps) rate hike: Cleveland’s Beth Hammack, Minneapolis’s Neel Kashkari, and Dallas’s Lorie Logan.
The USD collapsed following the Fed’s decision as investors believed Chair Warsh had chickened out. He kept repeating his commitment to curb inflation and to price stability, but the Fed left rates unchanged for the fifth consecutive meeting.
Of course, he did not provide clear guidance on the future path of monetary policy, not actually a surprise. And he failed to specify how he intends to resolve five-year-long inflationary pressure despite affirming that there is no “soft” inflation target.
“We are on the job, we will deliver, we are focused like a laser on making sure we can do it, but the suggestion that we’re going to be able to do it with our magic wand is one I want to disabuse you and everyone else of,” Warsh said.
Market players did not take well to the myriad empty words and the lack of action. However, bets on a September rate hike have increased after the dust settled. According to the CME FedWatch Tool, the chances of a hike increased to 65% from 55% one week before the Federal Open Market Committee (FOMC) announcement.
Still, there’s a long way ahead of September, and loads could happen in the way. The focus will remain on data — inflation and employment figures — and Middle East developments.
Meanwhile, the US published the preliminary estimate of the Q2 Gross Domestic Product (GDP), which showed that the economy expanded at an annual rate of 1.5%, missing expectations and below the Q1 reading of 2.1%. Other details of the report showed that the GDP Price Index jumped to 6.3% in Q2 from 3.6% in Q1, while the quarterly core Personal Consumption Expenditures (PCE) Price Index, the Fed’s favorite inflation gauge, increased 3.3% on a yearly basis, matching the market expectation. In June, the core PCE Price Index ticked lower on a yearly basis, to 3.3% from 3.4% in May, still far above the Fed’s 2% goal.
US President Donald Trump said for the umpteenth time on Friday that the war is “going well” and that the US “keeps winning.” No strikes between Washington and Tehran were reported by the end of the week, a short truce that at least was enough to contain fears. Still, unrest leads the region as traffic through the Strait of Hormuz declined to the levels seen before the Memorandum of Understanding (MoU), while Kuwait and Egypt reported Iranian attacks early Friday.
On a positive note, US President Trump announced an historic agreement to secure the disarmament of Hamas, while a senior Hamas official confirmed it to CNN, contingent on Israel upholding its obligations. This is the first time Hamas has agreed to a specific plan to hand over weapons.
The song remains the same: the US demands Iran drops its nuclear program, while Iran requests full control of the critical sea passage. Neither side is willing to give up on those terms.
Data coming from Europe provided support to the Euro: Germany and the Eurozone (EU) released the preliminary estimates of the Q2 GDP. Annualized growth in Germany rose 0.9%, modest yet better than the 0.4% posted in Q1. The EU figure printed at 1%, up from the previous 0.3%.
German inflation met expectations as the preliminary estimate of the July Harmonized Index of Consumer Prices printed at 2.8% YoY, higher than the 2.4% from June. The EU HICP in the same period resulted in 2.5%, in line with expectations and slightly above the previous 2.4%.
Still, financial markets price in roughly a 65% probability that the European Central Bank (ECB) will deliver a 25 bps rate hike at the September meeting. Again, too early to speculate about that.
Regardless, European data was encouraging enough to spook concerns, which ended up helping the Euro on its way north. It should not be a surprise, however, if the Greenback resumes its rally on the back of war-related fears.
The first week of August will be a busy one. Germany will kick-start macroeconomic releases by publishing June Retail Sales, while the US will publish the ISM Manufacturing Purchasing Managers Index (PMI) on Monday. The ISM Services PMI will be out on Wednesday, while EU June Retail Sales are scheduled for Thursday.
S&P Global, alongside local banks, will release the final estimates of the July PMIs for major economies throughout the week.
Midweek, the focus will turn to employment as the US releases June JOLTS Job Openings, the July ADP Employment Change report, and July Challenger Job Cuts ahead of the July Nonfarm Payrolls (NFP) report scheduled for Friday. The US is expected to have added 91K new jobs in the month, up from the 57K added in June, while the Unemployment Rate is foreseen at 4.3%, up from the 4.2% posted in June.
From a technical perspective, based on the daily chart, EUR/USD has partially recovered its bullish poise. The pair has run past a now mildly bullish 20-day Simple Moving Average (SMA) at 1.1430, although it remains below the 100-day and 200-day simple SMAs at 1.1568 and 1.1631, respectively, keeping the broader backdrop bearish despite the latest bounce. The 14-day Relative Strength Index (RSI) indicator turned lower but stands at 58, while the Momentum indicator holds flat above its midline, suggesting that buying interest has improved, though not enough to confirm a trend change.

In the weekly chart, EUR/USD maintains a mildly bearish near-term bias, holding below the 20-week SMA at 1.1565 while still trading above the 100- and 200-week SMAs at 1.1311 and 1.1032, respectively. Technical indicators have rotated higher, but remain below their midlines, reflecting the latest advance yet far from suggesting a bullish extension ahead.
On the topside, initial resistance is at the 100-day SMA near 1.1568, with the 200-day SMA at around 1.1631 as the next significant barrier if buyers extend the advance. On the downside, immediate support emerges at the 20-day SMA at 1.1424, where a break would expose a deeper pullback toward the June low at 1.1324.
(The technical analysis of this story was written with the help of an AI tool. Know more.)
According to TD Securities, recent price action has seen “US swap spreads have tightened, and the yield curve has steepened,” reshaping relative value across rates and credit markets. The bank argues that “questions around the Fed’s credibility are supportive for USD SSA G-spreads,” and, in this context, it “look[s] for front-end EUR and GBP to outperform vs USD” as investors reassess opportunities along the front end of major curves.
The Pound to Dollar exchange rate (GBP/USD) ended July around 1.3482 after gaining 1.75% over the month and rebounding strongly from lows below 1.33.
GBP/USD rose around 0.85% over the final 48 hours of July, reaching a high near 1.3495 and finishing close to the top of that range.

Over the past three months, the pair has traded between approximately 1.3142 and 1.3658, leaving the latest rate near the middle of its broader spring and summer range.
MUFG believes the Bank of England’s latest communication remains supportive for Sterling, although policymakers stopped short of signalling an imminent rate increase.
The Monetary Policy Committee left rates unchanged, with MUFG’s textual analysis describing the written contributions as consistent with a hawkish hold. Policymakers continued to emphasise inflation persistence, second-round effects and the risks posed by energy prices and geopolitical uncertainty.
The committee remains divided. MUFG’s framework placed Catherine Mann firmly in hawkish territory, followed by Huw Pill and Megan Greene, while Swati Dhingra and Alan Taylor remained on the dovish wing.
Mann’s shift was particularly notable, with her comments placing greater weight on inflation risks arising from Middle East tensions and volatile energy prices.
The press conference delivered a more balanced signal than the written statement, however.
MUFG scored the MPC contributions at 23.3 on its hawk-dove scale, compared with a softer 17.0 for Governor Andrew Bailey’s press conference.
Bailey explicitly warned markets not to leave the meeting believing that the MPC was “edging towards a hike”.
That distinction is important for Pound Sterling.
The BoE remains concerned enough about inflation to resist a dovish shift, supporting UK yields and the Pound, but it is not yet preparing investors for another tightening move.
According to MUFG, “the communication remains supportive, but the deliberate pushback against rate hike expectations limits the scope for upside.”


The Pound-Dollar exchange rate charts reinforce that mixed picture.
GBP/USD has recovered above both its short-term moving averages, but remains below the May high near 1.3658.
A clean move through 1.3500 would improve the immediate technical tone, while the 1.3550-1.3660 area is likely to offer stronger resistance.
Pound Sterling’s rebound can therefore extend while the Dollar remains under pressure, but MUFG’s assessment suggests the BoE alone is unlikely to drive GBP/USD decisively beyond its recent highs.
Our currency coverage draws on live market data, official economic releases and published bank research.
Domestic coffee prices today
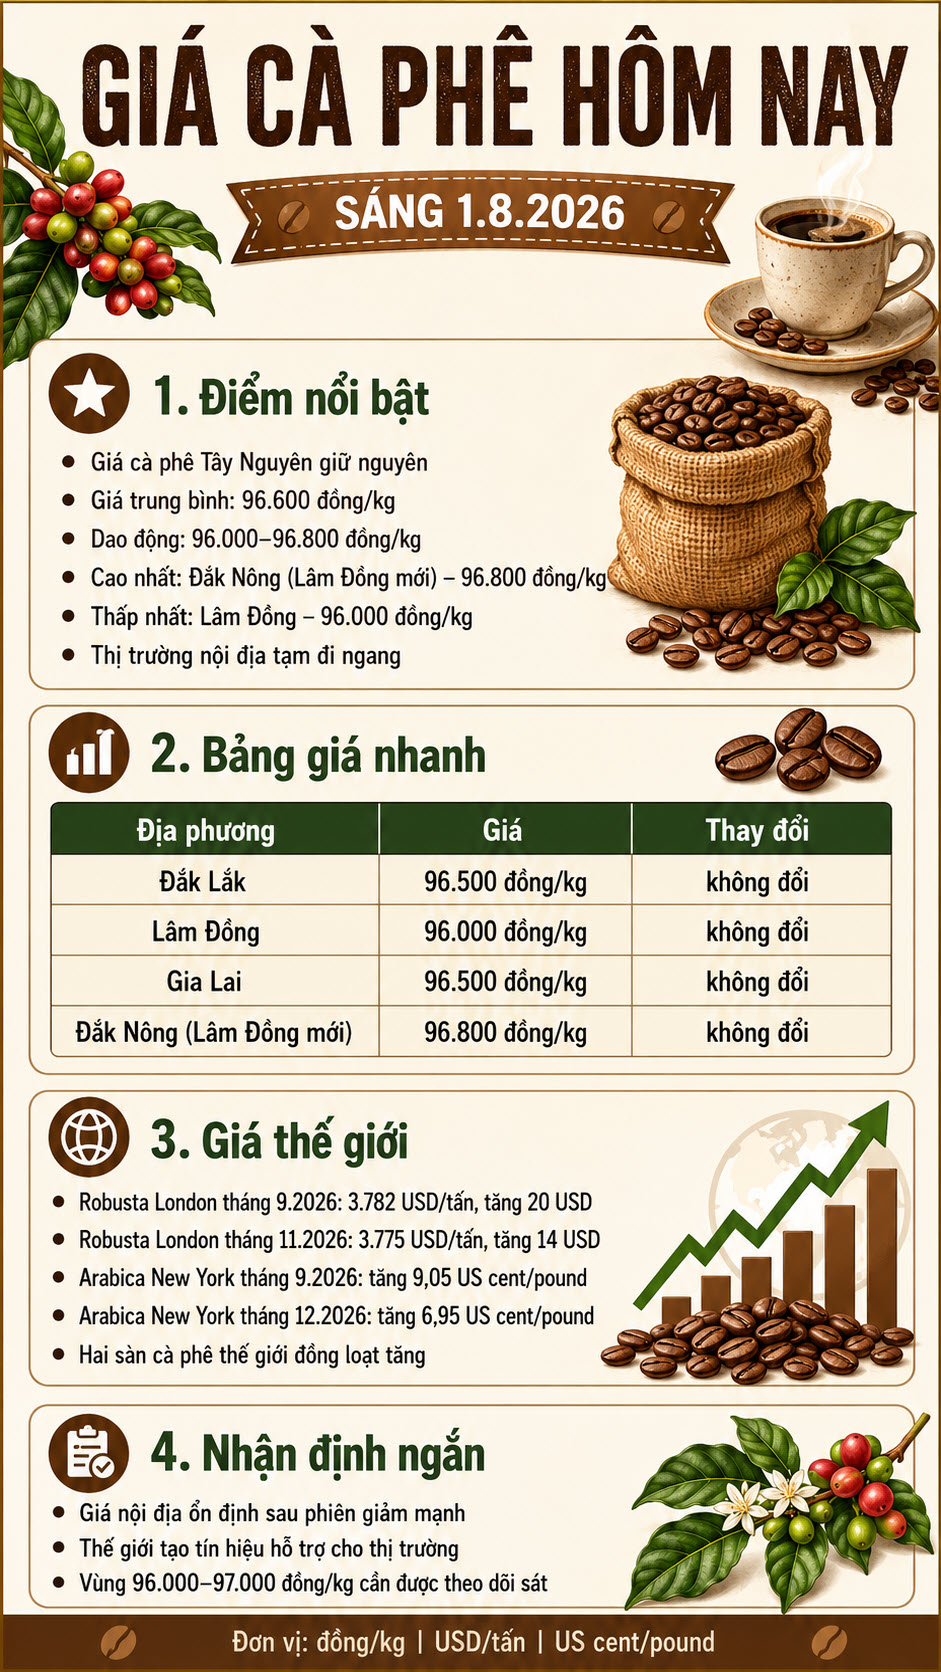
Coffee prices today in the domestic market increased slightly compared to the previous day. Coffee prices on August 1st averaged 96,800 VND/kg, up 200 VND/kg.
The highest price in key regions of the Central Highlands was recorded at 97,000 VND/kg. This is a higher price range than the session on July 30, but it has not yet regained the close of 99,000 VND/kg recorded last week.
With an increase of 200 VND/kg, domestic coffee prices are showing a slight recovery after a sharp decrease in the previous session. The increase range is not large, showing that the domestic market is still cautious even though world prices have recovered.
World coffee prices
In the world market, coffee prices increased in the most recent session. According to data from Barchart, the September 2026 Arabica contract closed the session up 9.05 US cents/lb, equivalent to 2.80%, to 332.10 US cents/lb.
Robusta also increased but the amplitude was much narrower. Robusta futures contract for September 2026 closed the session up 2 USD/ton, equivalent to 0.05%, to 3,782 USD/ton.
This development shows that the upward momentum of the world market is more concentrated in Arabica, while Robusta is almost flat. Therefore, the supporting effect on domestic coffee prices is not yet too strong.
Coffee price assessment
Domestic coffee prices increased slightly in the context of the world market recovery. However, the increase of 200 VND/kg is not enough to create a breakthrough signal, especially when Robusta London only increased very slightly in the most recent session.
Arabica increased sharply in the last session of July as short-term supply tightened, Arabica stocks certified on ICE continuously decreased for 4.5 months and fell to a 2.5-year low. This is a factor that supports the Arabica group more clearly than Robusta.
For the Vietnamese market, Robusta is still a variable that needs to be closely monitored due to its direct impact on domestic purchasing prices. If Robusta only narrowly fluctuates around the 3,700-3,800 USD/ton range, domestic prices may continue to increase slowly or move sideways instead of rebounding strongly.
Regarding the weather, the National Center for Hydro-Meteorological Forecasting said that on the day and night of August 1st, the Central Highlands area will be sunny during the day, with showers and thunderstorms in some places in the late afternoon and night; the lowest temperature is 20-23 degrees C, in some places below 20 degrees C, the highest is 28-31 degrees C.
Rainstorms in this season need to be monitored in terms of garden care, pest and disease prevention, and goods preservation.
Coffee prices in the Central Highlands region today, August 1st, 2026, remained unchanged compared to the previous day, fluctuating between 96,000 and 96,800 VND/kg. While the domestic market remained relatively stable, Robusta London and Arabica New York prices closed the week in positive territory.

According to the updated price list, the average coffee price in key production areas remains at 96,600 VND/kg. The highest purchase price continues to be recorded in Dak Nong (formerly Lam Dong ), at 96,800 VND/kg.
In Dak Lak , coffee is being purchased at 96,500 VND/kg. Gia Lai also maintains the same price.
Lam Dong continues to have the lowest price, at 96,000 VND/kg. Dak Nong (new Lam Dong) tops the list with 96,800 VND/kg.
| Market | Purchase price | Change |
|---|---|---|
| Dak Lak | 96,500 VND/kg | Unchanged |
| Lam Dong | 96,000 VND/kg | Unchanged |
| Gia Lai | 96,500 VND/kg | Unchanged |
| Dak Nong (formerly Lam Dong) | 96,800 VND/kg | Unchanged |
| Medium | 96,600 VND/kg | Unchanged |
The difference between the highest and lowest prices is currently 800 VND/kg. The purchasing prices across different raw material regions remain relatively close, indicating that the market has not yet shown significant differentiation.
The fact that coffee prices remained unchanged on the morning of August 1, 2026, followed a sharp correction on July 31, 2026, when the average price fell by 1,800 VND/kg to 96,600 VND/kg.
Following the rapid decline, both buyers and those with remaining stock tend to be more cautious. Dealers are not in a hurry to raise purchase prices, while growers continue to observe the global market before deciding to sell.
Prices above 96,000 VND/kg are still relatively high, but they are quite far from the psychological target of 100,000 VND/kg that had been expected in previous sessions.
On the London exchange, Robusta coffee prices closed in positive territory across key contract periods.
The September 2026 contract reached approximately $3,782 per ton, up $20. The November 2026 contract stood at $3,775 per ton, up $14.
Forward contracts also rose slightly. The January 2027 contract reached $3,744 per ton, while the March 2027 contract was at $3,715 per ton.
| Robusta contract | Closing price | Change |
| September 2026 | 3,782 USD/ton | +20 USD |
| November 2026 | 3,775 USD/ton | +14 USD |
| January 2027 | 3,744 USD/ton | +16 USD |
| March 2027 | 3,715 USD/ton | +17 USD |
While the increase in Robusta prices hasn’t been significant, it’s a positive sign for Vietnamese market sentiment, as this type of coffee plays a dominant role in domestic production and export.
Arabica coffee prices on the New York exchange also rose across the main contract periods.
The September 2026 contract rose approximately 9.05 US cents per pound, or 2.8%. The December 2026 contract increased by 6.95 US cents per pound, or 2.26%.
The March 2027 and May 2027 contracts both rose by approximately 5.70 US cents per pound.
The simultaneous increase in both Robusta and Arabica prices indicates that buying pressure has returned to the futures market. However, this increase occurred in just one session and is not yet sufficient to confirm a long-term recovery trend.
Domestic coffee prices are often influenced by Robusta London prices, but this doesn’t always happen immediately. Purchase prices also depend on delivery demand, the amount of coffee held by farmers, bean quality, transportation costs, and the level of competition among dealers.
In addition, the domestic market has just experienced a sharp decline, so purchasing units tend to wait for further signals before adjusting prices.
If Robusta London maintains its upward momentum in the following sessions, coffee prices in the Central Highlands may receive further support. Conversely, if world prices reverse, the domestic market is likely to continue fluctuating around the current level.
In the short term, the 96,000–97,000 VND/kg range remains a key area to monitor. The fact that the price has held above 96,000 VND/kg indicates that there is no selling pressure yet.
For a clearer recovery to form, domestic coffee prices need further support from Robusta London, and buying activity in producing regions must improve.
Growers with remaining stock should monitor developments over several consecutive trading sessions, financial needs, and actual purchase prices at each dealer. Listed prices may vary depending on coffee quality, delivery location, and payment method.
Thus, coffee prices today, August 1, 2026, remain unchanged in all surveyed localities. Dak Nong (new Lam Dong) continues to have the highest price at 96,800 VND/kg, while Lam Dong has the lowest at 96,000 VND/kg. On the world market, Robusta London and Arabica New York both increased.
Source: https://baovanhoa.vn/kinh-te/gia-ca-phe-hom-nay-182026-noi-dia-di-ngang-the-gioi-tang-252554.html
The EUR/USD pair closes July with modest gains near the 1.1500 mark, adding over 1.1% in the last trading week. Price action throughout the month was dull to say the least as investors remained clueless, although the pair managed to hit 1.1530 ahead of the close. The lack of action was compounded by persistent uncertainty, centered on developments in the Middle East and the United States (US) Federal Reserve’s (Fed ) monetary policy path.
Regarding the first, an escalation of the US-Iran war spurred US Dollar (USD) demand at the beginning of the week after continued tit-for-tat attacks around the Strait of Hormuz, which, by the way, is once again closed. Mood improved early in the week amid a pause in attacks and headlines suggesting a fresh round of negotiations.
Renewed war headlines, however, were quickly overshadowed by the US Fed monetary policy announcement on Wednesday. The USD plunged after the central bank decided to leave the benchmark rate unchanged, with the split vote leaving it at a range of 3.50%-3.75%. Three regional bank presidents dissented, preferring an immediate 25-basis-point (bps) rate hike: Cleveland’s Beth Hammack, Minneapolis’s Neel Kashkari, and Dallas’s Lorie Logan.
The USD collapsed following the Fed’s decision as investors believed Chair Warsh had chickened out. He kept repeating his commitment to curb inflation and to price stability, but the Fed left rates unchanged for the fifth consecutive meeting.
Of course, he did not provide clear guidance on the future path of monetary policy, not actually a surprise. And he failed to specify how he intends to resolve five-year-long inflationary pressure despite affirming that there is no “soft” inflation target.
“We are on the job, we will deliver, we are focused like a laser on making sure we can do it, but the suggestion that we’re going to be able to do it with our magic wand is one I want to disabuse you and everyone else of,” Warsh said.
Market players did not take well to the myriad empty words and the lack of action. However, bets on a September rate hike have increased after the dust settled. According to the CME FedWatch Tool, the chances of a hike increased to 65% from 55% one week before the Federal Open Market Committee (FOMC) announcement.
Still, there’s a long way ahead of September, and loads could happen in the way. The focus will remain on data — inflation and employment figures — and Middle East developments.
Meanwhile, the US published the preliminary estimate of the Q2 Gross Domestic Product (GDP), which showed that the economy expanded at an annual rate of 1.5%, missing expectations and below the Q1 reading of 2.1%. Other details of the report showed that the GDP Price Index jumped to 6.3% in Q2 from 3.6% in Q1, while the quarterly core Personal Consumption Expenditures (PCE) Price Index, the Fed’s favorite inflation gauge, increased 3.3% on a yearly basis, matching the market expectation. In June, the core PCE Price Index ticked lower on a yearly basis, to 3.3% from 3.4% in May, still far above the Fed’s 2% goal.
US President Donald Trump said for the umpteenth time on Friday that the war is “going well” and that the US “keeps winning.” No strikes between Washington and Tehran were reported by the end of the week, a short truce that at least was enough to contain fears. Still, unrest leads the region as traffic through the Strait of Hormuz declined to the levels seen before the Memorandum of Understanding (MoU), while Kuwait and Egypt reported Iranian attacks early Friday.
On a positive note, US President Trump announced an historic agreement to secure the disarmament of Hamas, while a senior Hamas official confirmed it to CNN, contingent on Israel upholding its obligations. This is the first time Hamas has agreed to a specific plan to hand over weapons.
The song remains the same: the US demands Iran drops its nuclear program, while Iran requests full control of the critical sea passage. Neither side is willing to give up on those terms.
Data coming from Europe provided support to the Euro: Germany and the Eurozone (EU) released the preliminary estimates of the Q2 GDP. Annualized growth in Germany rose 0.9%, modest yet better than the 0.4% posted in Q1. The EU figure printed at 1%, up from the previous 0.3%.
German inflation met expectations as the preliminary estimate of the July Harmonized Index of Consumer Prices printed at 2.8% YoY, higher than the 2.4% from June. The EU HICP in the same period resulted in 2.5%, in line with expectations and slightly above the previous 2.4%.
Still, financial markets price in roughly a 65% probability that the European Central Bank (ECB) will deliver a 25 bps rate hike at the September meeting. Again, too early to speculate about that.
Regardless, European data was encouraging enough to spook concerns, which ended up helping the Euro on its way north. It should not be a surprise, however, if the Greenback resumes its rally on the back of war-related fears.
The first week of August will be a busy one. Germany will kick-start macroeconomic releases by publishing June Retail Sales, while the US will publish the ISM Manufacturing Purchasing Managers Index (PMI) on Monday. The ISM Services PMI will be out on Wednesday, while EU June Retail Sales are scheduled for Thursday.
S&P Global, alongside local banks, will release the final estimates of the July PMIs for major economies throughout the week.
Midweek, the focus will turn to employment as the US releases June JOLTS Job Openings, the July ADP Employment Change report, and July Challenger Job Cuts ahead of the July Nonfarm Payrolls (NFP) report scheduled for Friday. The US is expected to have added 91K new jobs in the month, up from the 57K added in June, while the Unemployment Rate is foreseen at 4.3%, up from the 4.2% posted in June.
From a technical perspective, based on the daily chart, EUR/USD has partially recovered its bullish poise. The pair has run past a now mildly bullish 20-day Simple Moving Average (SMA) at 1.1430, although it remains below the 100-day and 200-day simple SMAs at 1.1568 and 1.1631, respectively, keeping the broader backdrop bearish despite the latest bounce. The 14-day Relative Strength Index (RSI) indicator turned lower but stands at 58, while the Momentum indicator holds flat above its midline, suggesting that buying interest has improved, though not enough to confirm a trend change.
In the weekly chart, EUR/USD maintains a mildly bearish near-term bias, holding below the 20-week SMA at 1.1565 while still trading above the 100- and 200-week SMAs at 1.1311 and 1.1032, respectively. Technical indicators have rotated higher, but remain below their midlines, reflecting the latest advance yet far from suggesting a bullish extension ahead.
On the topside, initial resistance is at the 100-day SMA near 1.1568, with the 200-day SMA at around 1.1631 as the next significant barrier if buyers extend the advance. On the downside, immediate support emerges at the 20-day SMA at 1.1424, where a break would expose a deeper pullback toward the June low at 1.1324.
(The technical analysis of this story was written with the help of an AI tool. Know more.)
According to TD Securities, recent price action has seen “US swap spreads have tightened, and the yield curve has steepened,” reshaping relative value across rates and credit markets. The bank argues that “questions around the Fed’s credibility are supportive for USD SSA G-spreads,” and, in this context, it “look[s] for front-end EUR and GBP to outperform vs USD” as investors reassess opportunities along the front end of major curves.
Silver extended its decline on Thursday, falling more than 3% to around $57.22 an ounce and trading close to the bottom of the day’s range.
The metal has now lost around 17% since the start of 2026, having fallen sharply from its January peak above $120.
UBS nevertheless expects the market to recover over the coming quarters.
The bank’s latest global forecasts put silver at $65 by September 2026, rising to $70 in December, $75 by March 2027 and remaining at that level in June 2027.
That implies upside of more than 30% from current levels, although the forecast path points to a gradual recovery rather than an immediate return to this year’s highs.

Silver fell steadily through Thursday’s session, with XAG/USD finishing close to its intraday low.
The outlook broadly tracks UBS’s bullish forecast for gold, although silver’s larger industrial component leaves it more sensitive to the global growth outlook.
Weak manufacturing demand, tighter financial conditions and a firmer Dollar can all weigh more heavily on silver than on gold, particularly during periods of risk aversion.
The latest price action remains fragile. XAG/USD is trading below both its 20-day and 50-day moving averages, while Thursday’s decline pushed the metal back towards the lower end of its recent range.
UBS’s forecasts suggest the bank sees current weakness as temporary rather than the start of a deeper structural decline.
Its projected rise to $65 by September would mark the first stage of the recovery, with further gains expected as precious-metals demand improves and the drag from US interest-rate expectations begins to fade.

Silver remains down 17.1% in 2026 and well below its January high, although UBS expects prices to recover over the next year.
The immediate technical picture remains weak, but UBS’s $75 forecast indicates that the bank still expects silver to regain ground once monetary and investment conditions become more supportive.
Our currency coverage draws on live market data, official economic releases and published bank research.
The Pound to Dollar exchange rate (GBP/USD) traded around 1.3443 on Friday morning after gaining more than 1.3% over the previous two sessions.
GBP/USD closed Thursday at 1.3461, leaving the pair 1.6% higher for July but still below the month’s 1.3558 peak.
Rabobank expects that recovery to fade, forecasting Cable in a 1.32–1.33 range over the next one to three months.
The bank’s argument is that markets have already tightened UK monetary conditions on the Bank of England’s behalf by pricing further rate increases and pushing borrowing costs higher.
“In RaboResearch’s view, the heavy lifting done by the market may help the Bank avoid an actual hike in policy rates,” Rabobank said.
Thursday’s BoE decision reinforced that possibility. Bank Rate remained at 3.75%, despite three policymakers voting for an immediate increase.
The vote looked hawkish, but the majority still preferred to wait for clearer evidence that higher energy costs were feeding into wages and domestic prices.
Rabobank believes markets will initially continue “taking the BoE’s hawkish rhetoric at face value and maintain its expectations of rate hikes”.
The risk is that investors eventually demand action.
The bank questioned whether another unchanged decision could cause markets to doubt whether the Monetary Policy Committee is “truly focused on its inflation mandate”, particularly if policymakers continue talking tough without raising rates.

The latest Exchange Rates UK forecast survey poll, see chart above, broadly supports Rabobank’s near-term caution. The median bank projection falls to around 1.33 by the end of the third quarter before recovering gradually through 2027 and moving above 1.40 in late 2028.
Rabobank is less convinced about the Pound’s medium-term prospects.
“Further out we see risk that UK fiscal concerns will combine with steady BoE rates to weigh on the pound,” the bank said.
The UK labour market remains central to that view. Before the energy shock, weaker employment conditions had supported expectations that the BoE would cut rates this year.
Recent signs of stabilisation have complicated the picture and may increase the risk of “second order price effects” as oil prices rise again.
Rabobank said stronger labour data or “another ramp higher in UK CPI inflation data” could increase pressure on the Bank “to put its money where its mouth is”.
Rabobank’s range implies that Thursday’s move above 1.34 will not be sustained.
A decline to 1.33 would reverse much of the latest rally, while 1.32 would return Cable towards the lower part of its recent trading range.
The Dollar side is also important. Sterling benefited when short-term US yields and the greenback fell after the Federal Reserve held rates steady, but Rabobank does not view that as enough to secure a lasting Pound advance.
Its central judgement is that the BoE may continue using hawkish language while avoiding an actual increase.
That strategy can support Sterling only while markets believe a hike remains credible. Rabobank’s 1.32–1.33 forecast suggests that confidence will become harder to maintain.
Our currency coverage draws on live market data, official economic releases and published bank research.
Domestic coffee prices today
Coffee prices today in the domestic market have not recorded a clear recovery after the previous sharp decrease session. According to updated data on the morning of July 31, coffee prices in the Central Highlands fluctuated in the range of 96,000-96,800 VND/kg, averaging 96,600 VND/kg.
In Dak Lak, coffee prices are purchased at 96,500 VND/kg. Gia Lai also recorded a level of 96,500 VND/kg.
In Lam Dong, coffee prices are at 96,000 VND/kg, the lowest among the surveyed areas.
The old Dak Nong area, now belonging to Lam Dong province, continues to have the highest price, reaching 96,800 VND/kg.
World coffee prices
In the world market, coffee prices fluctuated in opposite directions in the latest update session.
On the London exchange, the September 2026 Robusta futures contract increased by 7 USD/ton, equivalent to 0.19%, to 3,780 USD/ton. The November 2026 futures contract increased by 12 USD/ton, equivalent to 0.32%, to 3.761 USD/ton.
Conversely, on the New York exchange, Arabica September 2026 futures fell 2.75 US cents/lb, equivalent to 0.84%, to 323.05 US cents/lb. December 2026 futures fell 0.85 US cents/lb, to 307.70 US cents/lb.
This development shows that the world market has not signaled consensus. Robusta has a slight recovery, but Arabica is still under adjustment pressure.
Coffee price assessment
Domestic coffee prices are currently maintained around 96,000 – 96,880 VND/kg after a sharp decrease. The slight increase in Robusta London is not enough to create a clear pulling force for domestic purchasing prices.
For Vietnam, Robusta is still a factor that needs to be closely monitored due to its more direct impact on domestic coffee prices. However, when Arabica New York is still decreasing and domestic prices have not yet regained the 98,000-9,900 VND/kg range, the market is still leaning towards a cautious state.
Regarding the weather, according to the National Center for Hydro-Meteorological Forecasting, on the day and night of July 31, the Central Highlands area will have showers and thunderstorms in some places; in the afternoon and night there will be scattered showers and thunderstorms, locally heavy rain. Lowest temperature 20-23 degrees C, in some places below 20 degrees C; highest temperature 28-31 degrees C.
Rainstorms in this season need to be monitored in terms of garden care, pest and disease prevention, and goods preservation.
The US dollar plunged against the Japanese yen, with no real news other than the Bank of Japan clearly intervened.
That being said, this presents a buying opportunity. The 200-day EMA has held as support. We plunged all the way back down to the 158 yen level.
I’m perfectly comfortable adding to this position.
This will be about the 3rd or 4th time they’ve intervened. Really all they can do is slowly try to put the brakes on the destruction of the yen.
Unfortunately for the Bank of Japan, they will have very limited ways to get this trend to change. Really the only way they could do it is if they hiked rates aggressively, but that would destroy the Japanese economy. So, this is a sign of desperation I’m more than willing to take advantage of. Keep your leverage reasonable, and it’s something that you can do.

I have taken a hit today, but most of my positions go back months, and they’re not huge. Cumulatively they are big, but in general, this is a market that I believe continues to go higher. I think the USD/JPY pair hits the highs again. We’ve already played this movie a couple of times in the past. It will be a grind to the upside. It won’t necessarily be easy; this does tend to spook traders, it has a certain effect, but the trend will not change just based on one action from the Bank of Japan.
The interest rate differential alone continues to get you paid, and it’s interesting because we’ve seen rates in America all over the place, but they are so much higher than Japan that the break-even point is much wider than it is with other currencies. I like this pair, I still buy it, this offers value that I can take advantage of.
Want to trade our USD/JPY forex analysis and predictions? Here’s a list of forex brokers in Japan to check out.
Christopher Lewis is a technical analyst and market commentator at DailyForex with more than two decades of trading experience in Forex and other leveraged markets. Based in Columbus, Ohio, he specializes in chart-based analysis of major currency pairs, stock indices, commodities, and energy markets, focusing on clear support and resistance levels, trend structure, and risk management. Christopher produces daily written and video analysis for traders who rely on technical setups to navigate volatile market conditions
As seen on: Pairs Of Aces Podcast,The Trader Guy, FXEmpire

")