The main tag of Gold News Today Articles.
You can use the search box below to find what you need.
[wd_asp id=1]
1
08, 2026
The main tag of Gold News Today Articles.
You can use the search box below to find what you need.
[wd_asp id=1]
Domestic coffee prices today
Coffee prices today in the domestic market increased slightly compared to the previous day. Coffee prices on August 1st averaged 96,800 VND/kg, up 200 VND/kg.
The highest price in key regions of the Central Highlands was recorded at 97,000 VND/kg. This is a higher price range than the session on July 30, but it has not yet regained the close of 99,000 VND/kg recorded last week.
With an increase of 200 VND/kg, domestic coffee prices are showing a slight recovery after a sharp decrease in the previous session. The increase range is not large, showing that the domestic market is still cautious even though world prices have recovered.
World coffee prices
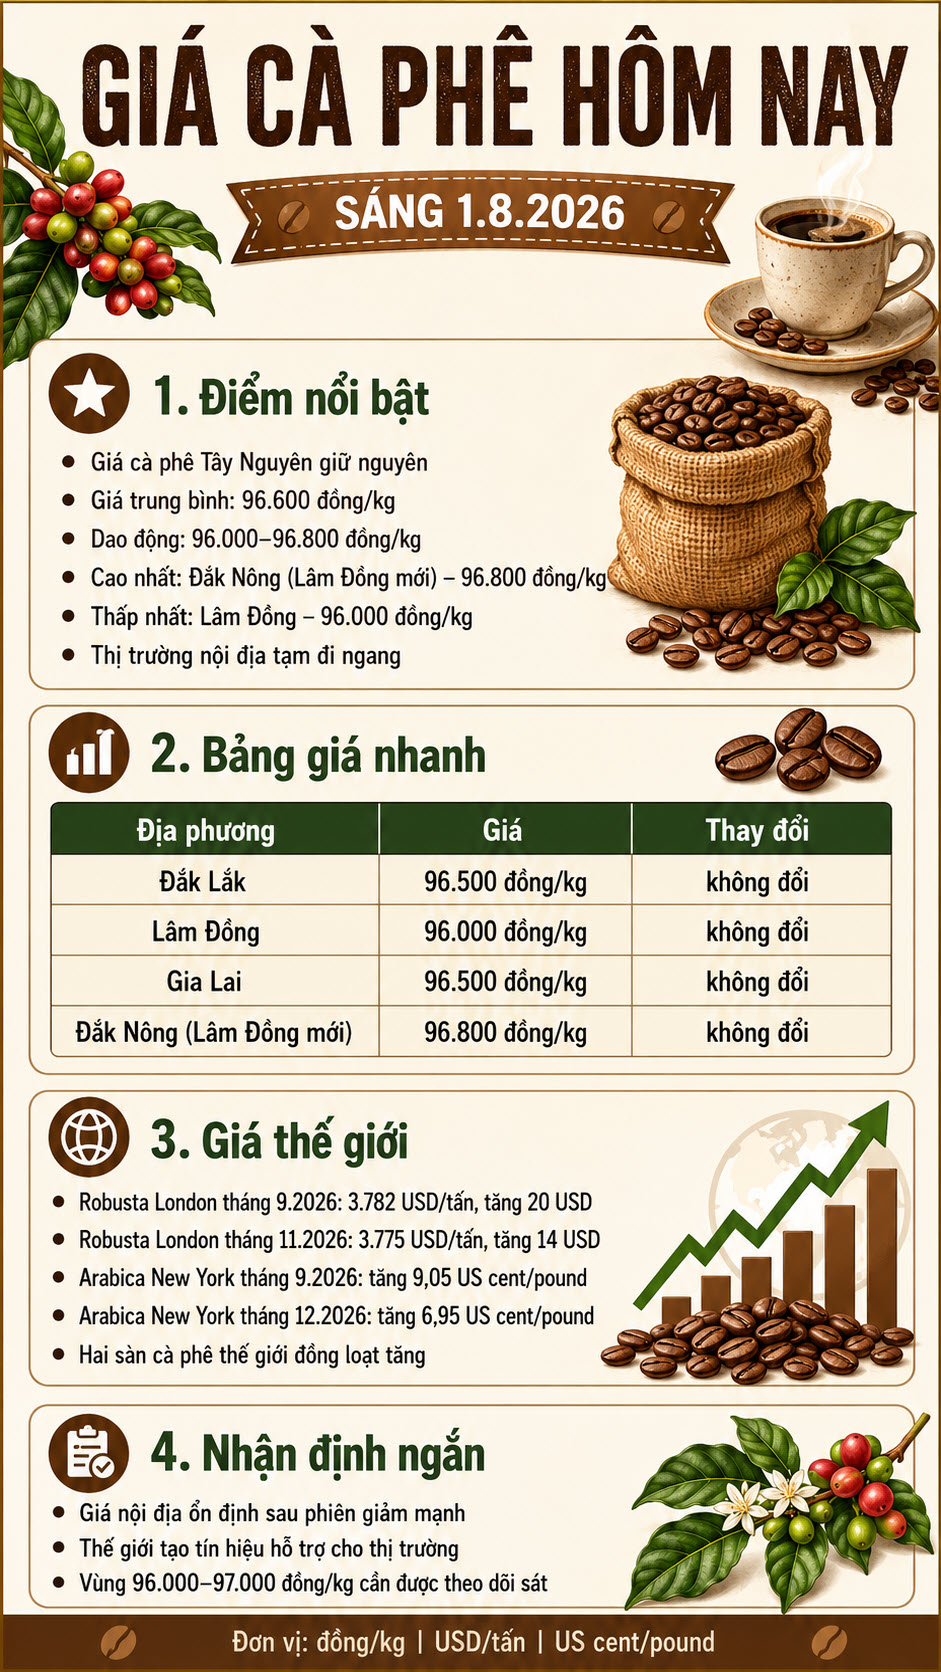
In the world market, coffee prices increased in the most recent session. According to data from Barchart, the September 2026 Arabica contract closed the session up 9.05 US cents/lb, equivalent to 2.80%, to 332.10 US cents/lb.
Robusta also increased but the amplitude was much narrower. Robusta futures contract for September 2026 closed the session up 2 USD/ton, equivalent to 0.05%, to 3,782 USD/ton.
This development shows that the upward momentum of the world market is more concentrated in Arabica, while Robusta is almost flat. Therefore, the supporting effect on domestic coffee prices is not yet too strong.
Coffee price assessment
Domestic coffee prices increased slightly in the context of the world market recovery. However, the increase of 200 VND/kg is not enough to create a breakthrough signal, especially when Robusta London only increased very slightly in the most recent session.
Arabica increased sharply in the last session of July as short-term supply tightened, Arabica stocks certified on ICE continuously decreased for 4.5 months and fell to a 2.5-year low. This is a factor that supports the Arabica group more clearly than Robusta.
For the Vietnamese market, Robusta is still a variable that needs to be closely monitored due to its direct impact on domestic purchasing prices. If Robusta only narrowly fluctuates around the 3,700-3,800 USD/ton range, domestic prices may continue to increase slowly or move sideways instead of rebounding strongly.
Regarding the weather, the National Center for Hydro-Meteorological Forecasting said that on the day and night of August 1st, the Central Highlands area will be sunny during the day, with showers and thunderstorms in some places in the late afternoon and night; the lowest temperature is 20-23 degrees C, in some places below 20 degrees C, the highest is 28-31 degrees C.
Rainstorms in this season need to be monitored in terms of garden care, pest and disease prevention, and goods preservation.
Coffee prices in the Central Highlands region today, August 1st, 2026, remained unchanged compared to the previous day, fluctuating between 96,000 and 96,800 VND/kg. While the domestic market remained relatively stable, Robusta London and Arabica New York prices closed the week in positive territory.

According to the updated price list, the average coffee price in key production areas remains at 96,600 VND/kg. The highest purchase price continues to be recorded in Dak Nong (formerly Lam Dong ), at 96,800 VND/kg.
In Dak Lak , coffee is being purchased at 96,500 VND/kg. Gia Lai also maintains the same price.
Lam Dong continues to have the lowest price, at 96,000 VND/kg. Dak Nong (new Lam Dong) tops the list with 96,800 VND/kg.
| Market | Purchase price | Change |
|---|---|---|
| Dak Lak | 96,500 VND/kg | Unchanged |
| Lam Dong | 96,000 VND/kg | Unchanged |
| Gia Lai | 96,500 VND/kg | Unchanged |
| Dak Nong (formerly Lam Dong) | 96,800 VND/kg | Unchanged |
| Medium | 96,600 VND/kg | Unchanged |
The difference between the highest and lowest prices is currently 800 VND/kg. The purchasing prices across different raw material regions remain relatively close, indicating that the market has not yet shown significant differentiation.
The fact that coffee prices remained unchanged on the morning of August 1, 2026, followed a sharp correction on July 31, 2026, when the average price fell by 1,800 VND/kg to 96,600 VND/kg.
Following the rapid decline, both buyers and those with remaining stock tend to be more cautious. Dealers are not in a hurry to raise purchase prices, while growers continue to observe the global market before deciding to sell.
Prices above 96,000 VND/kg are still relatively high, but they are quite far from the psychological target of 100,000 VND/kg that had been expected in previous sessions.
On the London exchange, Robusta coffee prices closed in positive territory across key contract periods.
The September 2026 contract reached approximately $3,782 per ton, up $20. The November 2026 contract stood at $3,775 per ton, up $14.
Forward contracts also rose slightly. The January 2027 contract reached $3,744 per ton, while the March 2027 contract was at $3,715 per ton.
| Robusta contract | Closing price | Change |
| September 2026 | 3,782 USD/ton | +20 USD |
| November 2026 | 3,775 USD/ton | +14 USD |
| January 2027 | 3,744 USD/ton | +16 USD |
| March 2027 | 3,715 USD/ton | +17 USD |
While the increase in Robusta prices hasn’t been significant, it’s a positive sign for Vietnamese market sentiment, as this type of coffee plays a dominant role in domestic production and export.
Arabica coffee prices on the New York exchange also rose across the main contract periods.
The September 2026 contract rose approximately 9.05 US cents per pound, or 2.8%. The December 2026 contract increased by 6.95 US cents per pound, or 2.26%.
The March 2027 and May 2027 contracts both rose by approximately 5.70 US cents per pound.
The simultaneous increase in both Robusta and Arabica prices indicates that buying pressure has returned to the futures market. However, this increase occurred in just one session and is not yet sufficient to confirm a long-term recovery trend.
Domestic coffee prices are often influenced by Robusta London prices, but this doesn’t always happen immediately. Purchase prices also depend on delivery demand, the amount of coffee held by farmers, bean quality, transportation costs, and the level of competition among dealers.
In addition, the domestic market has just experienced a sharp decline, so purchasing units tend to wait for further signals before adjusting prices.
If Robusta London maintains its upward momentum in the following sessions, coffee prices in the Central Highlands may receive further support. Conversely, if world prices reverse, the domestic market is likely to continue fluctuating around the current level.
In the short term, the 96,000–97,000 VND/kg range remains a key area to monitor. The fact that the price has held above 96,000 VND/kg indicates that there is no selling pressure yet.
For a clearer recovery to form, domestic coffee prices need further support from Robusta London, and buying activity in producing regions must improve.
Growers with remaining stock should monitor developments over several consecutive trading sessions, financial needs, and actual purchase prices at each dealer. Listed prices may vary depending on coffee quality, delivery location, and payment method.
Thus, coffee prices today, August 1, 2026, remain unchanged in all surveyed localities. Dak Nong (new Lam Dong) continues to have the highest price at 96,800 VND/kg, while Lam Dong has the lowest at 96,000 VND/kg. On the world market, Robusta London and Arabica New York both increased.
Source: https://baovanhoa.vn/kinh-te/gia-ca-phe-hom-nay-182026-noi-dia-di-ngang-the-gioi-tang-252554.html
Silver extended its decline on Thursday, falling more than 3% to around $57.22 an ounce and trading close to the bottom of the day’s range.
The metal has now lost around 17% since the start of 2026, having fallen sharply from its January peak above $120.
UBS nevertheless expects the market to recover over the coming quarters.
The bank’s latest global forecasts put silver at $65 by September 2026, rising to $70 in December, $75 by March 2027 and remaining at that level in June 2027.
That implies upside of more than 30% from current levels, although the forecast path points to a gradual recovery rather than an immediate return to this year’s highs.

Silver fell steadily through Thursday’s session, with XAG/USD finishing close to its intraday low.
The outlook broadly tracks UBS’s bullish forecast for gold, although silver’s larger industrial component leaves it more sensitive to the global growth outlook.
Weak manufacturing demand, tighter financial conditions and a firmer Dollar can all weigh more heavily on silver than on gold, particularly during periods of risk aversion.
The latest price action remains fragile. XAG/USD is trading below both its 20-day and 50-day moving averages, while Thursday’s decline pushed the metal back towards the lower end of its recent range.
UBS’s forecasts suggest the bank sees current weakness as temporary rather than the start of a deeper structural decline.
Its projected rise to $65 by September would mark the first stage of the recovery, with further gains expected as precious-metals demand improves and the drag from US interest-rate expectations begins to fade.

Silver remains down 17.1% in 2026 and well below its January high, although UBS expects prices to recover over the next year.
The immediate technical picture remains weak, but UBS’s $75 forecast indicates that the bank still expects silver to regain ground once monetary and investment conditions become more supportive.
Our currency coverage draws on live market data, official economic releases and published bank research.
Domestic coffee prices today
Coffee prices today in the domestic market have not recorded a clear recovery after the previous sharp decrease session. According to updated data on the morning of July 31, coffee prices in the Central Highlands fluctuated in the range of 96,000-96,800 VND/kg, averaging 96,600 VND/kg.
In Dak Lak, coffee prices are purchased at 96,500 VND/kg. Gia Lai also recorded a level of 96,500 VND/kg.
In Lam Dong, coffee prices are at 96,000 VND/kg, the lowest among the surveyed areas.
The old Dak Nong area, now belonging to Lam Dong province, continues to have the highest price, reaching 96,800 VND/kg.
World coffee prices
In the world market, coffee prices fluctuated in opposite directions in the latest update session.
On the London exchange, the September 2026 Robusta futures contract increased by 7 USD/ton, equivalent to 0.19%, to 3,780 USD/ton. The November 2026 futures contract increased by 12 USD/ton, equivalent to 0.32%, to 3.761 USD/ton.
Conversely, on the New York exchange, Arabica September 2026 futures fell 2.75 US cents/lb, equivalent to 0.84%, to 323.05 US cents/lb. December 2026 futures fell 0.85 US cents/lb, to 307.70 US cents/lb.
This development shows that the world market has not signaled consensus. Robusta has a slight recovery, but Arabica is still under adjustment pressure.
Coffee price assessment
Domestic coffee prices are currently maintained around 96,000 – 96,880 VND/kg after a sharp decrease. The slight increase in Robusta London is not enough to create a clear pulling force for domestic purchasing prices.
For Vietnam, Robusta is still a factor that needs to be closely monitored due to its more direct impact on domestic coffee prices. However, when Arabica New York is still decreasing and domestic prices have not yet regained the 98,000-9,900 VND/kg range, the market is still leaning towards a cautious state.
Regarding the weather, according to the National Center for Hydro-Meteorological Forecasting, on the day and night of July 31, the Central Highlands area will have showers and thunderstorms in some places; in the afternoon and night there will be scattered showers and thunderstorms, locally heavy rain. Lowest temperature 20-23 degrees C, in some places below 20 degrees C; highest temperature 28-31 degrees C.
Rainstorms in this season need to be monitored in terms of garden care, pest and disease prevention, and goods preservation.
The EURUSD pair declined in its last intraday trading, to gather the gains of its previous rises, attempting to offload its clear overbought conditions on the relative strength indicators, especially with the emergence of negative signals from them, to gather its positive strength that might help it recover and rise again, amid the dominance of bullish corrective wave on the short-term basis, with the continuation of the positive support that comes from its trading above EMA50, reinforcing the chances of near term recovery.
The GBPJPY pair came under strong negative pressure during yesterday’s trading after touching the resistance barrier at 218.65, forcing the pair to launch a sharp bearish move and suffer significant losses, reaching 212.25, before rebounding to retest the broken support level, which has now turned into resistance at 216.35.
Repeated stability below 216.35 may force the pair to resume its bearish attempts, with the price expected to target 215.20 and 214.80, respectively. However, a break above 216.35 and sustained trading above it would temporarily delay the bearish scenario, allowing the pair to attempt a move toward 216.85 and 217.35, respectively.
The expected trading range for today is between 214.80 and 21650
Trend forecast: Bearish
Cup of coffee with coffee beans in burlap sack on coffee tree background by Amenic181 via Shutterstock
September arabica coffee (KCU26) today is down -0.40 (-0.12%), and September ICE robusta coffee (RMU26) is up +29 (+0.77%).
Coffee prices are mixed today. Arabica coffee is under pressure today on forecasts for mostly dry weather in Brazil’s coffee-growing regions over the next week, which should allow for the pace of the country’s coffee harvest to speed up.
On Tuesday, coffee prices rallied to 2-week highs amid concern that heavy rain in Brazil will further disrupt the country’s coffee harvest and tighten global supplies. On Monday, Somar Meteorologia reported that 32.4 mm of rain, or 2700% of the historical average, fell in the week ended July 26 in Minas Gerais, Brazil’s biggest coffee-growing region.
The slow pace of Brazil’s coffee harvest is supportive of coffee prices. The harvest among members of Cooxupe co-op was 58.3% complete as of July 24, behind the year-earlier pace of 67%. On July 17, Safras & Mercado reported that Brazil’s 2026/27 coffee harvest was 64% complete as of July 15, behind last year’s comparable level of 77% and the five-year average of 70%.
Rising inventories are weighing on robusta coffee as ICE robusta inventories climbed to a 4.25-month high of 4,254 lots last Wednesday, although inventories were mildly below that level at 4,133 lots today. By contrast, a bullish factor for arabica coffee prices was that ICE arabica coffee inventories fell to a 2.5-year low of 274,168 bags on Wednesday.
Last Friday, coffee prices tumbled to 3-week lows due to the USDA’s forecast last Wednesday that global coffee output in the 2026-27 season will rise by +6.0% (10.8 million bags) to a record 189.7 million bags, mainly due to improved growing conditions in Brazil. The USDA expects global arabica production to rise +12% y/y, although robusta production is expected to fall by -0.7% y/y. World ending stocks are expected to rise +1.9 million bags to 26.3 million bags. On June 3, the USDA’s Foreign Agricultural Service (FAS) forecast a record 2026/27 Brazil coffee crop of 71.9 million bags, up +14% y/y.
Concerns that an El Niño weather pattern could hurt Brazil’s coffee crop next year are bullish for prices. Coffee trader Commercial said the El Niño weather pattern may delay rains in Brazil this September and October, when tree flowering normally occurs, hurting Brazil’s 2026/27 coffee crop. On July 8, the US Climate Prediction Center said the El Niño weather pattern that emerged across the equatorial Pacific last month will likely be one of the strongest in more than 75 years. This sets the stage for months of possible floods, droughts, and temperature fluctuations later this year that could hinder coffee production in Asia and South America.
Soaring coffee exports from Vietnam, the world’s largest robusta producer, are bearish for robusta prices. On July 3, Vietnam’s National Statistics Office reported that Vietnam’s 2026 coffee exports (Jan-Jun) rose by +7.3% y/y to 1.05 MMT. Vietnam’s 2025 coffee exports jumped by +17.5% y/y to 1.58 MMT. Also, Vietnam’s 2025/26 coffee production is projected to climb +6% y/y to a 4-year high of 1.76 MMT (29.4 million bags).
On the date of publication, Rich Asplund did not have (either directly or indirectly) positions in any of the securities mentioned in this article. All information and data in this article is solely for informational purposes. For more information please view the Barchart Disclosure Policy here.
Silver price (XAG/USD) gives back its early gains and turns negative on Thursday. The white metal trades 0.7% lower at around $57.25 in the European trade after a positive start, which led to hitting an intraday high at $58.65.
Surging US Treasury Yields on expectations that the Federal Reserve (Fed) would need to hike interest rates in the near-term have diminished the appeal of non-yielding assets, such as Silver.
“Yields are a byproduct of the rate expectations, and if the market expects that inflation fears will translate into higher rates, yields will be higher,” and this is pressuring gold, ANZ analyst Soni Kumari said. The remarks from the bank were especially for Gold; however, historically, Silver reacts in a similar fashion to Gold against bond yields.
At press time, 10-year US Treasury Yields trade 1.8% higher, close to their 18-month high of around 4.71%. A decent recovery in the US Dollar Index (DXY) to near 101.00 after a weak Wednesday is also hurting the Silver price. Technically, a higher US Dollar makes the Silver price an unfavorable risk-reward bet for investors.
The table below shows the percentage change of US Dollar (USD) against listed major currencies today. US Dollar was the strongest against the Swiss Franc.
| USD | EUR | GBP | JPY | CAD | AUD | NZD | CHF | |
|---|---|---|---|---|---|---|---|---|
| USD | 0.27% | 0.22% | 0.18% | 0.11% | 0.04% | -0.19% | 0.43% | |
| EUR | -0.27% | -0.07% | -0.07% | -0.16% | -0.25% | -0.48% | 0.16% | |
| GBP | -0.22% | 0.07% | 0.00% | -0.10% | -0.18% | -0.40% | 0.25% | |
| JPY | -0.18% | 0.07% | 0.00% | -0.08% | -0.14% | -0.39% | 0.27% | |
| CAD | -0.11% | 0.16% | 0.10% | 0.08% | -0.07% | -0.31% | 0.34% | |
| AUD | -0.04% | 0.25% | 0.18% | 0.14% | 0.07% | -0.21% | 0.44% | |
| NZD | 0.19% | 0.48% | 0.40% | 0.39% | 0.31% | 0.21% | 0.68% | |
| CHF | -0.43% | -0.16% | -0.25% | -0.27% | -0.34% | -0.44% | -0.68% |
The heat map shows percentage changes of major currencies against each other. The base currency is picked from the left column, while the quote currency is picked from the top row. For example, if you pick the US Dollar from the left column and move along the horizontal line to the Japanese Yen, the percentage change displayed in the box will represent USD (base)/JPY (quote).
According to the CME FedWatch tool, there is an almost 75% chance that the Fed will deliver at least one interest rate hike by the October meeting.
The Silver price opened higher as the US Dollar fell sharply after the Fed’s monetary policy announcement on Wednesday, in which it decided to leave interest rates unchanged in the range of 3.50%-3.75%. Fed’s monetary policy statement and Chairman Kevin Warsh’s press conference signaled that policymakers are highly concerned about inflation remaining well-above the central bank’s 2% target for a longer period.
Silver is a precious metal highly traded among investors. It has been historically used as a store of value and a medium of exchange. Although less popular than Gold, traders may turn to Silver to diversify their investment portfolio, for its intrinsic value or as a potential hedge during high-inflation periods. Investors can buy physical Silver, in coins or in bars, or trade it through vehicles such as Exchange Traded Funds, which track its price on international markets.
Silver prices can move due to a wide range of factors. Geopolitical instability or fears of a deep recession can make Silver price escalate due to its safe-haven status, although to a lesser extent than Gold’s. As a yieldless asset, Silver tends to rise with lower interest rates. Its moves also depend on how the US Dollar (USD) behaves as the asset is priced in dollars (XAG/USD). A strong Dollar tends to keep the price of Silver at bay, whereas a weaker Dollar is likely to propel prices up. Other factors such as investment demand, mining supply – Silver is much more abundant than Gold – and recycling rates can also affect prices.
Silver is widely used in industry, particularly in sectors such as electronics or solar energy, as it has one of the highest electric conductivity of all metals – more than Copper and Gold. A surge in demand can increase prices, while a decline tends to lower them. Dynamics in the US, Chinese and Indian economies can also contribute to price swings: for the US and particularly China, their big industrial sectors use Silver in various processes; in India, consumers’ demand for the precious metal for jewellery also plays a key role in setting prices.
Silver prices tend to follow Gold’s moves. When Gold prices rise, Silver typically follows suit, as their status as safe-haven assets is similar. The Gold/Silver ratio, which shows the number of ounces of Silver needed to equal the value of one ounce of Gold, may help to determine the relative valuation between both metals. Some investors may consider a high ratio as an indicator that Silver is undervalued, or Gold is overvalued. On the contrary, a low ratio might suggest that Gold is undervalued relative to Silver.


