The main category of The Gold News.
You can use the search box below to find what you need.
[wd_asp id=1]
The main category of The Gold News.
You can use the search box below to find what you need.
[wd_asp id=1]
COSTA MESA, Calif., March 27, 2024 /CNW/ – Gold Flora Corporation, (“Gold Flora” or the “Company”) (NEO: GRAM), a leading vertically-integrated single-state cannabis company today announced it has amended its previously announced filing date for the Company’s financial results for the fourth quarter and full year ended December 31, 2023, to Monday, April 1, 2024. The change was made to accommodate additional time required to complete the year-end audit and review process, related to the Company’s merger with TPCO Holding Corp. In connection with the amended filing date, the Company will reschedule its conference call to discuss its’ results to April 2nd, 2024, at 6:00 p.m. Eastern Time.
|
CONFERENCE CALL DETAILS |
|
|
DATE: |
Tuesday, April 2nd, 2024 |
|
TIME: |
6:00 p.m. Eastern Time |
|
WEBCAST: |
|
|
DIAL-IN NUMBER: |
1 (416) 764-8609 or 1 (888) 390-0605 |
|
CONFERENCE ID: |
23952500 |
|
REPLAY: |
1 (416) 764-8677 or 1 (888) 390-0541 Replay Code: 952500 # |
For more information on Gold Flora Corporation, visit: ir.goldflora.com
About Gold Flora Corporation
Gold Flora Corporation is a female-led, vertically-integrated cannabis leader that owns and operates a robust portfolio of 10 cannabis brands, which are sold through its 16 retail dispensaries and, through its Stately Distribution business, to retailers throughout California. Its retail operations include Airfield Supply Company, Caliva, Coastal, Calma, King’s Crew, Varda, Deli, and Higher Level.
Gold Flora Corporation operates an indoor cultivation canopy of approximately 99,000 square feet across three facilities in its Desert Hot Springs campus and two San Jose cultivation facilities. The Company can expand further adding approximately 240,000 square feet of canopy on already entitled additional acreage. Importantly this opportunity is unique and can be timed to meet market demand. The Desert Hot Springs campus also houses the Company’s manufacturing and extraction facilities, as well as Stately Distribution. The centralized location provides optimal security and logistic benefits and protects the product as it moves though the Company’s overall pipeline.
With hubs throughout the state, the Company distributes many prominent brands, including its own premium lines of Gold Flora, Cruisers, CURRENT, Roll Bleezy, Sword & Stoned, Aviation Cannabis, Jetfuel Cannabis, Caliva, Mirayo by Santana, and Monogram. Third party brands are increasingly contacting the Company in search of reliable input sources and established distribution.
References to information included on, or accessible through, websites and social media platforms do not constitute incorporation herein by reference of the information contained at or available through such websites or social media platforms, and the reader should not consider such information to be part of this press release.
For the latest news, activities, and media coverage, please visit www.goldflora.com.
SOURCE Gold Flora Corporation

View original content to download multimedia: http://www.newswire.ca/en/releases/archive/March2024/27/c0851.html
Canada’s main stock market, the Toronto Stock Exchange, on Wednesday managed to right itself after two days of losses, closing the day up 195 points and back above the 22,100 level on broad based buying, but with two gold stocks shining.
Whether or not the TSX can keep this run going in to the market holiday on Friday may depend on tomorrow’s Real GDP by industry data. Desjardins in a preview from last Friday said it is expected to have advanced by 0.3% m/m in January, slightly less than Statistics Canada’s 0.4% flash estimate. Looking ahead to February, Desjardins is projecting a 0.2% advance in real GDP by industry led by goods-producing sectors.
Today, two stocks that helped lift the market here were Alamos Gold AGI — which gained near 7% in Toronto — after the company on Wednesday said it agreed to acquire Argonaut Gold ![]() AR — which jumped more than 30% — for shares worth US$325 million to add the recently opened Magino gold mine in Ontario while spinning out Argonaut’s other mines in the United States and Mexico. Alamos is offering 0.0185 of its shares and one share in the spin out company for each Argonaut share. Argonaut’s two largest shareholders, with a 40% stake, have agreed to tender their shares to the offer, while the board’s of both companies have endorsed the deal.
AR — which jumped more than 30% — for shares worth US$325 million to add the recently opened Magino gold mine in Ontario while spinning out Argonaut’s other mines in the United States and Mexico. Alamos is offering 0.0185 of its shares and one share in the spin out company for each Argonaut share. Argonaut’s two largest shareholders, with a 40% stake, have agreed to tender their shares to the offer, while the board’s of both companies have endorsed the deal.
Of commodity prices, gold hit record highs today, while the oil price slipped further. But there was broad based buying with most sectors on the TSX higher, led by Healthcare (+3.9%) and Base Metals (+3%). There were modest losses for Battery Metals and Information Technology.
On the subject of sectors, perhaps of interest to those who like to invest both in Canada and the United States, Scott Wren over at Wells Fargo Investment Institute published a market commentary entitled, “Why Industrials (and Materials)?” In citing his key takeaways, Wren noted the Industrials sector has some of the broadest economically tied global exposure of any of the S&P 500 Index sectors, and many industrial companies will see orders as the beneficiaries of government spending programs.
Wren said, “We currently carry favourable ratings on both the Industrials and Materials sectors. Our strategy has been to trim exposure to Information Technology, Communications Services, and Consumer Discretionary sectors as well believe they represent overvalued segments of the market. With those funds, we suggest investors bring Industrials and Materials, along with the Energy and Health Care sectors, up to our recommended portfolio allocations.”
But separately, and representing something of a warning for stock pickers, CIBC Capital Markets said “while history suggests that it is not a good idea to bet against a market flirting with new highs, it may be prudent for equity investors to consider adding some downside protection,” especially with the S&P up some 10% year-to-date, and some 30% over the last 12 months.
CIBC noted that contrary to the rates market which has priced out some 75bps of easing since the January FOMC, the equity markets seem undeterred by the Fed’s higher-for-longer narrative as the rally extends.
It said the reality is that the inflation trajectory still remains uncertain, with Fed Chair Powell’s largest concern being that inflation stabilizes above the 2% target level.
For equities, CIBC thinks the biggest risk centers around what the bond market is not priced for this year: the possibility of one or even no rate cuts (currently near 77bps of easing or three cuts are priced for 2024). It said: “While this is not our base case, there are a handful of avenues for inflation to re-accelerate again, causing the Fed to postpone the well-anticipated easing cycle for even longer. And as we shift into the latter half of the year, market attention will be diverted to the U.S. election which will add another layer of complexity.”
“At the same time,” CIBC added, “with the Fed leaving rates at restrictive levels for longer, recessionary risks also rise as monetary policy works with a lag. While our base case scenario is still a U.S. soft landing, downside surprises to growth remain a possibility given how aggressive the recent hiking cycle has been.”
Of commodities today, West Texas Intermediate (WTI) fell again after the Energy Information Administration said US oil inventories unexpectedly rose last week, but less than an private report released a day earlier reported. WTI crude oil for May delivery closed down $0.27 to settle at US$81.35 per barrel, while May Brent crude, the global benchmark, closed down $0.16 to US$86.09.
But gold closed at a record high, pushing back above US$2,200 even as the dollar strengthened, as buying momentum for the metal continues, backed by expectations lower interest rates are on the horizon. Gold for May delivery closed up $13.50 to settle at US$2,212.70 per ounce, topping the previous record of US$2,206.50 set on March 21.
Gold Prices Today: Gold prices extended gains on Wednesday, March 27, as investors awaited US inflation data that will throw further light on the US Federal Reserve’s policy path after the central bank kept interest rates unchanged for the fifth straight meeting this month.
According to commodity market experts, gold prices have retraced from recent highs due to the profit-booking. The yellow metal still possesses steam and may soon touch record-high levels soon as the US Fed rate cuts are expected to inject further momentum in prices. Rate cut means easy money, which means more inflation, and gold is seen as a hedge against inflation.
At 9:53 am EDT (1353 GMT), spot gold was up 0.6 per cent at $2,191.88 per ounce, while US gold futures rose 0.6 per cent to $2,190.50. The US Core Personal Consumption Expenditures Price Index (PCE) data for February is due on Friday. The PCE rose 0.3 per cent in January.
Alex Turro, senior market strategist at RJO Futures told news agency Reuters that he expects range-bound price action for the session as investors come into the sidelines ahead of the report. “We’ll have to see whether or not U.S. inflation here domestically is soft enough to provide this clear path to lower rates in the coming months,” said Turro.
Gold prices hit a record high last week after the US central bank’s policymakers indicated they still expect to reduce interest rates by three-quarters of a percentage point by end-2024, despite recent high inflation. The Fed’s rate-setting panel unanimously voted to leave the benchmark interest rates unchanged at 5.25 per cent – 5.50 per cent, in line with Street estimates.
Traders now see a 70 per cent chance of a June rate cut by the US Fed. Lower interest rates reduce the opportunity cost of holding bullion. Spot silver was up 0.6 per cent at $24.58 per ounce, platinum lost 0.6 per cent to $897.30 and palladium dropped 1.9 per cent to $974.31.
Also Read: Gold price jumps 6% this month. Should you buy as MCX gold rate dips ₹1,000 from record high?
Back home, the Multi Commodity Exchange (MCX) session, gold futures contracts set to expire on April 5, 2024, last traded 0.33 per cent higher at ₹66,320 per 10 grams. The session hit a day’s high of ₹66,499 per 10 grams so far against a previous close of ₹66,114 per 10 grams.
Jateen Trivedi, VP Research Analyst, LKP Securities said, “Gold prices in MCX were seen positive up by ₹250 at 66,350+ taking support from Comex Gold trading higher above 2192$ testing 2200$ resistance again and again everyday.”
‘’The participation in gold has increased after Fed’s policy and dovish statement which has triggered new buying momentum as broadly, gold takes support of 2,150$ and resistance of 2,200$ once prices start trading above 2,200$ escalations towards 2,250$ cannot be ruled out,” added Trivedi.
Disclaimer: The views and recommendations above are those of individual analysts, experts, and broking companies, not of Mint. We advise investors to check with certified experts before making any investment decisions.
Unlock a world of Benefits! From insightful newsletters to real-time stock tracking, breaking news and a personalized newsfeed – it’s all here, just a click away! Login Now!
In June of last year, Robinhood announced it was acquiring the credit card startup X1.
Today, we learned about the fruits of that transaction: a new Gold Card from Robinhood.
This new card is a premium credit card that costs $5 per month or $50 per year and is only available to Robinhood Gold members.
The card does come with a list of valuable benefits. The main attraction is 3% cash back on every transaction and there is also 5% cash back when booking travel through the Robinhood portal. The cashback can be transferred to brokerage accounts for stock purchases.
The big question, as Simon Taylor pointed out on X today, is can Robinhood make money with this card? He argues this looks more like a loss leader but Robinhood will use the card to cross-sell its other products.
Either way, Robinhood has firmly planted a stake in the ground in the premium card market. Right at the same time as the Visa-Mastercard settlement that could impact premium cards…
> Robinhood’s new credit card goes after Apple Card with ability to invest cash-back perks
By Mary Ann Azevedo
Eight months after acquiring credit card startup X1 for $95 million, Robinhood announced today the launch of its new Gold Card, with a list of features that could even give Apple Card users envy.
> Turning payments into a profitable revenue stream for vertical SaaS
By TX Zhuo
Payments are increasingly at the center of the rapidly expanding vertical SaaS market.
: Robinhood launches a fancy new gold credit card")
> Julie Szudarek, CEO of Self Financial on building credit
The CEO of Self Financial talks about the importance of building a good credit score, financial literacy and how a credit…
To sponsor our newsletters and reach 180,000 fintech enthusiasts with your message, contact us here.

The price of gold traded at $2,186.05 per troy ounce, as of 9 a.m. ET. That’s down 0.07% since yesterday’s gold price per ounce and up 5.79% from the beginning of the year.
The lowest trading price within the last 24 hours: $2,171.81 per ounce. The highest gold spot price in the last 24 hours: $2,197.65 per ounce.
XAU/USD is the label for finding the spot gold price traded in U.S. dollars. In this case, gold (XAU) is traded against the dollar, and the price represents the cost of one (troy) ounce of gold in USD. But there are other foreign exchange markets, such as XAU/EUR for trading in euros and XAU/GBP for trading in British pounds.
The spot gold price represents the price at which gold can be exchanged and delivered, and prices are typically quoted in gold price per troy ounce in U.S. dollars. But prices can also be quoted per gram and kilo. It’s worth noting that a troy ounce is slightly heavier than a standard ounce.
The chart below shows how the spot price of gold is trending over the year. The data is as of 9 a.m. ET and doesn’t display intraday highs or lows.
Year to date, gold is up 5.79% from the beginning of the year, as of 9 a.m. ET. The 52-week intraday high reached $2,222.14 on March 21, 2024, and the 52-week intraday low dropped to $1,810.47 on Oct. 6, 2023.
Remember that the spot price of gold is quoted in real time and represents the current price at which gold can be bought or sold for immediate delivery. For most investors, the spot price usually differs from the price they’ll pay or receive when they decide to purchase or sell their gold.
For example, buying physical gold involves overheads like storage costs and insurance.
When trading physical gold, the difference between the buying and selling price, known as the spread, can eat into returns. Dealers often incorporate their markups and transaction fees within these spreads, which means the actual price an investor pays might be higher than the current market rate, while the selling price they receive might be lower.
While gold certificates, gold exchange-traded funds and gold trusts offer more liquidity and are easier to manage than physical gold, they come with their own risks. These investment vehicles might only sometimes match the performance of the spot price of gold due to management fees and potential discrepancies in tracking.
In essence, while the spot price provides a general benchmark for the value of gold, the actual returns and costs an investor encounters differ based on the medium of purchase and the specifics of the investment.
Buying physical gold involves overheads like storage costs and insurance.
When trading physical gold, the difference between the buying and selling price, known as the spread, can eat into returns. Dealers often incorporate their markups and transaction fees within these spreads, which means the actual price an investor pays might be higher than the current market rate, while the selling price they receive might be lower.
While gold certificates, gold exchange-traded funds and gold trusts offer more liquidity and are easier to manage than physical gold, they come with their own risks. These investment vehicles might only sometimes match the performance of the spot price of gold due to management fees and potential discrepancies in tracking.
In essence, while the spot price provides a general benchmark for the value of gold, the actual returns and costs an investor encounters differ based on the medium of purchase and the specifics of the investment.
Precious metals have long served as investment vehicles and industrial commodities. Like gold, the spot prices of silver, platinum and palladium fluctuate based on various market, economic and geopolitical factors.
Silver possesses both monetary and industrial value. While it’s used as a hedge against economic volatility, it’s also crucial in the electronics, automotive and medical industries. Its dual-use nature can lead to different market dynamics compared to gold.
The price of silver opened at $24.46 per ounce, as of 9 a.m. ET. That’s down 1.09% since the previous day’s silver price per ounce and up 2.24% since the beginning of the year.
The lowest trading price within the last day: $24.33 per ounce. The highest silver spot price in the last 24 hours: $24.80 per ounce.
Platinum is another precious metal that commands attention. Rarer than gold and silver, its primary use is in automotive catalytic converters, which help reduce harmful emissions. Given the push for cleaner automotive technologies, the demand dynamics for platinum can vary, influencing its spot price.
The price of platinum opened at $892.30 per ounce, as of 9 a.m. ET. That’s down 1.71% since yesterday’s platinum price per ounce and down 9.66% year to date.
The lowest trading price within the last 24 hours: $890.64 per ounce. The highest platinum spot price in the last 24 hours: $908.87 per ounce.
Palladium, like platinum, is pivotal in the automotive industry for catalytic converters. In recent times, there has been a surge in palladium demand due to stricter emission standards worldwide. Its scarcity and rising industrial demand have led to significant price volatility.
The price of palladium is $970.47 per ounce, as of 9 a.m. ET. That’s down 4.23% since yesterday’s palladium price per ounce and down 11.74% year to date.
The lowest trading price within the last 24 hours: $969.06 per ounce. The highest palladium spot price in the last 24 hours: $1,008.49 per ounce.
Gold can be highly volatile and subject to strong short-term price fluctuations.
Whether it’s a good time to buy gold depends on various factors, including your investment goals, risk tolerance and time horizon, the broader economic outlook, and forecasts about the gold market.
Historically, many people view gold as a hedge against inflation and currency fluctuations. Others see it as a store of value during economic downturns. At the same time, some may find diversifying a portfolio of stocks and bonds useful, given its low correlation to both assets.
“If you look at gold’s performance historically, it’s the kind of asset that should perform well through uncertainty, as it has done in five out of the last seven recessions,” said Joseph Cavatoni, chief market strategist for North America at the World Gold Council. “For people looking for a store of value and a portfolio diversifier, gold has a strong track record of delivering those qualities.”
The highest price gold ever reached was $2,222.14 on March 21, 2024.
One notable recent high includes the yellow metal’s high of $1,971.17 per troy ounce in August 2020. This surge can be partially attributed to the economic uncertainty surrounding the COVID-19 pandemic.
The global outbreak of COVID-19 brought about unprecedented economic challenges. With central banks worldwide implementing low interest rate policies and massive fiscal stimulus packages to support their economies, there were concerns about potential inflation and the devaluation of fiat currencies. In this scenario, some investors turned to gold as a safe asset, given its history as a store of value during times of economic instability.
Geopolitical tensions, trade wars, and supply chain disruptions during this period further contributed to investors seeking refuge in assets deemed more stable, and gold has historically been a preferred choice for many. As a result, demand for gold increased, driving its price to a record high in August 2020.
Remember that while the COVID-19 pandemic’s economic repercussions significantly contributed to gold’s price rise in 2020, other factors likely also played a part.
(TheNewswire)
March 27, 2024 – TheNewsWire – Global Stocks News – On March 20, 2024 Fury Gold Mines (TSX:FURY) (NYSE American:FURY) announced that starting early April 2024, it will begin a 2,000 meter diamond core drilling program at its 100% owned Éléonore South gold project located in the Eeyou Istchee Territory in the James Bay region of Quebec.
Following the March 1, 2024 acquisition of Newmont’s 49.9% interest in the project for CND $3 million, Fury now has complete control of Éléonore South.
“The proximal Éléonore Mine has about 5 or 6-years of mine life remaining,” Tim Clark, CEO of Fury Gold told Guy Bennett, CEO of Global Stocks News (GSN). “They need to extend the mine life. In early April 2024 we are going to be drilling Éléonore South. If we get good grades on our property, there’s a potential further consolidation opportunity.”
“Historically, three companies owned Éléonore South,” Clark told GSN. “It was difficult to get anything done. The Fury geological team believe this is a prolific area for new discovery. Recent geochemical surveys confirm that we have interesting targets. And now, for the first time, we are free to drill the project, on our own timeline.”
Tim Clark is a capital markets’ veteran (Deutsche Bank, Merrill Lynch, BMO) who has a track record of making savvy acquisitions and raising institutional funds.
“Beyond access to capital, and the quality of our gold assets in Canada, our other differentiator is the experience of our management team,” stated Clark. “Fury has extremely disciplined spending habits. We allocate capital carefully and do deals that we believe will strengthen our position.”
Select Fury Gold milestones under Tim Clark’s tenure:
December 6, 2021: Sale of Homestake Ridge for $50 million
April 19, 2022: Completion of CND $11 Million Private Placement
August 3, 2022: Discovery of Multiple High-Grade Gold at Eau Claire
August 8, 2022: Fury and Newmont Take Control of Éléonore South
December 21, 2022: Fury Drills 13.5 Metres of 8.05 g/t Gold at Percival
February 22, 2023: Appointment of Brian Christie as Board Director
March 23, 2023: Closing of CND $8.75 Million Financing
September 5, 2023: Appointment of Isabelle Cadieux as Board Director
November 6, 2023: Fury Intercepts up to 279 g/t Gold over 1.5m at Percival Main
January 17, 2024: 31.77 g/t gold & 8.07g/t Tellurium over 3.5 Metres at Hinge Target
March 1, 2024: Consolidation of Éléonore South Gold Project
March 14, 2024: Sale of 5.45 million DV Silver shares to institutions
March 20, 2024: Drills to begin turning in April at Éléonore South

Click Image To View Full Size
“In the course of my career, I developed close personal relationships with many CEOs in the gold and precious metals space,” Clark told GSN. “I also have long standing relationships with hedge fund managers and institutional resource investors,” Clark continued. “Through these relationships Fury Gold has access to capital and deal flow.”
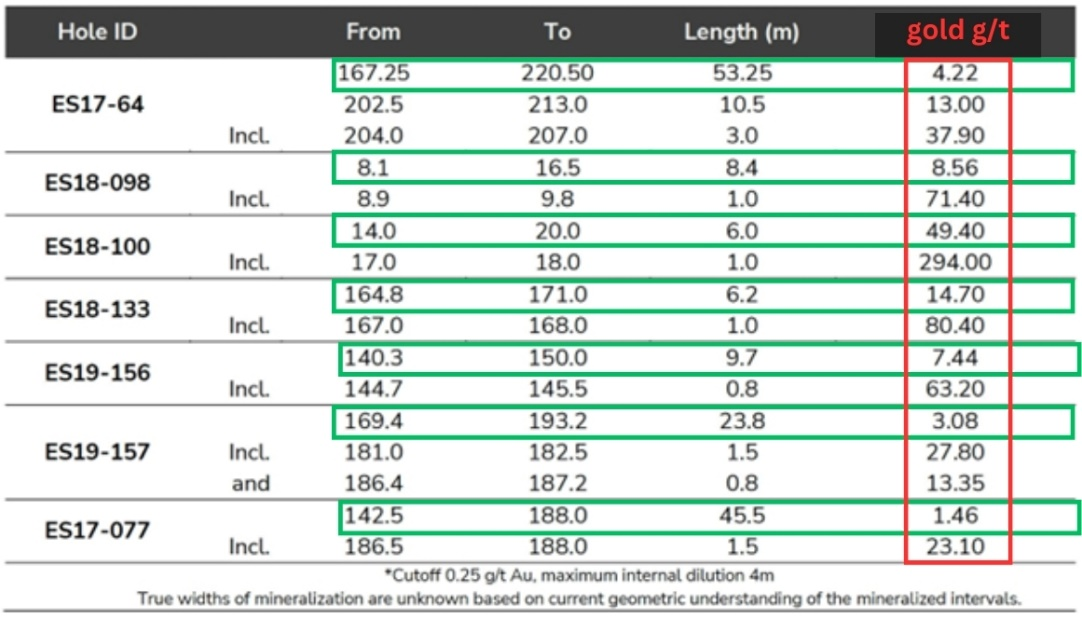
The fully funded drill program announced on March 20, 2024, will focus on the Moni trend where previous drilling intercepted up to; 53.25 m of 4.22 g/t gold (Au); 6.0 m of 49.50 g/t Au including 1.0 m of 294 g/t Au and 23.8 m of 3.08 g/t Au including 1.5 m of 27.80 g/t Au, several of which remain open.
Click Image To View Full Size
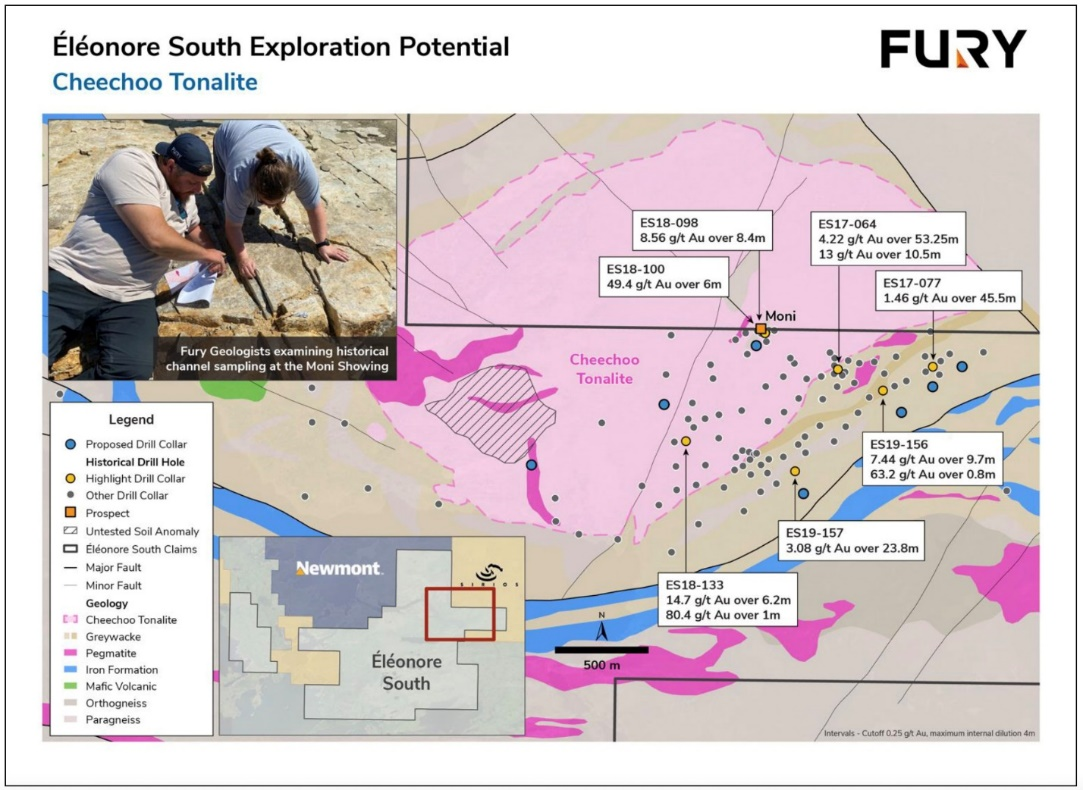
“This area, given its strategic significance near the border to Sirios’ Cheechoo deposit, proximity to the operating Éléonore Mine, and historical high-grade gold drill intercepts, represents a tremendous amount of potential upside to investors,” stated Tim Clark, CEO of Fury. “Going forward, we will also be exploring other priority targets across the whole 100% owned Éléonore South property which will include a follow-up biogeochemical survey of the Éléonore Mine style gold anomaly that we recently identified at the project.”
Previous drilling at Éléonore South, 38,037 m in 164 drill holes, was largely focussed in the Moni area and successfully defined a 2,000 m x 750 m zone of lower-grade intrusion related gold mineralization similar to that of the Cheechoo gold deposit.
Within the lower-grade gold halo, there are a series of structurally controlled quartz vein stockworks which host significantly higher grades of gold. Fury’s Spring 2024 drilling campaign will focus on these structural corridors following up on previous drill intercepts of 53.25 m of 4.22 g/t Au; 6.0 m of 49.50 g/t Au and 23.8 m of 3.08 g/t Au.”
In late spring Fury will complete the biogeochemical grid where a robust geochemical gold anomaly within the same sedimentary rock package that hosts Newmont’s Éléonore Mine has been identified (see news release dated March 5, 2024).
Click Image To View Full Size
Figure 1: Drilling around the Cheechoo Tonalite showing previous drill intercept highlights (2017-2019).
“We’ve been given an excellent opportunity to get drilling at Éléonore South several months ahead of what we had initially envisioned. This will allow us the ability to confirm our recent targeting within the Cheechoo tonalite and test our ideas on the controls of the high-grade quartz vein hosted gold mineralization. Our teams will be mobilizing within the week,” stated Bryan Atkinson, P.Geol., SVP Exploration of Fury.
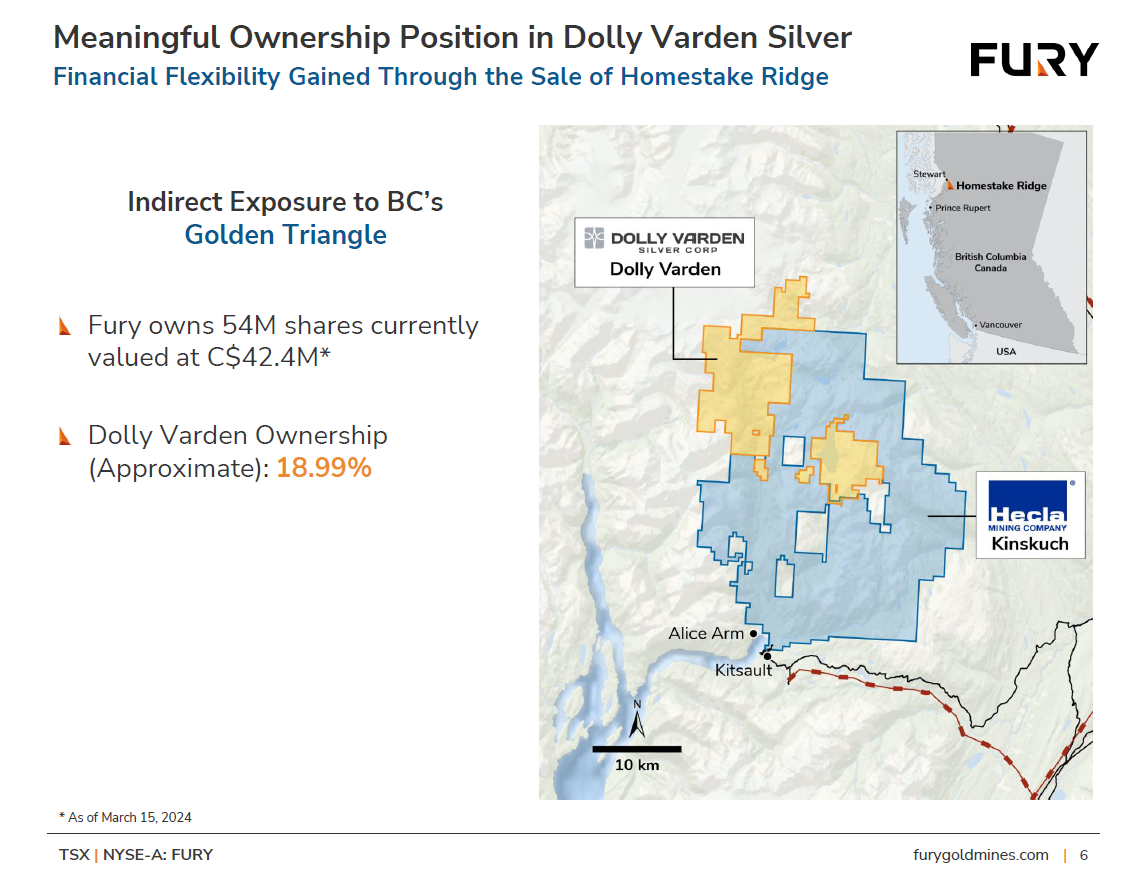
Fury also owns 54 million shares of Dolly Varden Silver, which has a market cap of CND $216 million.
DV Silver is developing its 100% held Kitsault Valley Project located in the Golden Triangle of British Columbia, Canada, 25 kilometers by road to tide water. It also has a new consolidated copper-gold porphyry project in the Golden Triangle, similar to other deposits in the region (Red Mountain, KSM, Red Chris).
On November 2, 2023 Dolly Varden Silver announced that it has closed a deal where Hecla Canada invested $10 million in DV Silver, raising its stake in DV Silver from 10.6% to 15.7%.
Hecla Mining has a market cap of USD $2.64 billion and trades on the New York Stock Exchange (NYSE). It produced 14.2 million ounces of silver in 2023.
“Hecla has demonstrated it is a sticky shareholder,” DV Silver CEO Shawn Khunkhun told GSN, “They’re looking to expand their North American silver portfolio.”
Click Image To View Full Size
“Fury Gold Mines is a best-in-class junior gold exploration company, focused on Canada, which has a favorable geopolitical climate,” Clark concluded. “Because of our Dolly Varden position, and relationships with institutional investors, we are in a strong position to finance current and future exploration and development programs.”
Contact: guy.bennett@globalstocksnews.com
Copyright (c) 2024 TheNewswire – All rights reserved.
The premature redemption price for Sovereign Gold Bond (SGB) 2016-17 Series II has been revealed by the Reserve Bank of India (RBI). The premature redemption will be done on March 30, 2024. The premature redemption rate for the same is Rs 6,601 per unit of sovereign gold bond (SGB).
The SGB redemption price is calculated on the simple average of the closing gold price of 999 purity of the previous three business days from the date of redemption as published by the India Bullion and Jewellers Association (IBJA). Therefore, the SGB redemption price is based on the simple average of the closing gold price for the week of March 18-22.
It is to be noted that though the tenor of the SGB is 8 years, early encashment/redemption of the bond is allowed after the fifth year from the date of issue on coupon payment dates. The bond are tradable on Exchanges, if held in demat form. It can also be transferred to any other eligible investor.
“Though the tenor of the bond is 8 years, early encashment/redemption of the bond is allowed after the fifth year from the date of issue on coupon payment dates,” said the RBI in a frequently asked question (FAQ) about SGB on its website.
An investor must apply for premature redemption within a specific annual deadline after 5 years of investment. Failure to tender the SGB to the RBI within this timeframe will result in the inability to redeem it in the same year.
How to prematurely withdraw SGBs
For premature redemption of SGBs, investors can approach the concerned bank/Stock Holding Corporation of India Limited (SHCIL) offices/post office/agent 30 days before the coupon payment date.
RBI has said requests for premature redemption can only be entertained if the investor approaches the concerned bank/post office at least one day before the coupon payment date. The proceeds will be credited to the customer’s bank account provided at the time of applying for the bond.
The proceeds are credited to the customer’s bank account provided at the time of applying for the bond.
There is a 10-day gap from the last date of premature redemption and the interest payment.
Tax on premature withdrawal
RBI says interest on the Bonds will be taxable as per the provisions of the Income-tax Act, 1961 (43 of 1961). The capital gains tax arising on redemption of SGB to an individual has been exempted. The indexation benefits will be provided to long terms capital gains arising to any person on transfer of bond.
TDS: TDS is not applicable on the bond. However, it is the responsibility of the bond holder to comply with the tax laws.
SGB vs GMS
The Centre introduced the first SGB in November 2015, and the initial two issues have matured, providing investors with high tax-free returns. The government had also floated the Gold Monetisation Scheme (GMS) ari=ound the same time, but it failed to gain traction.
So far, a total of 147 tonnes worth of SGBs have been sold, while the response to GMS is only 10 per cent of that. Both schemes aimed to reduce the import bill of gold, which has been exerting pressure on the rupee in the foreign exchange market.
On Tuesday, March 26th, U.S. stock markets closed in the red, marking the third straight day of losses for the Dow and S&P 500. Investors held back, awaiting economic data that could provide insights into the Federal Reserve’s policy trajectory during the abbreviated trading week.
According to economic data, U.S. durable goods orders rose by 1.4% in February, rebounding from a 6.9% drop in January. The S&P CoreLogic Case-Shiller 20-city home price index saw a 6.6% annual increase in January, up from a 6.2% rise the previous month.
Most S&P 500 sectors ended lower, particularly utilities, energy, and tech stocks, while healthcare and financial sectors resisted the downtrend, closing higher.
The Dow Jones Industrial Average declined 0.08% to close at 39,282.33. The S&P 500 was down 0.28%, ending the day at 5,203.58, while the Nasdaq Composite slid 0.42%, finishing the session at 16,315.70.
Asian Markets Today
Eurozone at 06:45 AM ET
Commodities at 06:45 AM ET
US Futures at 06:45 AM ET
Dow futures were up 0.42%, S&P 500 futures rose 0.40%, and Nasdaq 100 Futures gained 0.43%.
Forex at 06:45 AM ET
The U.S. Dollar Index gained 0.01% to 104.30, USD/JPY was down 0.28% to 151.12, and USD/AUD climbed 0.08% to 1.5317.
Photo by Pavel Bobrovskiy via Shutterstock
© 2024 Benzinga.com. Benzinga does not provide investment advice. All rights reserved.
KATHMANDU: The price of gold increased by Rs 400 per tola in the Nepali gold market today.
According to the Nepal Gold and Silver Dealers’ Association, the price of fine gold has been fixed at Rs 126,800 per tola and standard gold is traded at Rs 126,200 per tola.
The precious yellow metal was traded at Rs. 126,400 per tola, and standard gold at Rs. 125,800 per tola on Monday.
Similarly, the price of silver has been fixed at Rs 1,490 per tola today.
The Federation fixes the prices of gold and silver in the domestic market on a daily basis based on the price rates in the international market.
Gold prices opened on the Multi Commodity Exchange (MCX) on Wednesday at Rs 66,198 per 10 grams and hit an intraday low of Rs 66,077. In the international market, prices hovered around $2,177.27 per ounce.
Meanwhile, silver opened at Rs 74,487 per kg and hit an intraday low of Rs 74,359 on the MCX. In the international market, the price hovered around $24.45 per ounce.
Anuj Gupta, Chief of Commodity and Currency at HDFC Securities, said, “Yesterday, gold prices increased by 0.14% and closed at 66,114 levels. Recently, gold made a new high of 66,356 levels. Silver prices closed with a negative note, down by 0.54% and closed at 74,518 levels. Gold prices increased sharply due to geopolitical tension in the Middle East.”
Manav Modi, Analyst, Commodity and Currency, MOFSL, said, “Gold prices climbed, as expectations of interest rate cuts by the US Federal Reserve firmed, while investors waited for data due later in the week for underlying inflation trends that will help gauge the timing of these cuts.”
The dollar index is trading near its one-month high above the 104 mark. Similarly, US 10Y Yield is also hovering above the 4.2% mark, capping some gains for the metal price. On the data front, US Core durables goods orders data was reported better than expectations at 0.7% v/s 0.1%. However, US consumer confidence was slightly below estimates at 104.70 v/s 106.90.
“Gold prices also continue to find support from elevated physical demand from Chinese households, where gold’s record rally has not tarnished the buying appetite. Central bank purchases also sustain their support for gold, with China’s central bank steadily building its gold reserves. Updates regarding the recent development in the geo-political tensions, the tussle between Russia-Ukraine and Israel-Hamas is keeping market participants on edge. Gold tread water in anticipation of PCE price index data- the Fed’s preferred inflation gauge- due later this week. Focus this week will also be on the US GDP and comments from Governor Powell,” said Modi.
Jateen Trivedi, VP Research Analyst, LKP Securities, said, “Gold traded higher by 3:00 hour around 66,300 in MCX as Comex gold found support near 2170$ and rallied to 2195$ with backed up from the FED’s dovish statements the gold prices are broadly in positive trend but with resistance been seen at 2200-2205$ zones for the week. US GDP number son Thursday & Core PCE price index on Friday will be tracked keenly as they provided important impetus on FED’s watch tool.”
Additionally, Amit Khare, Associate Vice President at GCL Broking, said, “As per the daily chart Bullions are trading in the mix zone, Gold is looking strong while Silver is looking weak, Momentum Indicator RSI also indicating the same, below are the important levels for the day: Gold April Support 65,900/65,700 and Resistance 66,200/66,400. Silver May Support 74,000/73,500 and Resistance 75,000/75,500.”


