The main tag of cryptocurrency price today Articles.
You can use the search box below to find what you need.
[wd_asp id=1]
The main tag of cryptocurrency price today Articles.
You can use the search box below to find what you need.
[wd_asp id=1]
However, not all cryptocurrencies have benefited equally from the market’s resurgence. As it stands, Ethereum (CRYPTO: ETH) remains more than 20% off its all-time high, presenting a compelling opportunity for investors. Here’s why Ethereum is the cryptocurrency I’m buying with $1,000 today.

One of the most prominent uses for cryptocurrencies is decentralized finance, or DeFi. It’s a burgeoning sector worth over $95 billion today that aims to re-create traditional financial services — such as lending, borrowing, trading, and investing — in a decentralized manner.
Unlike traditional financial systems that rely on centralized institutions like banks or brokerages to facilitate transactions and manage assets, DeFi operates on blockchain networks like Ethereum and leverages smart contracts to automate processes and eliminate intermediaries.
While several blockchains make up the DeFi economy, Ethereum’s stranglehold on the market remains firm. Roughly 60% of the total value of DeFi calls Ethereum home. The next closest competitor is Tron, with a measly 10%.
There are likely several reasons that could explain Ethereum’s disproportionate value. Most apparent is that it was the first blockchain to offer smart-contract functionality, thereby being the only option for developers and users in DeFi’s early years.
Also, Ethereum has established a strong track record of reliability over the last decade. As a result, it has emerged as the go-to platform for developers looking to build new DeFi projects.
With the overwhelming majority of DeFi’s value tied to Ethereum, an opportunity arises. DeFi represents one of the most influential and disruptive uses for cryptocurrencies and will likely see its value increase with time. As such, Ethereum is the most straightforward way to gain exposure to DeFi’s burgeoning potential.
Without diving into the data, the chatter on discussion forums and across the internet would make it appear that competition in the DeFi space is greater than it actually is and that Ethereum’s dominance is threatened. While the field is more crowded than it was just a few years ago, these hopeful blockchains face an increasingly difficult task of trying to unseat Ethereum, especially when considering that it is growing more capable by the year.
No blockchain is perfect. Ethereum has known limitations in the form of speed and high transaction fees when network traffic is congested. But its core developers constantly look for ways to improve its performance.
Every year or so, Ethereum gets an update. In the same way your smartphone receives an operating system update, these upgrades introduce new functionality and optimization.
One of these just occurred and is a prime example of how future upgrades hold the potential to widen the gap separating Ethereum from its competitors and help it reach its goal of becoming powerful enough to benefit all of humanity.
Launched on March 13, the Dencun upgrade unveiled new features that made fees on Layer 2 blockchains built atop Ethereum much cheaper. Naturally, there has been an explosion in Layer 2 chains within the Ethereum ecosystem. It’s likely just a sign of things to come, and it seems that all roads will eventually lead back to Ethereum, no matter how many new blockchains claim to be a “competitor.”
With momentum across crypto continuing to build, and Ethereum’s price still well below its all-time high, a lucrative opportunity comes into focus. Its domination of DeFi, a fresh upgrade, and the cyclical pattern of cryptocurrencies surpassing previous all-time highs all make Ethereum a worthy investment at today’s prices.
Before you buy stock in Ethereum, consider this:
The Motley Fool Stock Advisor analyst team just identified what they believe are the 10 best stocks for investors to buy now… and Ethereum wasn’t one of them. The 10 stocks that made the cut could produce monster returns in the coming years.
Consider when Nvidia made this list on April 15, 2005… if you invested $1,000 at the time of our recommendation, you’d have $539,230!*
Stock Advisor provides investors with an easy-to-follow blueprint for success, including guidance on building a portfolio, regular updates from analysts, and two new stock picks each month. The Stock Advisor service has more than quadrupled the return of S&P 500 since 2002*.
*Stock Advisor returns as of April 4, 2024
RJ Fulton has positions in Ethereum. The Motley Fool has positions in and recommends Ethereum. The Motley Fool has a disclosure policy.
The Ultimate Cryptocurrency to Buy With $1,000 was originally published by The Motley Fool
Nonfarm payrolls surged 303k in March after increasing by 270k in February. The US unemployment rate fell from 3.9% to 3.8%. However, average hourly earnings rose by 4.1% year-on-year compared with 4.3% in February. Softer wage growth figures drove demand for riskier assets.
On Friday, the Nasdaq Composite Index gained 1.24%, supporting a BTC recovery from sub-$67,000.
On Friday, April 5, the BTC-spot ETF market saw total net inflows for the fourth session. According to Farside Investors, BTC-spot ETF market net inflows fall from $213.4 million (April 4) to $203.0 million (April 5). iShares Bitcoin Trust ensured the BTC-spot ETF market ended the week positively. Notable flow data for Friday, April 5, included,
The surge in IBIT net inflows coincided with news of prominent Wall Street names entering the BTC-spot ETF market fray.
According to an April 4 Form S-1 post-effective amendment, entities under Goldman Sachs (GS), Citigroup (C), UBS (UBS), Citadel (CTL), and ABN AMRO became authorized participants. A willingness to associate with the BTC-spot ETF market and BTC was another step in the evolution of the US crypto market.
According to our latest price prediction produced and curated by a team of experienced analysts, Ethereum Price is expected to move exponentially in 2024. The highest forecast for ETH in 2024 is $4,852.51 and the lowest at $4,054.59
It is anticipated that Ethereum price will be at an average price of $4,185.58 in 2024, setting the pace for higher levels in 2025.
| Month | Minimum Price | Average Price | Maximum Price | Potential ROI |
|---|---|---|---|---|
| April 2024 | $3,389.71 | $3,437.03 | $3,484.35 |
6.1% |
| May 2024 | $3,278.22 | $3,394.08 | $3,509.94 |
6.9% |
| June 2024 | $3,221.48 | $3,368.55 | $3,515.62 |
7.1% |
| July 2024 | $2,851.26 | $3,173.19 | $3,495.12 |
6.5% |
| August 2024 | $2,804.94 | $3,229.62 | $3,654.30 |
11.3% |
| September 2024 | $3,044.17 | $3,328.27 | $3,612.36 |
10% |
| October 2024 | $2,192.45 | $2,844.23 | $3,496 |
6.5% |
| November 2024 | $2,303.27 | $2,436.36 | $2,569.45 |
-21.7% |
| December 2024 | $2,297.32 | $2,426.22 | $2,555.11 |
-22.2% |
| All Time 2024 | $2,820.31 | $3,070.84 | $3,321.36 |
1.2% |
April being traditionally a month of unpredictability, the ETH coin might see a surge in volatility. The coin could dip to $3,389.71
in response but the potential upwing could climb to $3,484.35
if renewed recovery strikes at the end of the month.
Considering the historical trend of Ethereum price, the predicted price range for May suggests a minimum value of $3,278.22
, while strong market dynamics could elevate the price to $3,509.94
The start of summer could bring the heat to Ethereum prices, triggering some high momentum rally to $3,515.62
, but watch out for summer storms dragging the minimum to $3,221.48
In the heart of summer, Ethereum might experience a summer rally, with a maximum price reaching $3,495.12
. However, the occasional correction may plunge it to $2,851.26
If the bullish trend persists, Ethereum might ride the wave of optimism, seeing its value grow steadily. Minimum prices could plant themselves at $2,804.94
, with a chance for a spring rally pushing maximums to $3,654.30
The crypto market often sees renewed activity in autumn, and the ETH could benefit from this seasonal shift and prices aim for an autumn high of $3,612.36
, but could also correct to a low of $3,044.17
Historical trends and seasonal adjustments suggest a potential slowdown in trading activity, which might affect the ETH price. A conservative estimate suggests a price low of $2,192.45
, with the possibility of a surge to $3,496
if market sentiment remains bullish.
With the end of the year approaching, Ethereum could see varying investor sentiment. The market might position Ethereum between a minimum price of $2,303.27
and a maximum price of $2,569.45
Wrapping up the year, Ethereum ’s performance could be pivotal for its future trajectory. The forecast ranges from a cautious $2,297.32
to an optimistic $2,555.11
, reflecting both uncertainty and hope in the crypto space.
Drawing insights from historical Ethereum price data, CoinGape’s experienced team of analysts projects intriguing scenarios for 2025. Here’s what investors can consider:
| Month | Minimum Price | Average Price | Maximum Price | Potential ROI |
|---|---|---|---|---|
| January 2025 | $2,543.81 | $3,802.03 | $3,284.38 |
0.042% |
| February 2025 | $2,823.92 | $3,982.93 | $3,626.34 |
10.5% |
| March 2025 | $3,104.03 | $4,163.84 | $3,968.31 |
20.9% |
| April 2025 | $3,384.13 | $4,344.75 | $4,310.27 |
31.3% |
| May 2025 | $3,664.24 | $4,525.65 | $4,652.24 |
41.7% |
| June 2025 | $3,944.35 | $4,706.56 | $4,994.21 |
52.1% |
| July 2025 | $4,224.46 | $4,887.47 | $5,336.17 |
62.5% |
| August 2025 | $4,504.57 | $5,068.37 | $5,678.14 |
73% |
| September 2025 | $4,784.68 | $5,249.28 | $6,020.10 |
83.4% |
| October 2025 | $5,064.78 | $5,430.19 | $6,362.07 |
93.8% |
| November 2025 | $5,344.89 | $5,611.09 | $6,704.03 |
104.2% |
| December 2025 | $5,625 | $5,792 | $7,046 |
114.6% |
| All Time 2025 | $4,084.40 | $4,797.01 | $5,165.19 |
57.3% |
Ethereum might ride the wave of New Year resolutions and fresh starts. Expect prices to potentially swing from a hopeful beginning at $2,478.50
to an optimistic peak of $3,266.93
Ethereum could see its price flutter amid Valentine’s month, ranging from a low of $2,764.54
to a passionate high of $3,610.48
, reflecting the season’s emotional swings.
As the snow melts, There could be a thaw in investor hesitancy, leading to a gentle upswing. Prices may bloom from some well-established swing low of $3,050.59
to a flourishing top of $3,954.04
April could sprinkle Ethereum with a mix of dips and peaks. Prices might shower down to $3,336.63
but rebound to $4,297.59
, preparing for a vibrant season ahead.
With the full bloom of spring, the Ethereum price could mirror the growth and vibrancy of the season. A minimum of $3,622.68
could represent the seeding of investments, with a maximum of $4,641.14
if market optimism sustains.
The start of summer might bring calm stability to the ETH price, with a steady floor of $3,908.73
and a sunny ceiling of $4,984.69
With a history of notable price swings, the Ethereum coin sees a rise to $5,328.24
mark in July but occasion pullback may plunge to a low of $4,194.77
As the summer concludes, Ethereum might see a heightened fluctuation. Relaxing from a lazy low $4,480.82
to an active $5,671.79
, the market could reflect the changing seasons.
Ethereum could see a boost in activity and price, potentially ranging from an educated guess of $4,766.86
to a learned high of $6,015.35
October’s spooky season could bring eerie market movements, with Ethereum’s price potentially ghosting from a haunting low of $5,052.91
to a spirited high of $6,358.90
In a month of giving thanks, Ethereum might harvest gains, with prices potentially ranging from a thankful low of $5,338.95
to a generous high of $6,702.45
, as the community reflects on the year’s bounty.
Wrapping up the year, the ETH price could be wrapped in a festive rally, with prices potentially resting at a bottom $5,625
or climbing to a celebratory $7,046
, embodying the season’s warmth and cheer.
As Ethereum continues to evolve, 2026 could mark a pivotal year of technological breakthroughs and wider adoption. With the ecosystem maturing, anticipate Ethereum to navigate the year with a minimum price of $7,784.22 and possibly reaching exhilarating highs of $9,737.03
| Month | Minimum Price | Average Price | Maximum Price | Potential ROI |
|---|---|---|---|---|
| January 2026 | $5,805 | $5,977.42 | $7,270.33 |
121.5% |
| February 2026 | $5,985 | $6,162.83 | $7,494.67 |
128.3% |
| March 2026 | $6,165 | $6,348.25 | $7,719 |
135.1% |
| April 2026 | $6,345 | $6,533.67 | $7,943.33 |
142% |
| May 2026 | $6,525 | $6,719.08 | $8,167.67 |
148.8% |
| June 2026 | $6,705 | $6,904.50 | $8,392 |
155.6% |
| July 2026 | $6,885 | $7,089.92 | $8,616.33 |
162.5% |
| August 2026 | $7,065 | $7,275.33 | $8,840.67 |
169.3% |
| September 2026 | $7,245 | $7,460.75 | $9,065 |
176.1% |
| October 2026 | $7,425 | $7,646.17 | $9,289.33 |
183% |
| November 2026 | $7,605 | $7,831.58 | $9,513.67 |
189.8% |
| December 2026 | $7,785 | $8,017 | $9,738 |
196.6% |
| All Time 2026 | $6,795 | $6,997.21 | $8,504.17 |
159% |
As the new year unfolds, Ethereum could find itself navigating through the uncertainties and a flood of new investment from market participants. The renewed recovery may surge the ETH price to a high of $7,270.33
, while occasional mark swing lows at $5,805
Building up on January’s recovery, analysts believe the Ethereum price could rise to a new high $7,494.67
in February, while the correction trend may pull the asset back to the $5,985
mark.
As winter’s grip loosens, Ethereum might experience a thaw in market hesitancy, potentially leading to a spring of investment activity. The ETH price could find suitable support at a low of $6,165
, while a recovery trend may see a rise to the $7,719
mark.
April may shower Ethereum with volatility, presenting a mix of potential dips and surges. Prices could fluctuate from a low of $6,345
, up to a revitalized high of $7,943.33
Mirroring the growth of spring, the crypto analyst predicts the ETH price to set a minimum price of $6,525
, with potential growth pushing the maximum to $8,167.67
The onset of summer could bring a calming effect on Ethereum’s volatility, stabilizing prices. The price swing may find a steady base at $8,392
, while a potential may ascent to $6,705
With summer at its peak, Ethereum might ride a wave of heightened market activity, potentially reaching up to $8,616.33
, while bottom support could be located at $6,885
August may witness stable price action, as the Ethereum price may recuperate its exhausted bullish momentum, The potential consolidation may uplift the ETH price to $8,840.67
, while the correction phase may plunge the price to a low of $7,065
The arrival of autumn might rejuvenate Ethereum’s market activity, with prices potentially ranging from a base support of $7,245
to a robust high of $9,065
The Halloween month may also haunt Ethereum holders with new correction trends as the price may plunged to a low of $7,425
, while some upswing could mark high at $9,289.33
In a time of gratitude, the Ethereum holder seek for pullback opportunity be the ongoing correction seek suitable support. Thus, the ETH price could see an extended correction to $7,605
, while the bullish swing could reach $9,513.67
high.
Closing the year, Ethereum could embrace a festive spirit, and drive a rally to $9,738
high, while occasional pullback seek support at $7,785
low.
With the growing inflows in the Bitcoin Spot ETFs back on track, institutional investors are picking back up on the Bitcoin craze. As Bitcoin forms a new all-time high before the halving event, BTC price surpasses the $73,000 mark, and even shows recovery from a minor pullback.
As U.S. market sentiments towards Bitcoin turn more bullish, Bitcoin HODLers expect this uptrend to continue beyond $75,000. Will this bull lead Bitcoin above $100,000?
With the BTC price trading at its all-time high in the “Pre-halving rally,” the oldest crypto is on a bullish track. As 2024 shapes up to be the breakout year for Bitcoin, expectations are set for $100K this season.
With the markets filled with high hopes, questions are arising like: “Is Bitcoin ready to reach the $100K mark?” or “Will Bitcoin ever go up?” or “Where will Bitcoin be in 5 years?”
We bring our comprehensive Bitcoin Price Prediction 2024-2030 to solve such doubts.
Also Read: How Will Bitcoin Halving 2024 Impact BTC Price?
| Cryptocurrency | Bitcoin |
| Token | BTC |
| Price | $ 68,346.84309557 |
| Market Cap | $ 1,344,719,011,892.1523 |
| Trading Volume | $ 20,505,466,080.4350 |
| Circulating Supply | 19,674,925.0000 |
| All-time High | $68,789.63 Nov 10, 2021 |
| All-time Low | $0.04865 Jul 15, 2010 |
| 24 High | $ 68,484.0900 |
| 24 Low | $ 67,316.0000 |
The following are the major factors affecting Bitcoin price prediction-
Bitcoin has recorded another consecutive bullish week, pushing its price over the $73,000 threshold and nearing the significant $75,000 level. The surge in Bitcoin’s value coincides with the total trading volume of Bitcoin ETFs, highlighting the cryptocurrency’s increasing market strength. Bitcoin’s market capitalization has also surpassed $1.34 trillion, indicating a robust uptrend.
Source – Tradingview
As Bitcoin manages to bounce with the retest of the $65,000 mark, the buyers are anticipating a massive jump. With the potential surge crossing the $73,000 peak, the uptrend could hit a new all-time high this month.
The ongoing pos-retest reversal, bolstered by market indicators and Fibonacci projections, suggests a uptrend to the $75,000 mark. However, if Bitcoin breaks above $75,000 with a strong bullish close, it could escalate to $79,000, paving the way for reaching higher milestones.
| Bitcoin Price Prediction | Potential Low | Potential Average | Potential High |
| Bitcoin Price Prediction April 2024 | $60,000 | $71,000 | $79,000 |
Also Read: What is Bitcoin? An In-Depth Guide To The King Of Digital Currencies
The high spirits around the Bitcoin Spot ETF approvals kick in for the BTC price to spark a bull run. The uptrend continues the streak of 5 monthly bullsih candles and is ready to challenge the overhead resistance at $50K. Moreover, the halving year has always been a bullish year in Bitcoin history, leading to a bull run in the next year.
Adding bullishness at lower levels, Tether buys 8,888 Bitcoin (BTC) to their holdings for $380 million.
Further, the rising hopes for the interest rate cuts in the US market will bolster the uptrend momentum in BTC price. Therefore, 2024 is highly anticipated to be a bullish year for Bitcoin. With a potential high of around $120,000 and a potential low of $35,000.
| Bitcoin Price Prediction | Potential Low | Potential Average | Potential High |
| Bitcoin Price Prediction 2024 | $35,000 | $77,500 | $120,000 |
| Bitcoin Price Prediction | Potential Low ($) | Average Price ($) | Potential High ($) |
| 2025 | 61,357 | 95,903 | 140,449 |
| 2026 | 82,522 | 115,569 | 155,284 |
| 2027 | 152,837 | 160,942 | 169,047 |
| 2028 | 174,063 | 183,485 | 192,908 |
| 2029 | 204,634 | 222,096 | 239,559 |
| 2030 | 277,751 | 312,767 | 347,783 |
With the launch of potentially more Bitcoin-related financial services and the global adoption spark of Bitcoin, BTC prices will maintain a bullish trend in 2025. The cryptocurrency is expected to create a high of $140,449 with a low of $61,357. Therefore, the average Bitcoin price prediction for 2025 will potentially be $95,903.
Firstly, as per Bitcoin Price Prediction 2026, the BTC price range in 2026 is expected to be between $82,522 to $155,284. Moreover, the average price is projected to be $115,569.
Subsequently, as per BTC Price Prediction for 2027, the Bitcoin price range can be between $152,837 to $169,047. Furthermore, the average price is expected to be $160,942, indicating a relatively stable bullish period for Bitcoin.
With the 5th Halving, the Bitcoin price will see another bullish spark in 2028. Specifically, as per Bitcoin Price Prediction 2028, the potential BTC price range in 2028 is $174,063 to $192,908. Additionally, the average price is expected to be $183,485, demonstrating continued positive momentum.
Thereafter, as per BTC Price Prediction 2029, the BTC price will range between $204,634 to $239,559. Significantly, the average price is projected to be $222,096, indicating a significant rise in Bitcoin’s value.
Finally, coming to 2030, Bitcoin Price Prediction maintains a positive trend. Indeed, the BTC price is expected to create its new all-time high, with a price range between $277,751 to $347,783. In conclusion, the average price is expected to be $312,767.
| Firm Name | 2024 | 2025 |
| Gov.Capital | $91,245 | $123,352 |
| DigitalCoinPrice | $78,717 | $110,963 |
| Trading Beasts | $88, 632 | $154,435 |
Also Check Out : Bitcoin ETF Approved: Exploring the Next Big Catalyst For Crypto Bull Run 2024
Firstly, the Bitcoin ‘halving’ just took place, an event that happens roughly every four years. Essentially, Bitcoin miners’ reward for validating transactions gets cut in half. Consequently, this curtails the number of new Bitcoins in circulation, usually sparking a price rally. According to data, the price surges after previous halvings. Therefore, let’s watch this space.
| Event | Date | Reward (BTC) | Mined (BTC) |
| Launch | January 2009 | 50 | 10,500,000 |
| Halving 1 | November 2012 | 25 | 5,250,000 |
| Halving 2 | July 2016 | 12.5 | 2,625,000 |
| Halving 3 | May 2020 | 6.25 | 1,312,500 |
| Halving 4 | March 2024 | 3.125 | 656,250 |
| Halving 5 | Expected 2028 | 1.5625 | 328,125 |
| Halving 6 | Expected 2032 | 0.78125 | 164,063 |
Firstly, at CoinPedia, we’re feeling optimistic about Bitcoin’s price going up. Significantly, one big reason is the upcoming Bitcoin “halving” event. In simple terms, every four years, the number of new Bitcoins entering the market gets cut in half. Consequently, this usually increases the price because there’s less supply.
Further, big shots like Uber CEO Dara Khosrowshahi staying positive on crypto and signals the company is ready to accept Bitcoin as a payment option in the future.
Hence, We expect the BTC price to create a new 2024 high of $120,000 by 2024.
| Bitcoin Price Prediction | Potential Low | Potential Average | Potential High |
| Bitcoin Price Prediction 2024 | $35,000 | $77,500 | $120,000 |
Furthermore, using the above Bitcoin Halving table, we asked ChatGPT to calculate the potential jump in Bitcoin after the 2024 halving. Utilizing Arithmetic and Geometric Progression, respectively, ChatGPT calculates the Bitcoin price prediction for 2024 post-halving to be a 290% and 4,160% jump.
Rounding off the current Bitcoin price to $26,000, firstly, the calculations display the post-halving Bitcoin to skyrocket drastically. Specifically, reaching $101,400 by A.P. and $1,107,808 by G.P., Bitcoin is set to create a new high in 2024.
Many influencers and Bitcoin maximalists are predicting the BTC price to reach $1M, but the chances of them using G.P. are less, but not zero.
Analyzing the historic price sentiment of BTC is suitable for rightly interpreting the indications we come across while analyzing its future price sentiment.
In a nutshell, the optimism and hope around Bitcoin have continued to grow ever since its launch. And now, with the institutions coming together with the 4th Bitcoin halving around the corner marks a crucial turning point. The upcoming years for BTC are marked in green as Bitcoin adoption grows like wildfire in a fiat world.
Several factors, such as supply and demand dynamics, macroeconomic conditions, regulations, mainstream adoption, and whale behaviour, influence Bitcoin prices in the short and long term. The upcoming halving event is expected to restrict new coin supply and boost demand, which could raise prices.
While it is challenging to predict the crypto market with absolute certainty, many experts remain optimistic about Bitcoin crossing $100K in the long run. Its popularity as a store of value akin to digital gold continues to grow. As adoption keeps rising globally and more institutional investors enter the market, it isn’t unreasonable to assume that the flagship cryptocurrency could rally towards six figures or beyond by 2030 after surpassing previous all-time highs. Much will depend on how Bitcoin’s underlying technology and use cases evolve over the next few years.
The Bitcoin halving takes place once every four years or every 210,000 blocks. The next Bitcoin halving will take place in April 2024.
Over the past 24 hours, BTC witnessed a 0.69% change, hitting a peak of $30,630 and a low of $30,259.
At the time of publishing, the price of 1 BTC was $30,604.
Bitcoin halving ensures that the amount of bitcoin we can mine decreases with each block, making bitcoin more scarce and ultimately more valuable.
Bitcoin price will surge with the Bitcoin halving coming closer.
The projected price of Bitcoin in 2024 will range between $35,000 and $120,000, with an average of $77,500.
For 2024, the BTC price will have a projected high of $120,000 and a potential low of $35,000.
In 2025, the projected high for Bitcoin is $110,449, with a low of $61,357 and an average price of $85,903.
The 2020 fall in Bitcoin found support at $3850 and started at $10,501. Considering you bought at the peak, your $100 investment would have increased by 191%. In short, your investment would be worth $219.
The current circulating supply of BTC is approximately 19,428,268 BTC, with a market cap of $595,390,159,392. Bitcoin will have a maximum supply of 21,000,000 (21 Million) tokens.
Bitcoin maximalists like Michael Saylor expect Bitcoin to hit the $1,000,000 mark by 2030. Investors can expect the Bitcoin price to surpass the $300,000 mark.
Bitcoin (BTC) halving is expected later this month but a confluence of factors is likely to set the cryptocurrency’s fourth such event apart from prior occurrences.
Halving—after which the rate bitcoins are generated by the network roughly every ten minutes is cut in half—typically occurs after 210,000 bitcoins are mined or roughly every four years. Halving is expected this year around April 20, but some suggest it could happen even sooner.
In the runup to prior halving iterations, bitcoin has scaled new highs in the months following the reduction in the crypto asset’s rate of issuance.
Recently it reached a new all-time high before the current cycle’s halving event for the first time. Analysts at Coinbase warn the market could be placing undue importance on price movements around halving without taking into account the context of broader market conditions.
“The performance of bitcoin around previous halving events was most likely context-dependent. That may explain why price trends during different cycles have varied so widely,” wrote in a March report.
For example, they attribute some of the 45% growth before the second halving in July 2016 to uncertainties surrounding Brexit and the 73% gain ahead of the third halving in May 2020 to the pandemic-era initial coin offering (ICO) boom.
Spot bitcoin exchange-traded funds (ETFs) have “fundamentally changed “ the market dynamics for bitcoin, according to Coinbase. And they did not exist at the time of prior halvings.
The products that began trading in January have seen massive inflows that have driven up demand and consequently the price of bitcoin.
“The approval of bitcoin ETFs in the U.S. could significantly alter the supply and demand dynamics of bitcoin, as inflows are roughly 5-7X the daily new units of generated BTC,” said a 21Shares report.
So, how does it play out in the context of the halving? In a hypothetical scenario, if the supply consisted of only newly minted bitcoin (and existing bitcoin were not available to be traded), here’s what Coinbase said could happen:
“If we assumed that the pace of new inflows into US-based ETFs slowed from $6 billion in February to say a steady state of $1 billion of net inflows per month, a simple mental model suggests that measured against ~13.5k BTC mined per month (in a post-halving environment) the equilibrium price for bitcoin should be closer to around $74,000,” they wrote.
“Bitcoin available to trade (i.e. the difference between circulating and illiquid supply) has been in decline since early 2020, a major shift from previous cycles,” said Coinbase.
Normally, illiquid supply is attributed to lost wallets and forgotten keys but Coinbase analysts also mention “the level of available bitcoin supply has been trending lower over the last four years” and that’s a departure from prior halving cycles.
But that’s not necessarily a bad thing for bitcoin, since that could mean investors with long-term positions and less inclination to sell with short-term price variations.
With more than $19 million bitcoin in circulation and the supply capped at $21 million, the halving is making mining harder and slashing incentives for miners in half.
Typically, miners sell bitcoin ahead of halvings in anticipation of covering operational expenses for things like energy and mining equipment. However, the bitcoin rally has led to fewer bitcoin sales by miners who have up to 1.8 million bitcoin in their reserves.
Another key factor to consider during the upcoming halving event is the contrast of bitcoin’s predictable, declining rate of issuance in context of the uncertainties around the U.S. Federal Reserve lowering its benchmark rates.
The general thesis is if the Fed cuts rates, U.S. Treasury yields will weaken, making riskier assets such as cryptocurrencies more attractive to investors. However, unexpectedly robust economic data in the past few weeks has stoked the debate around rate cuts. Cutting too soon could revive inflation but keeping rates higher for too long could push the economy to the brink of a recession.
Other central banks across the globe have already begun to shift their monetary policy stance.
“The eagerness of major central banks to reduce interest rates despite strong economic growth has likely contributed to an increase in market inflation expectations,” digital asset manager Grayscale said in a report. “The risk of higher inflation may in turn be stimulating demand for alternative stores of value, like physical gold and Bitcoin.”
TRUE token (TFT) is a new GameFi project that aims to surpass the success of the once-popular Notcoin. TFT is currently available through an exclusive NFT Token Offering (NTO), offering early adopters the opportunity to significantly boost their investment. The NFTs distributed contain a portion of TRUE tokens, ranging from 100 to 500,000 TFT, at substantial discounts. The NTO ensures that your allocation is 100% guaranteed, secure, and manageable. Additionally, NFT holders gain exclusive TRUE membership and entry into a prize draw for $330,000 in extra tokens, 10 ETH, status cards, merch, and tokenized partner gifts.
TRUE, with six years of experience in game and blockchain development and significant backing of over $3.45M raised, led by SoftSwiss, is well-positioned in the iGaming sector. With more than 4M active players and 16,000 third-party games interested in its blockchain service, TRUE has remained profitable even in challenging markets, setting a strong foundation for TFT post-token generation event. As TRUE’s value is expected to benefit from the activity within the upcoming TRUE World iGaming metaverse, set to attract millions of users, now is the ideal time to secure your TFT allocation before it takes off.
NEAR Protocol has experienced fluctuations recently, with a current price range between $6.73 and $7.98. While it dipped by almost 8% in the past week, it has risen by over 50% in the last month and more than 500% over the past six months. The price movements of NEAR appear mixed, with periods of rapid growth followed by smaller changes.
The near resistance at $8.67 could pose a challenge, but with sufficient momentum, NEAR could aim for the higher resistance at $9.91. Conversely, if it experiences a decline, it may find support at $6.18 or even lower at $4.93. The mixed outlook suggests that NEAR’s price may experience both upward and downward movements in the near future.
Avalanche (AVAX) has witnessed significant price swings over the last six months, surging by 341.12%. While it climbed 9.08% last month, it dropped by 13.05% last week. Currently trading between $51.34 and $58.12, AVAX appears to be in a corrective phase, with the RSI indicating a neutral stance, suggesting that the price may not move sharply in either direction soon.
Looking ahead, there is potential for growth if AVAX surpasses the near resistance at $62.13, with further gains possible if it breaks the higher resistance at $68.91. However, if buying pressure subsides, the price could fall to the nearest support at $48.57 or even the lower support at $41.79. The high Stochastic value at 84.48 indicates a possible consolidation phase. AVAX’s recent price movements suggest that it may continue to experience fluctuations in the short term.
Solana’s price has been fluctuating recently, ranging between $187.30 and $210.62. While it saw a slight dip of 0.46% in the past week, it has surged by 39.08% over the last month and an impressive 691.63% over the past six months. Currently, the price movements appear corrective, with the Relative Strength Index indicating a balance between buyers and sellers.
Looking ahead, SOL has the potential for growth, with the nearest resistance level at $218.61. If it breaks through, the next target could be $241.93. On the downside, SOL is likely to find support near $171.97 and then at $148.65. The mixed signals from Stochastic (42.10) and MACD (-0.89) suggest a cautious approach.
While NEAR, AVAX, and SOL show potential for upside, they may not match the short-term potential of other options. The standout choice is the TRUE token (TFT), which is poised for significant growth in the iGaming metaverse. TFT’s innovative NFT Token Offering provides unique investment opportunities, and its solid foundation sets it up for success in the upcoming bull run.
Featured Image: Freepik
Today’s most trending cryptocurrency list on CoinMarketCap features Ethena (ENA), Meme Ai (MEMEAI), and Dogwifhat (WIF). $MEMEAI is up over 50% in the past day.
Across crypto news outlets several presales yet to hit exchanges are also trending, including new meme coins Dogecoin20 (DOGE20) and Slothana (SLOTH).
Recent Binance listing Ethena is trending in the crypto space with its new synthetic dollar protocol, USDe, built on the Ethereum blockchain. This protocol is not just a technical achievement; it represents a strategic pivot towards a decentralized financial system, free from traditional banking constraints.
USDe offers a stable, scalable, and censorship-resistant alternative for digital transactions, underpinned by sophisticated delta-hedging mechanisms and Ethereum collateral.

Currently, Ethena’s market position is strong, with a trading price of $0.91 and an impressive 24-hour volume of over $1 billion, despite a recent correction of around 16%.
This level of activity underscores the vibrant interest in Ethena, evidenced by its market cap of approximately $1.3 billion and its position as the 81st ranked asset on CoinMarketCap.
Diving into the technicals, Ethena has some key numbers to watch. The pivot point is at $0.88, with resistance lines drawn at $1.05 (thanks to the 23.6% Fibonacci extension), $1.34, and $1.48. For those looking to gauge support levels, keep an eye on $0.74, followed by $0.60 and $0.43. The Relative Strength Index (RSI) is at 59, indicating a market in balance, yet teetering on the edge of exciting moves.
For those interested in following Ethena’s journey and engaging with its community, numerous social platforms offer real-time updates and discussions. The official website provides comprehensive insights, while its Telegram group hosts over 10,000 members actively discussing Ethena’s developments. On Twitter, Ethena Labs boasts 160.3K followers, offering a stream of updates, insights, and community interactions.
In summary, Ethena’s bullish potential hinges on maintaining above $0.88, while a drop below this pivot could trigger a sell-off.
Meme Ai, priced at approximately $0.008, exemplifies a dynamic blend of technology and humor, offering more than the typical meme coin experience.
On Friday, Meme Ai witnessed a notable 30% surge in its value boasting a trading volume of around $6 million. That continued into the early hours of Saturday, with MEMEAI now up 50% in the past 24 hours.
Positioned at #1315 on CoinMarketCap, Meme Ai has a market capitalization of close to $9 million.
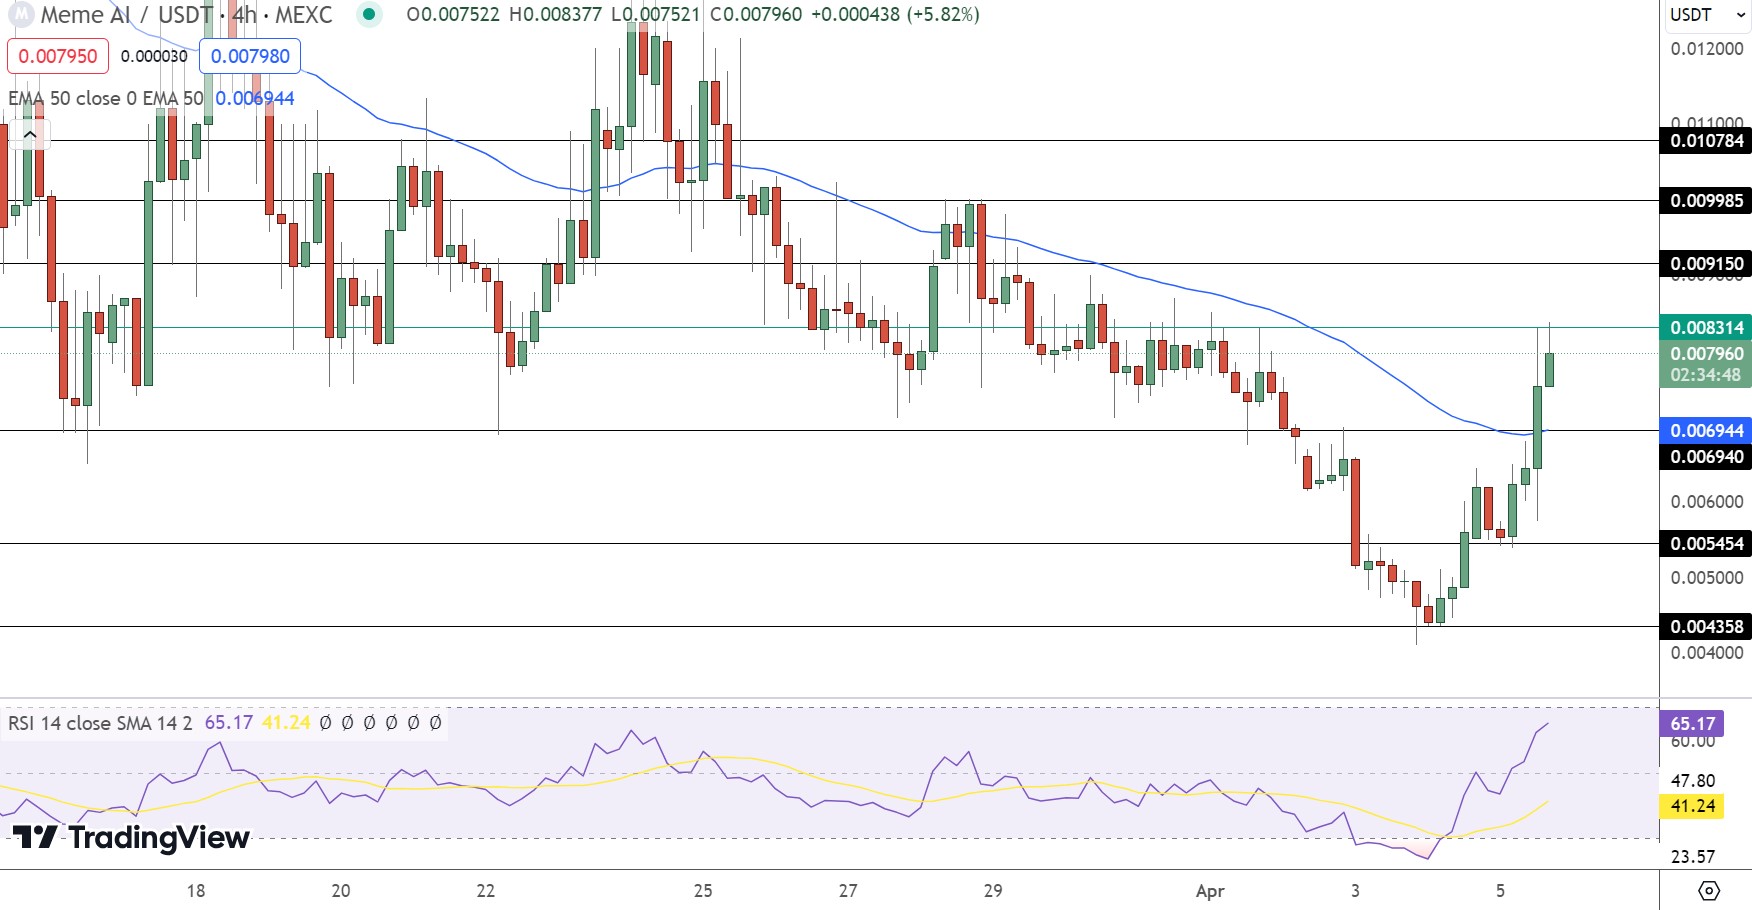
Technical analysis highlights a pivot point at $0.008. The asset faces immediate resistance at $0.009, with subsequent barriers at $0.010 and $0.011.
On the downside, support levels are established at $0.007, $0.005, and $0.004. The Relative Strength Index (RSI) of 65 suggests growing momentum, while the 50-Day Exponential Moving Average (EMA) at $0.007 indicates a potential consolidation zone.
Meme Ai’s social media presence, with over 4,028 Telegram subscribers and 5,066 Twitter followers, reflects a burgeoning community engaged in the blend of digital currency and entertainment. In summary, Meme Ai demonstrates a bullish trajectory above the $0.008 mark.
Dogwifhat, currently trading at $3.37, has experienced a 12.% decline, pushing its market cap to $3.36 billion. Despite the tumble, it’s holding its own in the rankings, sitting at 39th on CoinMarketCap, supported by a solid trading volume nearing $700 million.
At a glance, the pivot point is at $3.54 and It’s facing headwinds at resistance levels of $4.08, $4.45, and $4.86, while finding some ground at support levels of $2.95, $2.67, and $2.36.
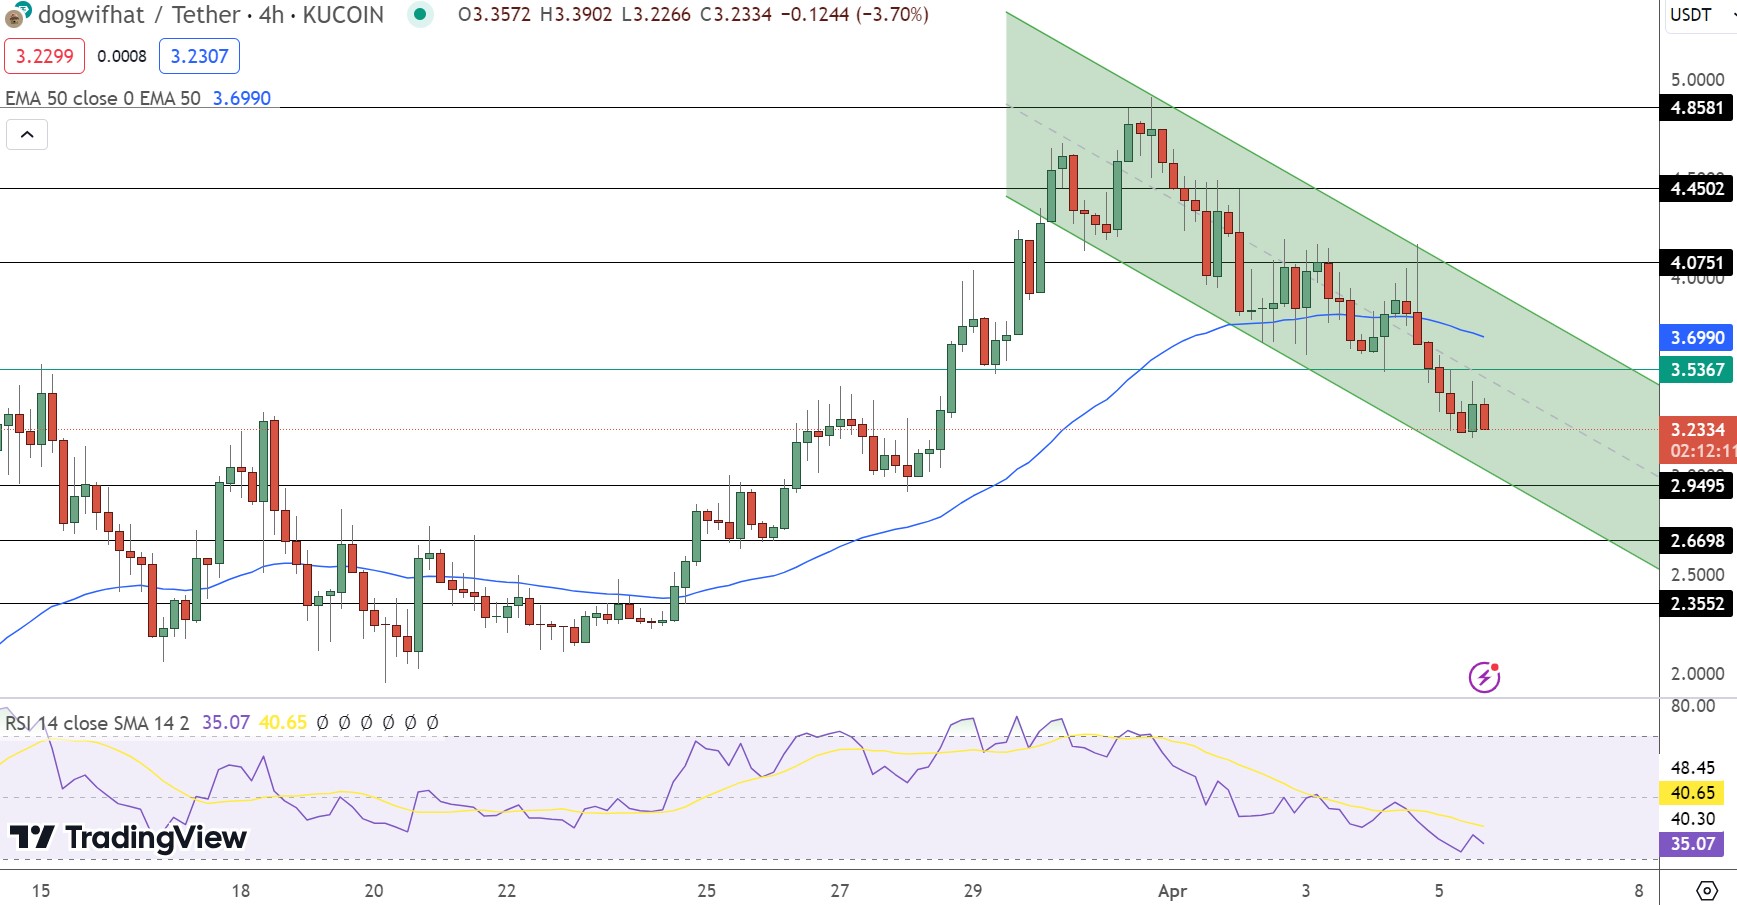
Diving into the technicals, the mood seems a bit gloomy. With the Relative Strength Index (RSI) hovering at 35 and the 50-day Exponential Moving Average (EMA) at $3.69, there’s a hint of bearish sentiment in the air. Dogwifhat appears to be in a bearish channel, struggling to climb above the 50 EMA marker.
Wrapping it up, Dogwifhat seems to be in a cautious zone. If it stays below $3.54, the bearish trend might continue. However, crossing above that line could inject some optimism into its market outlook.
The two meme coins on our most trending cryptocurrency roundup are joined by many others, including recent listings, well-established names and upcoming ICOs.
Book of Meow which we covered yesterday in a trending coins roundup has exploded in price, up 80% since that post. Recent listing HUMP is also trending #8 on CoinMarketCap, with Pepe in #12.
Popular YouTube channel 99Bitcoins has speculated Pepe could flip Shiba Inu, and also highlighted upcoming Dogecoin themed token Dogecoin20 (DOGE20) which has its IEO coming up on April 20th.
The 707,000 subscriber channel also recently reviewed Slothana (SLOTH), alongside four other trending meme coins on Solana.
Despite Ripple’s sluggish price growth, several analysts on X are projecting a bullish price prediction for XRP. Egrag Crypto, a notable analyst on X, has issued a new forecast, adding that XRP will soon be able to hit critical price markers of $0.702 and $0.786.
Also Read: Ripple: Will XRP Break Past Its Consolidation Phase To Hit $1 Post Bitcoin Halving?

According to Egrag Crypto, XRP’s next price targets are leveled at the $0.702-$0.786 thresholds. The analyst noted how XRP is poised to gain considerable momentum soon after it crosses the critical resistance levels hovering at these price targets.
“XRP has seen moderate gains (~18%) since Bitcoin ETF approval compared to other tokens in the top 10. It has posted gains of 50% and more. This is likely because investors are awaiting the conclusion of the Ripple lawsuit. Therefore, our XRP price prediction forecasts a price of $1.80 by the end of 2024.“
The platform later predicts how XRP may also breach an ambitious price mark of $3 by 2024, provided Ripple wins the case against the SEC. However, the platform further noted how XRP could also hit a new price low if it fails to win the case against the US Securities and Exchange Commission.
“Depending on the lawsuit’s outcome and crypto market conditions, it could go much higher, potentially reaching $3.10. Nevertheless, there is also scope for lows of $0.30 if the case swings in the SEC’s favor.”
Also Read: Ripple: When Will XRP Hit Critical Price Markers of $0.70 and $1?
For April, Coinpedia expects XRP to experience modest price hikes coupled with a few price downturns. The platform expects XRP to average around the $0.81 price mark in April 2024.
Another leading platform, CoinCodex predicts XRP to gain 11% by April End and the First week of May 2024.
“According to our current XRP price prediction, the price of XRP is predicted to rise by 11.75% and reach $ 0.652837 by May 5, 2024. Per our technical indicators, the current sentiment is Bearish while the Fear & Greed Index is showing 79 (Extreme Greed). XRP recorded 16/30 (53%) green days with 4.11% price volatility over the last 30 days.”
What’s the story
Bitcoin has surged by 1.15% in the past 24 hours to now trade at $68,016.32. It is 3.17% down compared to last week.
Ethereum, the second most popular token, is up by 2.16% from yesterday and is currently trading at $3,346.63. It is down 5.17% compared to last week.
The market capitalization of Ethereum is now at $401.22 billion.
BNB is trading at $584.73, which is 2.50% more than yesterday and 3.87% lower from the previous week.
XRP’s price today is $0.55 after moving up 1.30% in the last 24 hours. Compared to last week, it is 5.70% down.
Cardano and Dogecoin are trading at $0.55 (up 1.48%) and $0.11 (up 4.19%), respectively.
Solana, Polka Dot, Shiba Inu, and Polygon are currently trading at $177.37 (up 1.94%), $8.47 (up 2.95%), $0.000022 (up 2.8%), and $0.88 (up 2.12%), respectively.
Based on the weekly chart, Solana is down 10.85% while Polka Dot has fallen 12.35%.
Shiba Inu’s value has declined by 10.97% in the last seven days whereas Polygon is down 10.57%.
Core, ORDI, Pendle, Injective, and NEAR Protocol are the top five gainers on a 24-hour basis. They are trading at $2.64 (up 13.11%), $64.05 (up 8.76%), $6.70 (up 8.48%), $34.12 (up 8.05%), and $7.13 (up 7.09%), respectively.
A stablecoin is a cryptocurrency with extremely low volatility. Its value is linked to a physical asset such as fiat currency or gold.
Talking about some of the popular tokens, Tether, USD Coin, and Binance USD are trading at $1 (down 0.01%), $0.99 (down 0.01%), and $58,500 (up 7.92%), respectively.
The biggest losers of the day are Mantle, Maker, Optimism, Axelar, and Bitcoin SV. They are trading at $1.32 (down 3.81%), $3,727.55 (down 3.25%), $2.93 (down 2.37%), $1.53 (down 1.76%), and $97.66 (down 1.21%), respectively.
The top three cryptocurrency spot exchanges are Binance, Coinbase Exchange, and Kraken, based on the traffic, trading volumes, liquidity, and confidence in the legitimacy of trading volumes.
DeFi or decentralized finance is an umbrella term for global, peer-to-peer financial services on public blockchains.
Some of the prominent DeFi tokens are Avalanche, Chainlink, Internet Computer, Uniswap, and Dai.
They are trading at $46.73 (up 3.13%), $17.45 (up 0.97%), $17.12 (up 1.19%), $11.09 (up 3.78%), and $1 (up 0.03%), respectively.
Non-fungible tokens (NFTs) are cryptocurrencies that lack the fungibility property, which means they cannot be exchanged for other tokens.
Internet Computer, Stacks, Immutable, Render, and Theta Network are among the prominent NFT tokens.
They are currently trading at $17.12 (up 1.38%), $3.20 (up 4.63%), $2.70 (up 0.46%), $9.52 (up 2.95%), and $2.66 (up 6.71%), respectively.
The current global crypto market cap is $2.53 trillion, a 1.08% increase over the last day.
The total crypto market volume over the last 24 hours is $95.78 billion, which marks a 1.16% increase.
The global cryptocurrency market valuation was $2.38 trillion last month, in comparison to $1.67 trillion three months ago.

XRP, which is the token of the XRP Ledger launched by Ripple Labs in 2012, was last at $0.587.
That leaves it down close to 7% for the week, and over 20% since 2024 highs printed in March.
Ripple’s CEO Brad Garlinghouse said the firm’s shift into the $150 billion USD stablecoin market didn’t mean it is giving up on its ambitions to grow its XRP-powered on-demand liquidity product. Rather, a Ripple stablecoin would act as a complementary product, Garlinghouse noted.
Either way, XRP investors don’t seem to have been too fussed by the news.
The dominant theme for XRP remains the SEC’s battle to classify it as a security issued by Ripple.
After some legal wins for Ripple in 2023 that momentarily boost XRP, momentum has stagnated this year.
But long-term price predictions remain bullish, not least for technical reasons.
A long-term assessment of the XRP price suggests it has formed a pennant structure in the last four years.
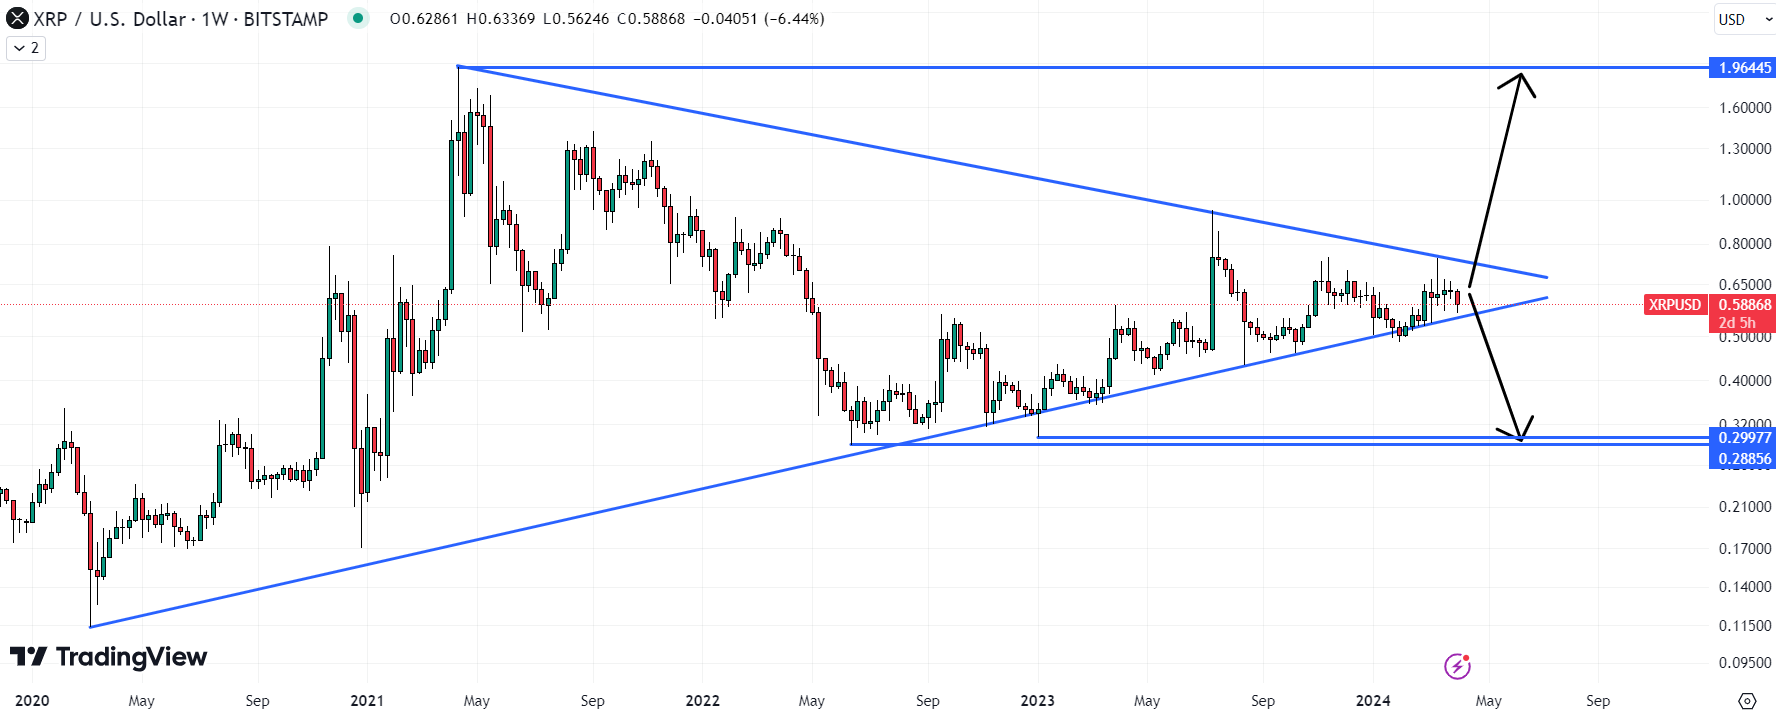
A downside breakout could trigger a drop back towards 2022 lows under $0.30. But in the bullish market environment, upside price risks seem greater.
A break to the north of the pennant structure could see the XRP price quickly retest its 2021 highs around $2. That could mean 4x gains for XRP.
While not impossible, reaching a $100 token price during the current bull market seems far-fetched.
That would require a 170x rally, taking XRP’s market cap to above $5.5 trillion. That’s over 4x Bitcoin’s current market cap.
And XRP doesn’t have even close to the current levels of adoption as Bitcoin, or as strong of an adoption outlook as BTC.
Investors looking at altcoins might want to consider an alternative high-risk-reward investment strategy. Presale investing.
Analysts at Cryptonews spend a lot of time combing the presale market looking for potential gems.
One potential market leader they like the look of is a first-of-its-kind crypto-powered VR/AR project 5thScape, which has now raised nearly $4 million in its presale.
5thScape is pitching itself as the world’s first VR/AR mixed-reality platform to break boundaries through its integration of crypto tokenization to provide a superior reward experience.
5thScape runs on the Ethereum network and will make use of the Skale Network Layer 2 technology to enable the scaling necessary for gaming and other virtual world activities.
To work well, virtual reality and augmented reality need great hardware too. So the team at 5thScape will develop the VR Ultra headset and the Swiftscape VR chair in order to maximize comfort and ergonomics to deliver an immersive experience with precise motion tracking and intuitive controls.
The funds being raised in the presale will enable the project to complete the development and manufacture of its hardware and build out the decentralized network infrastructure.
🚀 Our presale has surged past stage 3!
🌐 Join us now and delve into a world of virtual reality with our multi-utility token.
🎉 Don’t miss out on being part of our vibrant community! #cryptocrash #cryptocrash #Wormhole #cryptocurrency #5thScape #Presale #4thstage 🌟 pic.twitter.com/QeznEVAvFJ
— 5th Scape (@5th_scape) April 4, 2024
Priced at just $0.00285, a steep discount versus the token’s planned launch price of $0.1, investors who get involved now can lock in paper gains of 250%.
Given its total token supply of 5.1 billion, investors who get in now are essentially buying into the project at a market cap of $52.1 million.
However, 5thScape could easily become a major market leader in its VR/AR niche. There is a good chance that it could one day become a $500 million market cap token.
That means investors who get in now could potentially lock in gains in the region of 1,000%.
5thScape was audited by Coinsult and no major issues have been found with its code. Also, the project is fully KYC’d by SolidProof; the team passed the KYC verification process on January 3, 2024.
Disclaimer: Crypto is a high-risk asset class. This article is provided for informational purposes and does not constitute investment advice. You could lose all of your capital.
 News Today: US Jobs Report Impact and ETF Market Resilience Analyzed")


