The main tag of Gold News Today Articles.
You can use the search box below to find what you need.
[wd_asp id=1]
1
07, 2024

XAU/USD’s battle with $2,330 extends into a Big week
You have reached your limit of 5 free articles for this month.
Get Premium without limits for only $479.76 for the first month
Access all our articles, insights, and analysts.
Your coupon code
- Gold price trades with caution, kicking off a new week on Monday.
- The US Dollar stays weak amid PCE inflation-led dovish Fed bets, sluggish Treasury yields.
- Gold price looks south, as the daily RSI stays bearish and the 21-day SMA acts as a tough nut to crack.
Gold price is treading water near $2,325 in Asian trading hours on Monday, holding Friday’s range play. Gold price fails to capitalize on the US Personal Consumption Expenditure (PCE) inflation data-led US Dollar (USD) weakness, as buyers turn to the sidelines heading into a Big week.
Fed Chair Jerome Powell and US Nonfarm Payroll in focus this week
Gold traders refrain from placing any fresh directional bets on the bright metal ahead of this week’s speech by US Federal Reserve (Fed) Jerome Powell at the European Central Bank’s (ECB) forum on Tuesday and Friday’s all-important Nonfarm Payrolls data.
These high-impact events from the US economy will likely help reprice the market expectations for a potential Fed rate cut later this year, heavily impacting the value of the Greenback and the Gold price.
Traders raised their bets for a Fed rate cut in September after data on Friday showed that the annual core PCE Price Index, the Fed’s preferred inflation measure, rose 2.6% in May, slowing from a 2.8% increase in April. Following the data release, markets saw a roughly 68% chance that the Fed will lower rates in September, compared to about 64% ahead of the data, according to CME Group’s FedWatch Tool.
At the moment, the chances of a September Fed rate cut are seen at 63%, as markets assess the recent hawkish Fed commentary. San Francisco Fed President Mary Daly told CNBC on Friday that “Fed is not done yet but PCE data is good news.”
Softer US inflation data continued to weigh on the US Dollar, with the pain exacerbated early Monday, thanks to the strong gains in the EUR/USD pair. The Euro rose after the first round of France’s snap election showed the far-right National Rally (RN) party winning, though by a smaller margin than projected.
However, the US Dollar downside appears capped due to the latest leg higher in the USD/JPY pair, in the wake of the downward revision to the Japanese Gross Domestic Product (GDP) data. The Japanese economy shrank more than initially reported in the first quarter, which raised concerns about the timing of the next rate hike by the Bank of Japan (BoJ) and dented the sentiment around the Yen.
Looking ahead, Gold price remains exposed to downside risks should the Greenback stage a comeback on a profit-taking rally ahead of the US ISM Manufacturing PMI data due later on Monday and Fed Chair Jerome Powell’s speech on Tuesday.
But the losses in Gold price could be capped by a strong-than-expected China’s Caixin Manufacturing PMI data and renewed expectations of a Fed rate cut as early as in September. Further, if the Euro extends early gains in the European trading hours, it could accentuate the US Dollar downtrend, providing the much-needed lift to the Gold price.
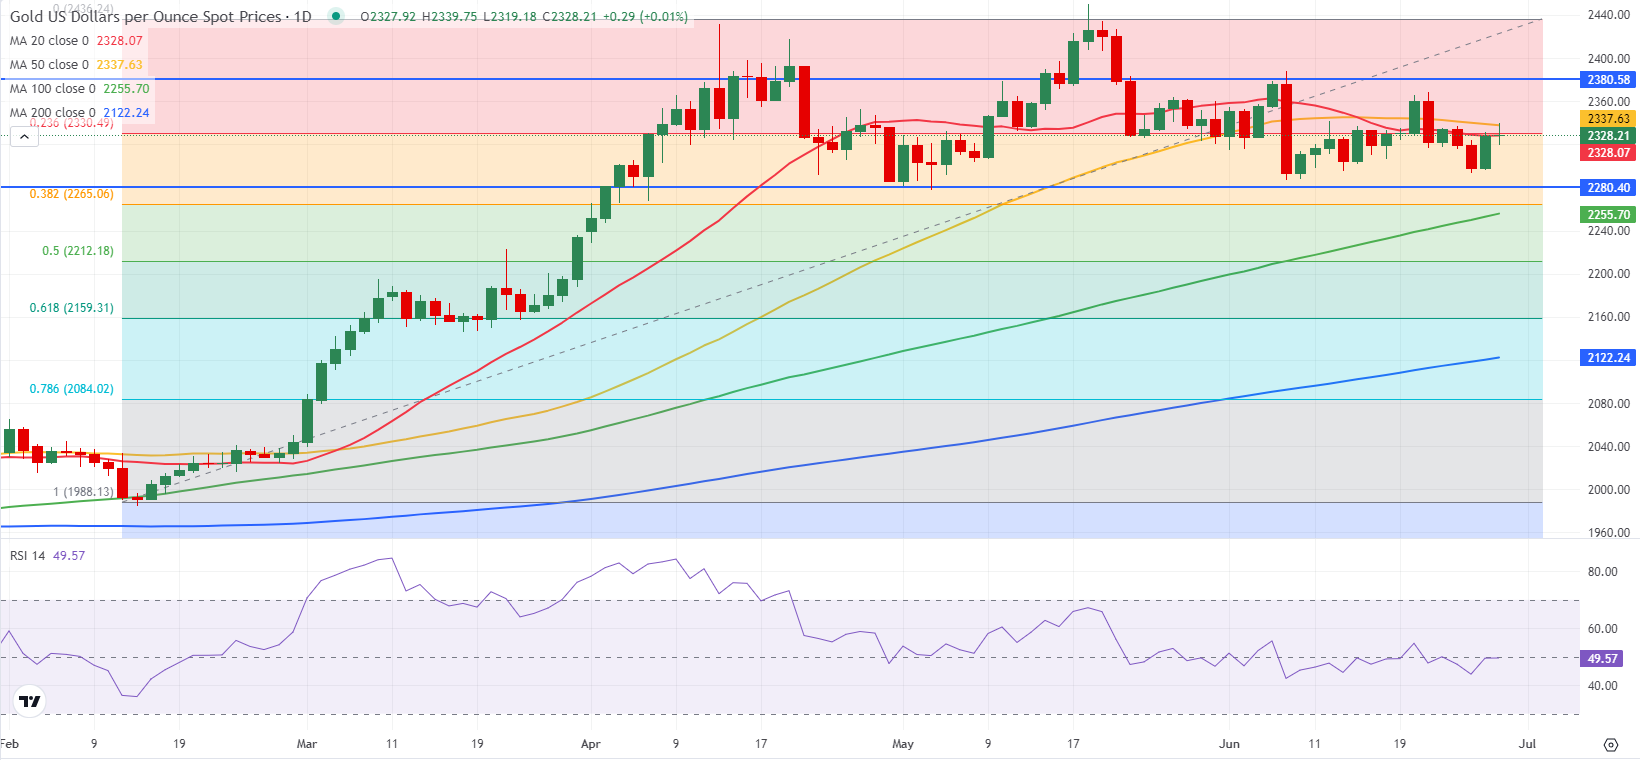
Gold price technical analysis: Daily chart
Gold price looks vulnerable so long as the 14-day Relative Strength Index (RSI) stays below the 50 level and the 21-day Simple Moving Average (SMA) at $2,328 acts as a tough nut to crack for buyers.
Acceptance above the 21-day SMA is critical on a daily closing basis to resume the recovery from the monthly low of $2,287.
Further up, the 50-day SMA at $2,338 will be challenged, followed by the two-week high of $2,369.
However, if sellers regain poise, the immediate support is seen at the $2,300 threshold, below which the $2,290 support area will come into play. Around that level, the previous week’s low and the June low hang around.
The last line of defense for Gold buyers is aligned at the May 3 low at $2,277.
Gold FAQs
Gold has played a key role in human’s history as it has been widely used as a store of value and medium of exchange. Currently, apart from its shine and usage for jewelry, the precious metal is widely seen as a safe-haven asset, meaning that it is considered a good investment during turbulent times. Gold is also widely seen as a hedge against inflation and against depreciating currencies as it doesn’t rely on any specific issuer or government.
Central banks are the biggest Gold holders. In their aim to support their currencies in turbulent times, central banks tend to diversify their reserves and buy Gold to improve the perceived strength of the economy and the currency. High Gold reserves can be a source of trust for a country’s solvency. Central banks added 1,136 tonnes of Gold worth around $70 billion to their reserves in 2022, according to data from the World Gold Council. This is the highest yearly purchase since records began. Central banks from emerging economies such as China, India and Turkey are quickly increasing their Gold reserves.
Gold has an inverse correlation with the US Dollar and US Treasuries, which are both major reserve and safe-haven assets. When the Dollar depreciates, Gold tends to rise, enabling investors and central banks to diversify their assets in turbulent times. Gold is also inversely correlated with risk assets. A rally in the stock market tends to weaken Gold price, while sell-offs in riskier markets tend to favor the precious metal.
The price can move due to a wide range of factors. Geopolitical instability or fears of a deep recession can quickly make Gold price escalate due to its safe-haven status. As a yield-less asset, Gold tends to rise with lower interest rates, while higher cost of money usually weighs down on the yellow metal. Still, most moves depend on how the US Dollar (USD) behaves as the asset is priced in dollars (XAU/USD). A strong Dollar tends to keep the price of Gold controlled, whereas a weaker Dollar is likely to push Gold prices up.
- Gold price trades with caution, kicking off a new week on Monday.
- The US Dollar stays weak amid PCE inflation-led dovish Fed bets, sluggish Treasury yields.
- Gold price looks south, as the daily RSI stays bearish and the 21-day SMA acts as a tough nut to crack.
Gold price is treading water near $2,325 in Asian trading hours on Monday, holding Friday’s range play. Gold price fails to capitalize on the US Personal Consumption Expenditure (PCE) inflation data-led US Dollar (USD) weakness, as buyers turn to the sidelines heading into a Big week.
Fed Chair Jerome Powell and US Nonfarm Payroll in focus this week
Gold traders refrain from placing any fresh directional bets on the bright metal ahead of this week’s speech by US Federal Reserve (Fed) Jerome Powell at the European Central Bank’s (ECB) forum on Tuesday and Friday’s all-important Nonfarm Payrolls data.
These high-impact events from the US economy will likely help reprice the market expectations for a potential Fed rate cut later this year, heavily impacting the value of the Greenback and the Gold price.
Traders raised their bets for a Fed rate cut in September after data on Friday showed that the annual core PCE Price Index, the Fed’s preferred inflation measure, rose 2.6% in May, slowing from a 2.8% increase in April. Following the data release, markets saw a roughly 68% chance that the Fed will lower rates in September, compared to about 64% ahead of the data, according to CME Group’s FedWatch Tool.
At the moment, the chances of a September Fed rate cut are seen at 63%, as markets assess the recent hawkish Fed commentary. San Francisco Fed President Mary Daly told CNBC on Friday that “Fed is not done yet but PCE data is good news.”
Softer US inflation data continued to weigh on the US Dollar, with the pain exacerbated early Monday, thanks to the strong gains in the EUR/USD pair. The Euro rose after the first round of France’s snap election showed the far-right National Rally (RN) party winning, though by a smaller margin than projected.
However, the US Dollar downside appears capped due to the latest leg higher in the USD/JPY pair, in the wake of the downward revision to the Japanese Gross Domestic Product (GDP) data. The Japanese economy shrank more than initially reported in the first quarter, which raised concerns about the timing of the next rate hike by the Bank of Japan (BoJ) and dented the sentiment around the Yen.
Looking ahead, Gold price remains exposed to downside risks should the Greenback stage a comeback on a profit-taking rally ahead of the US ISM Manufacturing PMI data due later on Monday and Fed Chair Jerome Powell’s speech on Tuesday.
But the losses in Gold price could be capped by a strong-than-expected China’s Caixin Manufacturing PMI data and renewed expectations of a Fed rate cut as early as in September. Further, if the Euro extends early gains in the European trading hours, it could accentuate the US Dollar downtrend, providing the much-needed lift to the Gold price.
Gold price technical analysis: Daily chart
Gold price looks vulnerable so long as the 14-day Relative Strength Index (RSI) stays below the 50 level and the 21-day Simple Moving Average (SMA) at $2,328 acts as a tough nut to crack for buyers.
Acceptance above the 21-day SMA is critical on a daily closing basis to resume the recovery from the monthly low of $2,287.
Further up, the 50-day SMA at $2,338 will be challenged, followed by the two-week high of $2,369.
However, if sellers regain poise, the immediate support is seen at the $2,300 threshold, below which the $2,290 support area will come into play. Around that level, the previous week’s low and the June low hang around.
The last line of defense for Gold buyers is aligned at the May 3 low at $2,277.
Gold FAQs
Gold has played a key role in human’s history as it has been widely used as a store of value and medium of exchange. Currently, apart from its shine and usage for jewelry, the precious metal is widely seen as a safe-haven asset, meaning that it is considered a good investment during turbulent times. Gold is also widely seen as a hedge against inflation and against depreciating currencies as it doesn’t rely on any specific issuer or government.
Central banks are the biggest Gold holders. In their aim to support their currencies in turbulent times, central banks tend to diversify their reserves and buy Gold to improve the perceived strength of the economy and the currency. High Gold reserves can be a source of trust for a country’s solvency. Central banks added 1,136 tonnes of Gold worth around $70 billion to their reserves in 2022, according to data from the World Gold Council. This is the highest yearly purchase since records began. Central banks from emerging economies such as China, India and Turkey are quickly increasing their Gold reserves.
Gold has an inverse correlation with the US Dollar and US Treasuries, which are both major reserve and safe-haven assets. When the Dollar depreciates, Gold tends to rise, enabling investors and central banks to diversify their assets in turbulent times. Gold is also inversely correlated with risk assets. A rally in the stock market tends to weaken Gold price, while sell-offs in riskier markets tend to favor the precious metal.
The price can move due to a wide range of factors. Geopolitical instability or fears of a deep recession can quickly make Gold price escalate due to its safe-haven status. As a yield-less asset, Gold tends to rise with lower interest rates, while higher cost of money usually weighs down on the yellow metal. Still, most moves depend on how the US Dollar (USD) behaves as the asset is priced in dollars (XAU/USD). A strong Dollar tends to keep the price of Gold controlled, whereas a weaker Dollar is likely to push Gold prices up.