The prices of most of the coins keep falling, according to CoinStats.
SOL chart by CoinStats
SOL/USD
The price of Solana (SOL) has declined by 4% over the last day.
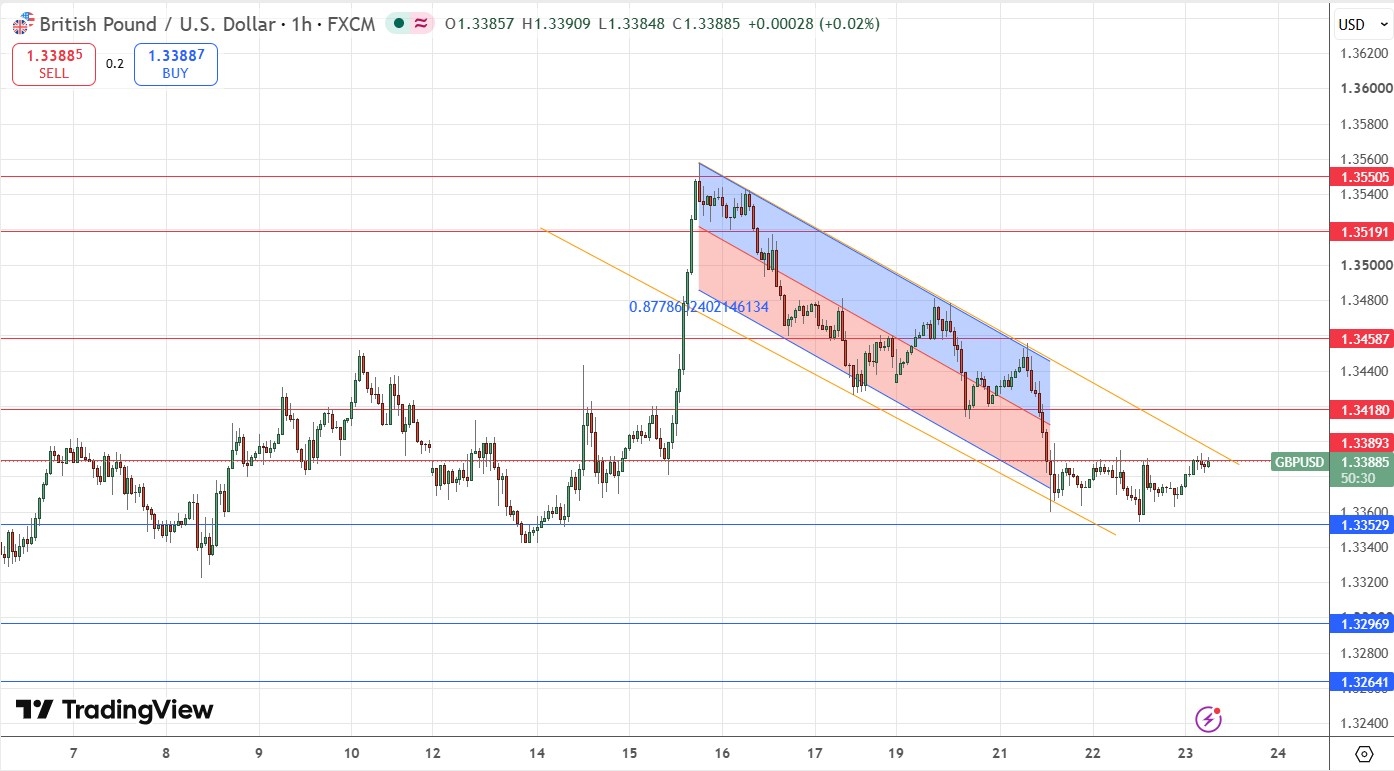
Image by TradingViewOn the hourly chart, the rate of SOL is in the middle of the local channel, between the support of $118.47 and the resistance of $127.33.
As most of the daily ATR has been passed, there are low chances to expect any sharp ups or downs by the end of the day.
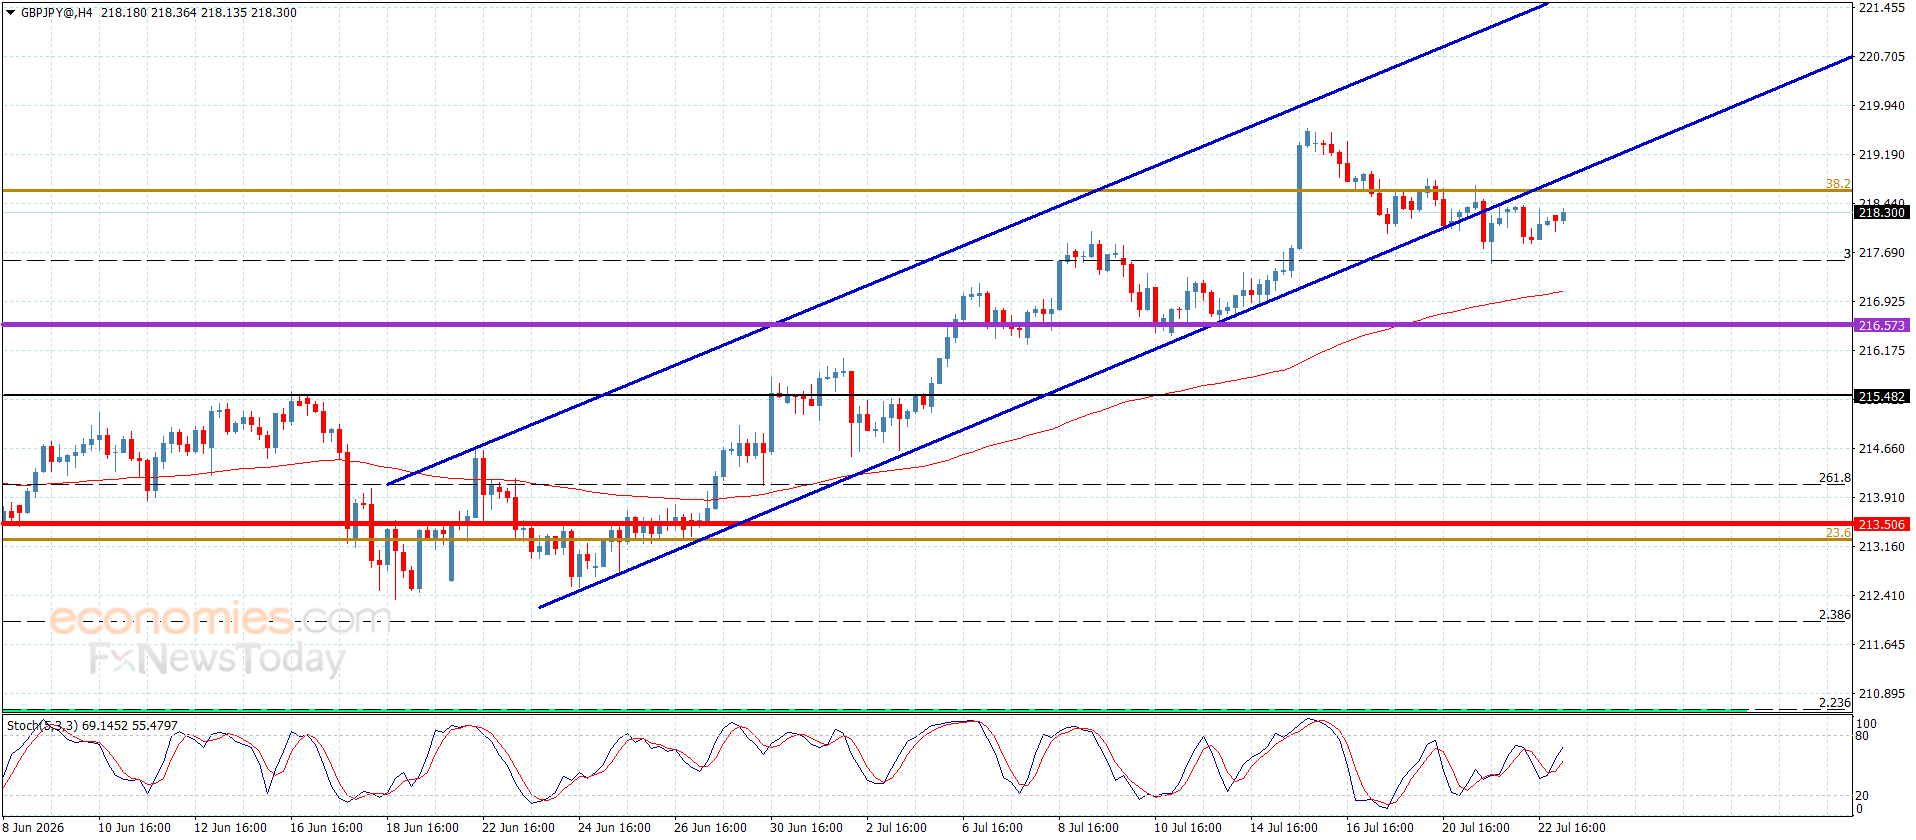
Image by TradingViewOn the bigger time frame, traders should focus on the bar’s closure in terms of yesterday’s low at $121.21. If a false breakout happens, one can expect a bounce back to the $130 zone within the next few days.
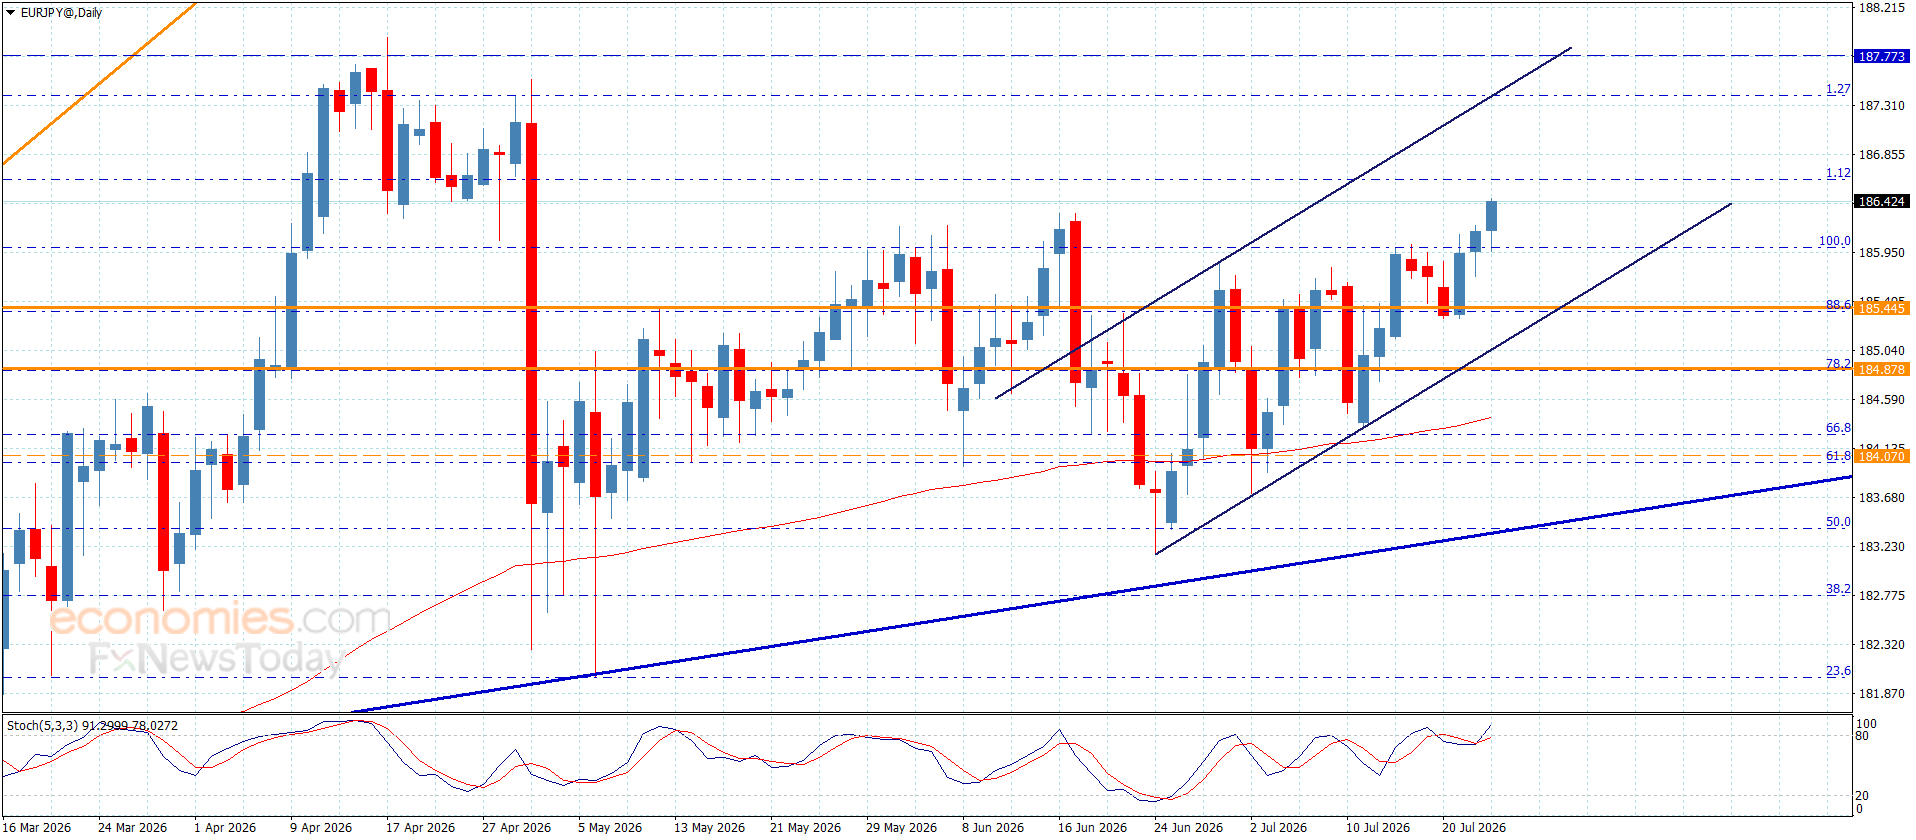
Image by TradingViewOn the weekly chart, there are no reversal signals yet. The price of SOL is approaching the recently formed level of $116. If buyers cannot seize the initiative by the end of the week, the accumulated energy might be enough for a move to the crucial zone of $100.
SOL is trading at $122.43 at press time.
About the author
Denys Serhiichuk
With more than 5 years of trading, Denys has a deep knowledge of both technical and fundamental market analysis. Mainly, he has started his blog on TradingView where publishes all relevant information and makes predictions about top coins.
Thus, his experience is backed up by working in top blockchain related companies such as W12, Platinum Listing, ATB Coin, and others, can be contacted at denys.serhiichuk@u.today.
Source link


.jpeg)