

Category: Crypto News, News
Is $130 Support Level the Next Target for SOL?
This decrease in value has resulted in a market cap reduction to approximately $70.85 billion, positioning it at the fifth rank among cryptocurrencies.
The 24-hour trading volume for Solana surged by 65%, reaching $2.41 billion, suggesting significant market activity despite the overall price drop.
Solana Price Prediction: Is a Bullish Momentum on the Horizon for SOL?
Over the past week, Solana price has seen a descending trend, with significant bearish pressure pushing the value lower. This decline has been marked by lower highs and lower lows, indicating a consistent downward momentum.
SOL price has been trading in a range of $175 to $153, struggling to find a stable support level. This downtrend has resulted in a decrease of more than 7% in the past seven days, reflecting growing concerns among investors
Solana Mainnet Beta v1.18.15 Upgrade and Validator Response
Solana has launched Mainnet Beta v1.18.15, urging validators to upgrade for improved network stability. The new version introduces several fixes, including an optional central scheduler functionality to resolve performance issues during network congestion.
According to Solana Beach, a validator statistics page, over 38% of the network’s validators have already transitioned to this update. This upgrade is part of Solana’s ongoing efforts to enhance network performance and ensure reliable operations.
Validators on Solana Beach are encouraged to adopt this version promptly to benefit from its improved stability and performance enhancements.

Technical Indicators and Potential Price Movements
With the current market correction, the Solana price prediction shows that the competitive token could potentially breach the $160 resistance level, signaling a revival of bullish momentum. This movement might push the cryptocurrency towards $170.
If SOL maintains this upward trajectory, it could set the stage for a potential approach to the $200 resistance level in the near future.
On the other hand, if bearish pressures increase, SOL’s price might drop to the $140 support level. If sellers continue to dominate the market, the price could further descend to the lower $130 support zone, potentially marking a bearish turn in the market.
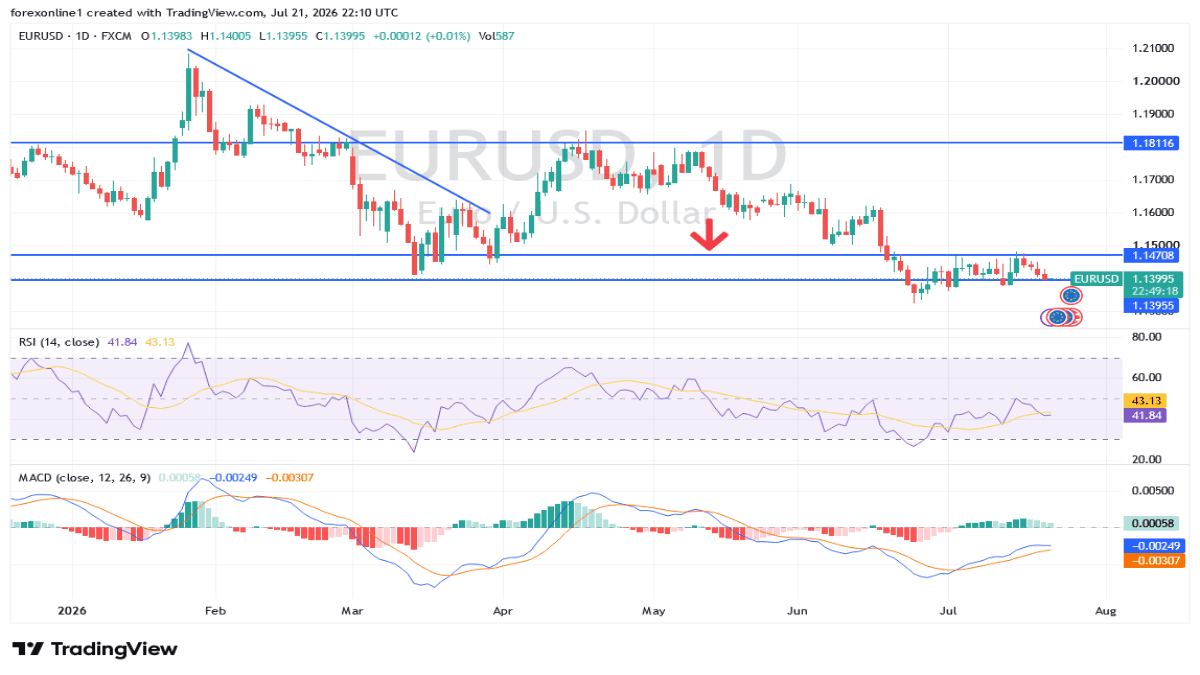
The daily technical indicators for Solana show a bearish trend in the market. The Relative Strength Index (RSI) is at 41, indicating that the asset is approaching the oversold territory.
Moreover, the Moving Average Convergence Divergence (MACD) indicates a bearish crossover. The MACD line is at -0.42, while the signal line is at 1.64, further supporting the downward momentum.
The Bollinger bands on the daily chart show a bearish trend with the upper band at $165, while the lower band holds at $154. Solana is trading slightly below the lower band, indicating potentially oversold conditions.
Related Articles


Written by : Editorial team of BIPNs
Main team of content of bipns.com. Any type of content should be approved by us.


Share this article: