

Category: Forex News, News
The 200-day SMA holds the downside…for now
You have reached your limit of 5 free articles for this month.

Take advantage of the Special Price just for today!
Only $9.99 on your first month! And access to all our articles and insights. Your coupon code
UNLOCK OFFER
- EUR/USD met a decent resistance near 1.0860 so far.
- The decent recovery in the Dollar kept the pair under pressure.
- Chief Powell’s testimony fell on the cautious side.
The US Dollar (USD) regained further upside impulse on Tuesday, prompting the USD Index (DXY) to trespass the 105.00 hurdle amid a generalized risk-off sentiment in the FX world.
This recovery in the Greenback triggered extra selling pressure on EUR/USD, pushing it back to the 1.0800 neighbourhood as market participants digested the first semi-annual testimony by Chief Jerome Powell before Congress, where he once again reiterated that the Committee needs to see further progress on inflation heading towards the Federal Reserve’s (Fed) 2% goal before starting to reduce its interest rates. That said, Powell gave no indication whatsoever of the potential timing of an interest rate reduction.

Following Powell’s testimony, the macroeconomic environment remained relatively stable on both sides of the Atlantic.
The European Central Bank (ECB) is considering further rate cuts beyond the summer, with market expectations pointing to two additional cuts by the end of the year. Conversely, there is still debate among investors about whether the Fed will implement one or two rate cuts this year, despite the bank’s current projection of a single cut, likely in December.
According to the CME Group’s FedWatch Tool, there is about a 74% chance of interest rate cuts in September, rising to nearly 96% by December.
The ECB’s rate cut in June, combined with the Fed’s decision to maintain rates, has increased the policy divergence between the two central banks. This divergence could potentially lead to further weakening of EUR/USD in the short term.
However, the prospects of economic recovery in the Euroland, coupled with the perceived cooling of some key US fundamentals, may mitigate this disparity and occasionally support the pair in the near future.
Looking ahead, the second testimony by Chair Jerome Powell, Fed speakers, and the release of US inflation figures measured by the CPI are expected to be key drivers for the pair’s price action in the very near term.
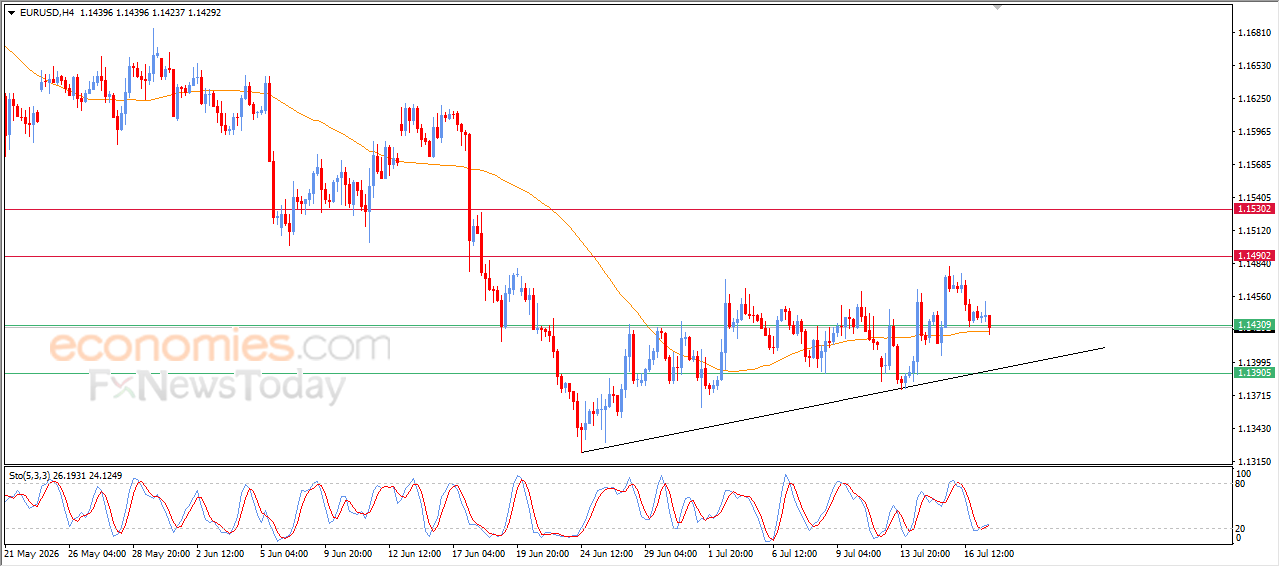
EUR/USD daily chart
EUR/USD short-term technical outlook
EUR/USD is expected to target the July peak of 1.0845 (July 8), followed by the weekly high of 1.0852 (June 12) and the June top of 1.0916 (June 4). If the pair breaks above this level, it may bring the March peak of 1.0981 (March 8) back into focus, seconded by the weekly high of 1.0998 (January 11) and the psychological 1.1000 barrier.
If bears regain control, spot may confront the 200-day SMA at 1.0798 prior to its June low of 1.0666 (June 26). Down from here emerges the May low of 1.0649 (May 1), and ultimately to the 2024 bottom of 1.0601 (April 16).
Looking at the larger picture, more gains appear to be on the horizon if the critical 200-day SMA (1.0797) is routinely surpassed.
So far, the 4-hour chart indicates the resumption of the downward bias. The initial support comes at the 200-SMA at 1.0783 ahead of the 55-SMA of 1.0767 and then 1.0709. On the upside, initial hurdle aligns at 1.0845 closely followed by 1.0852 and the 1. 0902.The Relative Strength Index (RSI) has dropped to around 51.
- EUR/USD met a decent resistance near 1.0860 so far.
- The decent recovery in the Dollar kept the pair under pressure.
- Chief Powell’s testimony fell on the cautious side.
The US Dollar (USD) regained further upside impulse on Tuesday, prompting the USD Index (DXY) to trespass the 105.00 hurdle amid a generalized risk-off sentiment in the FX world.
This recovery in the Greenback triggered extra selling pressure on EUR/USD, pushing it back to the 1.0800 neighbourhood as market participants digested the first semi-annual testimony by Chief Jerome Powell before Congress, where he once again reiterated that the Committee needs to see further progress on inflation heading towards the Federal Reserve’s (Fed) 2% goal before starting to reduce its interest rates. That said, Powell gave no indication whatsoever of the potential timing of an interest rate reduction.
Following Powell’s testimony, the macroeconomic environment remained relatively stable on both sides of the Atlantic.
The European Central Bank (ECB) is considering further rate cuts beyond the summer, with market expectations pointing to two additional cuts by the end of the year. Conversely, there is still debate among investors about whether the Fed will implement one or two rate cuts this year, despite the bank’s current projection of a single cut, likely in December.
According to the CME Group’s FedWatch Tool, there is about a 74% chance of interest rate cuts in September, rising to nearly 96% by December.
The ECB’s rate cut in June, combined with the Fed’s decision to maintain rates, has increased the policy divergence between the two central banks. This divergence could potentially lead to further weakening of EUR/USD in the short term.
However, the prospects of economic recovery in the Euroland, coupled with the perceived cooling of some key US fundamentals, may mitigate this disparity and occasionally support the pair in the near future.
Looking ahead, the second testimony by Chair Jerome Powell, Fed speakers, and the release of US inflation figures measured by the CPI are expected to be key drivers for the pair’s price action in the very near term.
EUR/USD daily chart
EUR/USD short-term technical outlook
EUR/USD is expected to target the July peak of 1.0845 (July 8), followed by the weekly high of 1.0852 (June 12) and the June top of 1.0916 (June 4). If the pair breaks above this level, it may bring the March peak of 1.0981 (March 8) back into focus, seconded by the weekly high of 1.0998 (January 11) and the psychological 1.1000 barrier.
If bears regain control, spot may confront the 200-day SMA at 1.0798 prior to its June low of 1.0666 (June 26). Down from here emerges the May low of 1.0649 (May 1), and ultimately to the 2024 bottom of 1.0601 (April 16).
Looking at the larger picture, more gains appear to be on the horizon if the critical 200-day SMA (1.0797) is routinely surpassed.
So far, the 4-hour chart indicates the resumption of the downward bias. The initial support comes at the 200-SMA at 1.0783 ahead of the 55-SMA of 1.0767 and then 1.0709. On the upside, initial hurdle aligns at 1.0845 closely followed by 1.0852 and the 1. 0902.The Relative Strength Index (RSI) has dropped to around 51.


Written by : Editorial team of BIPNs
Main team of content of bipns.com. Any type of content should be approved by us.


Share this article: