The Dollar Index (DXY) is currently trading at $104.328, up 0.07%. On the 4-hour chart, the pivot point is $104.238. Immediate resistance levels are $104.432, $104.530, and $104.663.
Support levels are $104.050, $103.909, and $103.782. The 50-day EMA stands at $104.472, while the 200-day EMA is $104.998. A bullish outlook is maintained above the pivot point of $104.238, with potential upward movement toward the resistance levels.
Conversely, a break below $104.238 could initiate a significant selling trend.
EUR/USD Technical Forecast
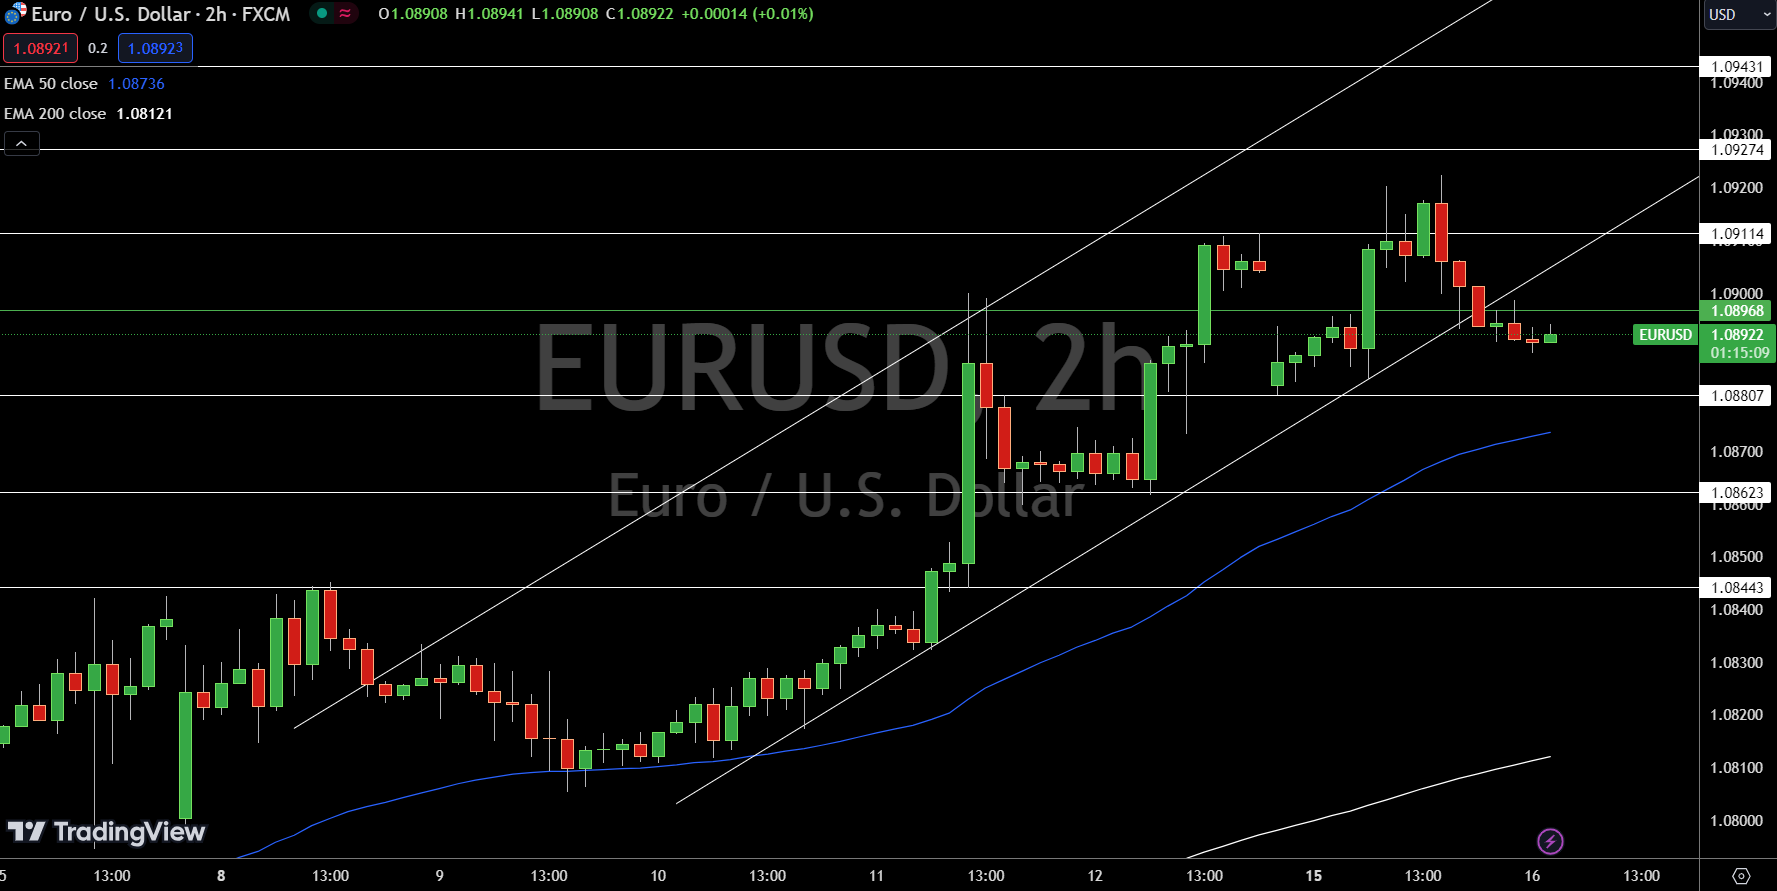
EUR/USD Price Chart – Source: Tradingview
The EUR/USD is trading at $1.08922, down 0.02%. The 4-hour chart shows a pivot point at $1.08968. Immediate resistance levels are $1.09114, $1.09274, and $1.09431. Support levels are at $1.08807, $1.08623, and $1.08443.
The 50-day EMA is $1.08736, and the 200-day EMA is $1.08121. A bearish outlook prevails below the pivot point of $1.08968, suggesting further declines if the level is breached.
Conversely, a break above this pivot point could shift sentiment towards a bullish bias.