
Category: Forex News, News
EUR/USD, GBP/USD, DXY Price Forecast: DXY Hits $103.75; Buy Now?
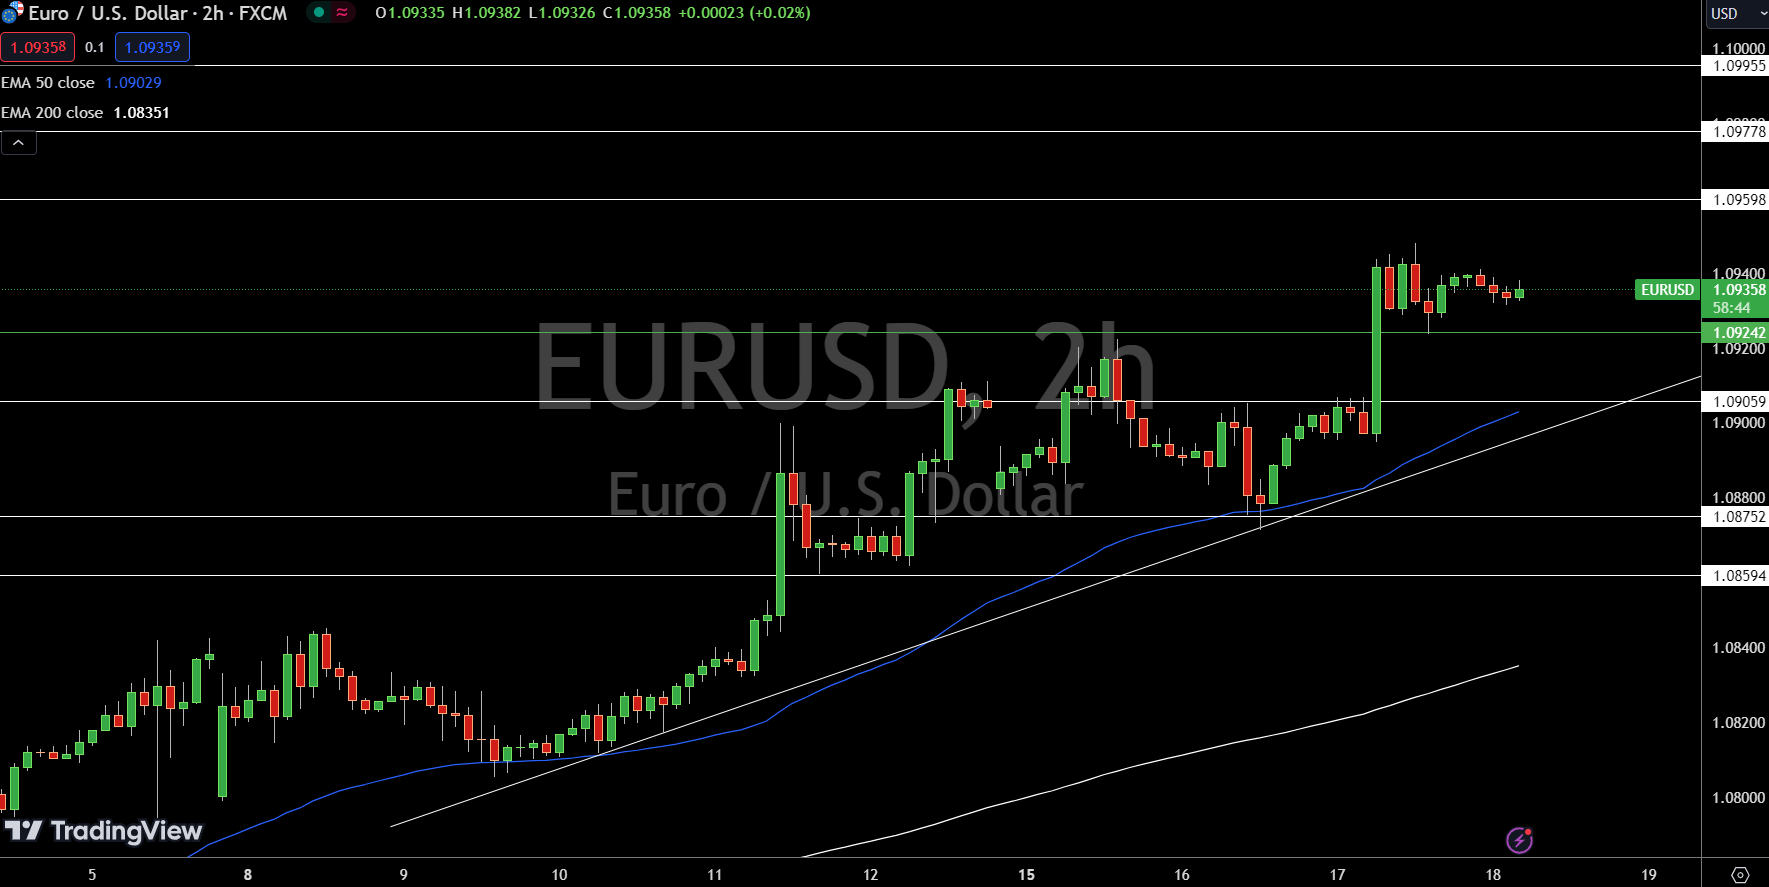
The EUR/USD currently trades at $1.09358, slightly down by 0.05%. Key levels to watch include the pivot point at $1.09242. Immediate resistance levels are identified at $1.09598, $1.09778, and $1.09955, which may cap any upside movement. On the downside, immediate support levels are $1.09059, $1.08752, and $1.08594.
Technical indicators are noteworthy, with the 50-day Exponential Moving Average (EMA) at $1.09029 and the 200-day EMA at $1.08351. These moving averages highlight the current trend dynamics.
A bullish outlook persists above the pivot point of $1.09242. However, a break below this level could trigger a sharp selling trend, leading to further declines.
GBP/USD Technical Forecast


Written by : Editorial team of BIPNs
Main team of content of bipns.com. Any type of content should be approved by us.


Share this article: