
Category: Forex News, News
XAG/USD could climb further, descending trend-line breakout in play
- Silver gains some follow-through traction and climbs to a nearly two-month top on Monday.
- The technical setup suggests that the path of least resistance for the XAG/USD is to the upside.
- Any meaningful corrective slide could be seen as a buying opportunity and remain cushioned.
Silver (XAG/USD) builds on its recent strong upward trajectory witnessed over the past week or so and climbs to a nearly two-month top on Monday. The white metal sticks to its intraday gains through the first half of the European session and currently trades just below the $31.00 mark, up 0.70% for the day.
Looking at the broader picture, Friday’s breakout through a short-term descending trend-line was seen as a fresh trigger for bullish traders. The subsequent move up, along with the fact that oscillators on the daily chart have just started gaining positive traction, suggests that the path of least resistance for the XAG/USD is to the upside and supports prospects for additional gains.
Hence, some follow-through strength towards testing the next relevant hurdle, around the $31.45-$31.50 supply zone, looks like a distinct possibility. The momentum could extend further towards reclaiming the $32.00 mark, above which the XAG/USD could climb back towards challenging a one-decade high, around mid-$32.00s touched in May.
On the flip side, the $30.50-$30.45 horizontal zone now seems to protect the immediate downside. Any further decline could be seen as a buying opportunity and remain cushioned near the aforementioned descending trend-line resistance breakpoint, now turned support, currently near the $30.00 psychological mark. The latter could act as a key pivotal point for short-term traders.
A convincing break below might prompt aggressive technical selling and make the XAG/USD vulnerable to accelerate the fall towards the $29.40-$29.35 region en route to the $29.00 round figure. Some follow-through selling might shift the bias in favor of bears and expose the $27.70 area, or the monthly low, with some intermediate support near the $28.20-$28.15 zone.
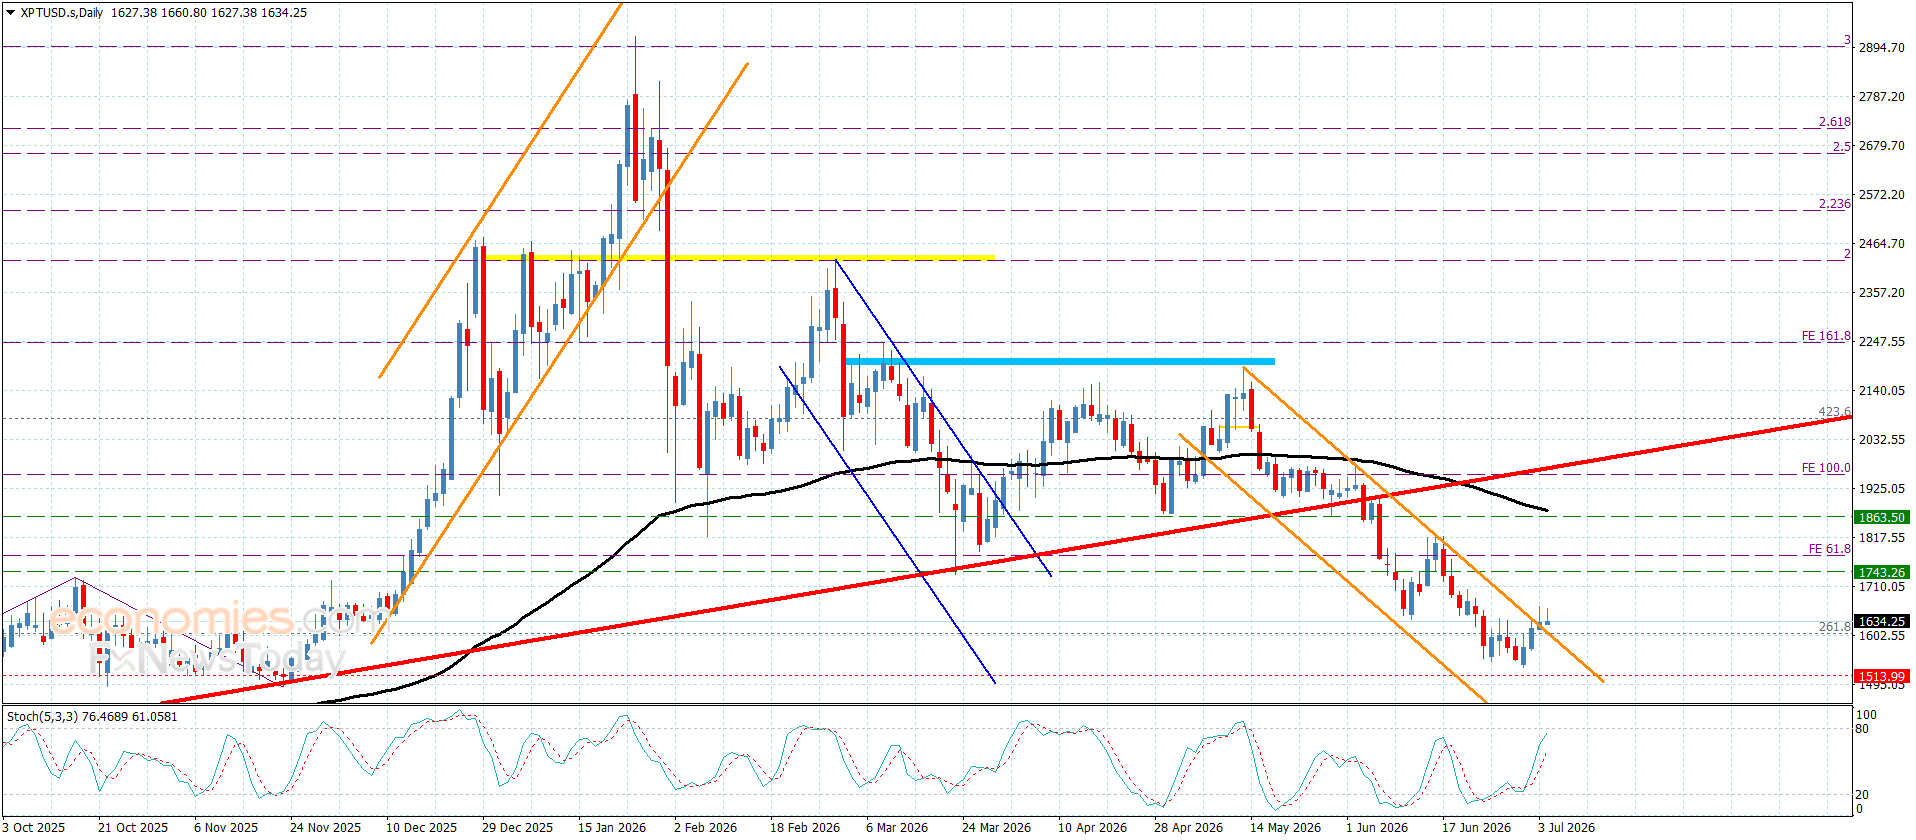
Silver daily chart
Silver FAQs
Silver is a precious metal highly traded among investors. It has been historically used as a store of value and a medium of exchange. Although less popular than Gold, traders may turn to Silver to diversify their investment portfolio, for its intrinsic value or as a potential hedge during high-inflation periods. Investors can buy physical Silver, in coins or in bars, or trade it through vehicles such as Exchange Traded Funds, which track its price on international markets.

Silver prices can move due to a wide range of factors. Geopolitical instability or fears of a deep recession can make Silver price escalate due to its safe-haven status, although to a lesser extent than Gold’s. As a yieldless asset, Silver tends to rise with lower interest rates. Its moves also depend on how the US Dollar (USD) behaves as the asset is priced in dollars (XAG/USD). A strong Dollar tends to keep the price of Silver at bay, whereas a weaker Dollar is likely to propel prices up. Other factors such as investment demand, mining supply – Silver is much more abundant than Gold – and recycling rates can also affect prices.
Silver is widely used in industry, particularly in sectors such as electronics or solar energy, as it has one of the highest electric conductivity of all metals – more than Copper and Gold. A surge in demand can increase prices, while a decline tends to lower them. Dynamics in the US, Chinese and Indian economies can also contribute to price swings: for the US and particularly China, their big industrial sectors use Silver in various processes; in India, consumers’ demand for the precious metal for jewellery also plays a key role in setting prices.
Silver prices tend to follow Gold’s moves. When Gold prices rise, Silver typically follows suit, as their status as safe-haven assets is similar. The Gold/Silver ratio, which shows the number of ounces of Silver needed to equal the value of one ounce of Gold, may help to determine the relative valuation between both metals. Some investors may consider a high ratio as an indicator that Silver is undervalued, or Gold is overvalued. On the contrary, a low ratio might suggest that Gold is undervalued relative to Silver.
Source link


Written by : Editorial team of BIPNs
Main team of content of bipns.com. Any type of content should be approved by us.


Share this article: