

Category: Forex News, News
XAU/USD consolidates near record highs as Fed looms
XAU/USD Current price: $2,572.12
- The Federal Reserve is about to announce its decision on monetary policy.
- A 25 basis points rate cut has been already priced in, but officials could still surprise markets.
- XAU/USD turned lower in the near term, the Fed will set the tone.
Gold hovers around $2,570 a troy ounce on Wednesday, unchanged on a daily basis as the Federal Reserve’s (Fed) monetary policy announcement looms. The United States (US) central bank is expected to trim interest rates for the first time in four years after pushing toward record highs amid soaring inflation in the pandemic aftermath. Policymakers are also weighing the effects of monetary restrictions on economic progress, but the market won’t hear that from them.
The Fed will also release the Summary of Economic Projections (SEP) with fresh forecasts for growth, inflation and unemployment and officials´ views on the future path for monetary policy. The latter could have a large impact on the US Dollar, as, ahead of the announcement, financial markets have already priced in a 25 basis points (bps) rate cut.

Generally speaking, the more dovish the event, the more will the US Dollar lose against its major rivals, while an unexpected hawkish outcome will likely have a larger impact amid the surprise factor, benefiting the American currency.
XAU/USD short-term technical outlook
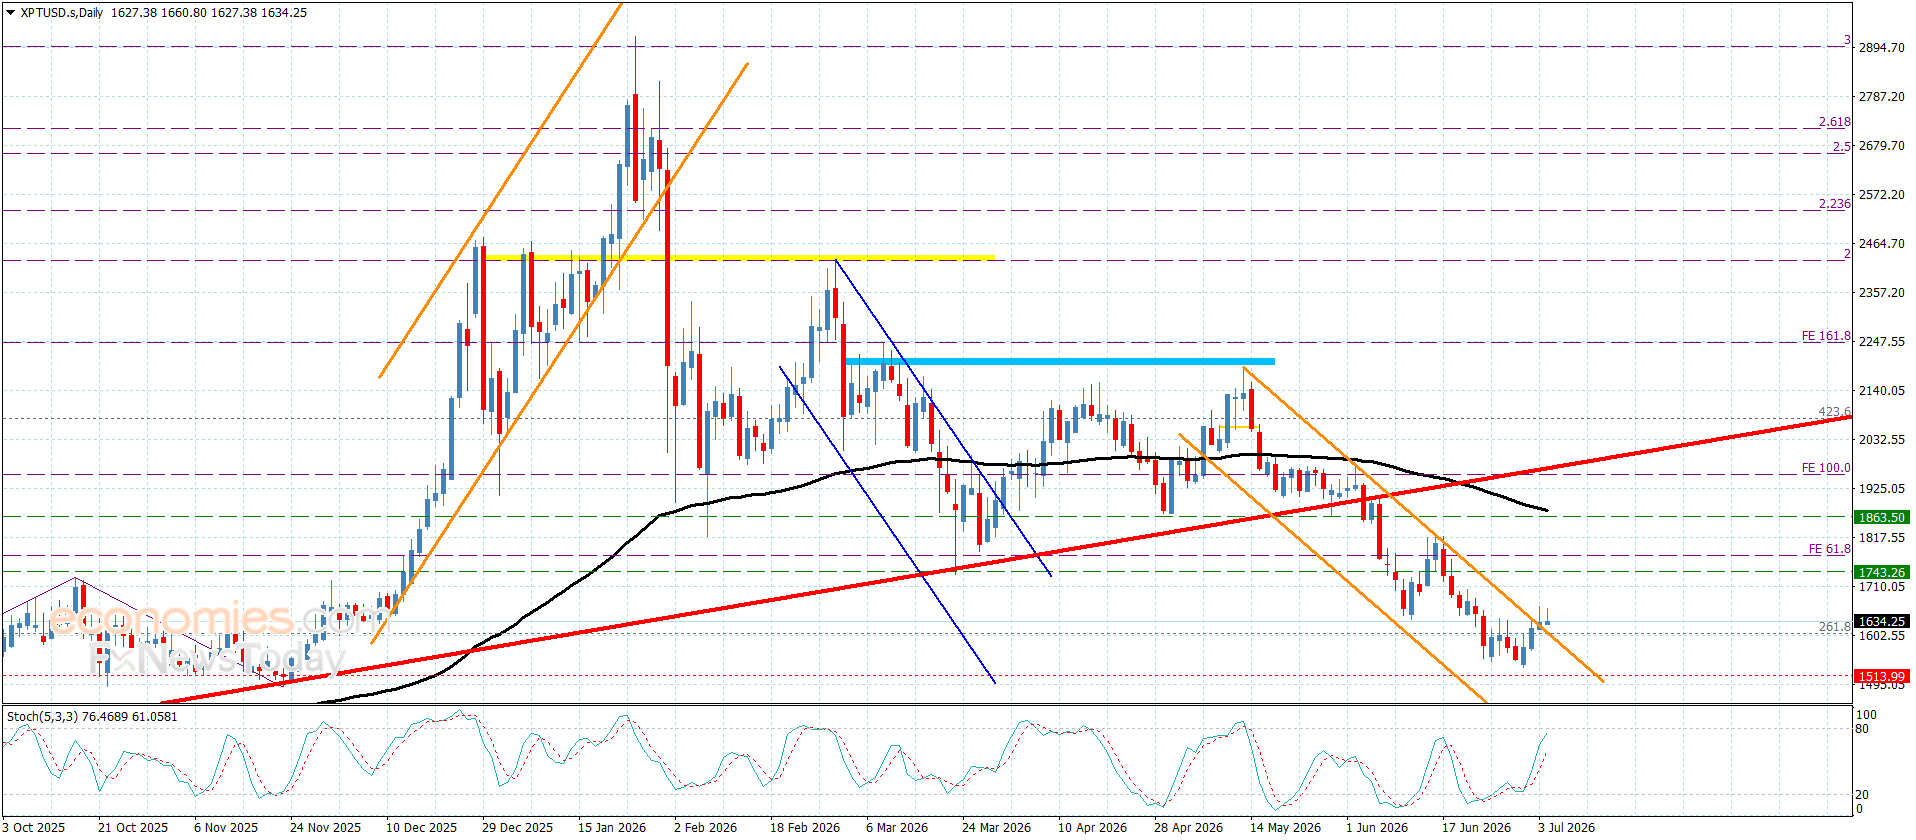
From a technical point of view, the daily chart for XAU/USD shows the risk skews to the upside. The pair holds near an all-time high of $2589.50 posted this week, while all moving averages aim higher, far below the current level. The closest one is the 20 Simple Moving Average (SMA), providing support in the $2,520 price zone. At the same time, technical indicators hold well above their midlines with uneven and limited directional strength.
In the near term, however, the risk leans to the downside. A directionless 20 SMA provides intraday resistance, rejecting advances. The 100 and 200 SMA have partially lost their upward strength, far below the current level. Finally, technical indicators aim lower, with the Momentum indicator accelerating lower below its 100 line.
Support levels: 2,561.65 2,550.00 2,542.40
Resistance levels: 2,574.80 2,590.00 2,605.00

Source link


Written by : Editorial team of BIPNs
Main team of content of bipns.com. Any type of content should be approved by us.


Share this article: