Category: Crypto News, News
Canary Capital files for XRP ETF
Ripple price today: $0.530
- Ripple hovers near $0.530 on Wednesday, technicals point to a decline ahead.
- Canary Capital has officially filed for an XRP ETF with the US SEC.
- XRP’s long-to-short ratio trades below one, suggesting a bearish move on the horizon.
Ripple (XRP) stabilizes around $0.530 on Wednesday after facing rejection from its daily resistance level on Monday. Canary Capital’s official filing for an XRP Exchange Traded Fund (ETF) with the US Securities and Exchange Commission (SEC) on Tuesday is generally a positive development. However, technical analysis and on-chain metrics indicate a potential short-term correction for Ripple.
Canary Capital files for Ripple ETF with US SEC
Canary Capital officially filed for an XRP ETF with the SEC on Tuesday, following a similar move by Bitwise last week. Despite ongoing regulatory challenges, ETF fillings by big investment companies are generally positive signs for Ripple in the long term, as an ETF can make it easier for traditional investors to gain exposure to XRP without needing to purchase and store the cryptocurrency directly. Moreover, approving an ETF could lend more legitimacy to XRP and increase liquidity.

However, Ripple’s on-chain metric from Coinglass hints at a short-term correction for XRP. Its long-to-short ratio trades at 0.9, the lowest level in one month. This ratio below one reflects bearish sentiment in the market, as more traders are betting on the asset price to fall. Other on-chain metrics, as seen in a previous article, also support the bearish scenario.
XRP long-to-short ratio chart. Source: Coinglass
Ripple Price Forecast: XRP faces rejection from resistance barrier
Ripple’s price stabilizes after breaking below an ascending trendline last week and being rejected from the daily resistance level of $0.544 on Monday. This daily level roughly coincides with the two crucial resistance levels: the 200-day EMA at $0.554 and the previously broken ascending trendline (drawn by connecting multiple lows since early July). At the time of writing on Wednesday, XRP/USDT trades at around $0.532.
If the $0.544 level continues to hold as resistance, XRP could decline over 19% from its current trading level to retest the August 5 low of $0.431.

The Relative Strength Index (RSI) indicator on the daily chart also trades below its neutral level of 50, indicating bearish momentum and continuing the downward trend.
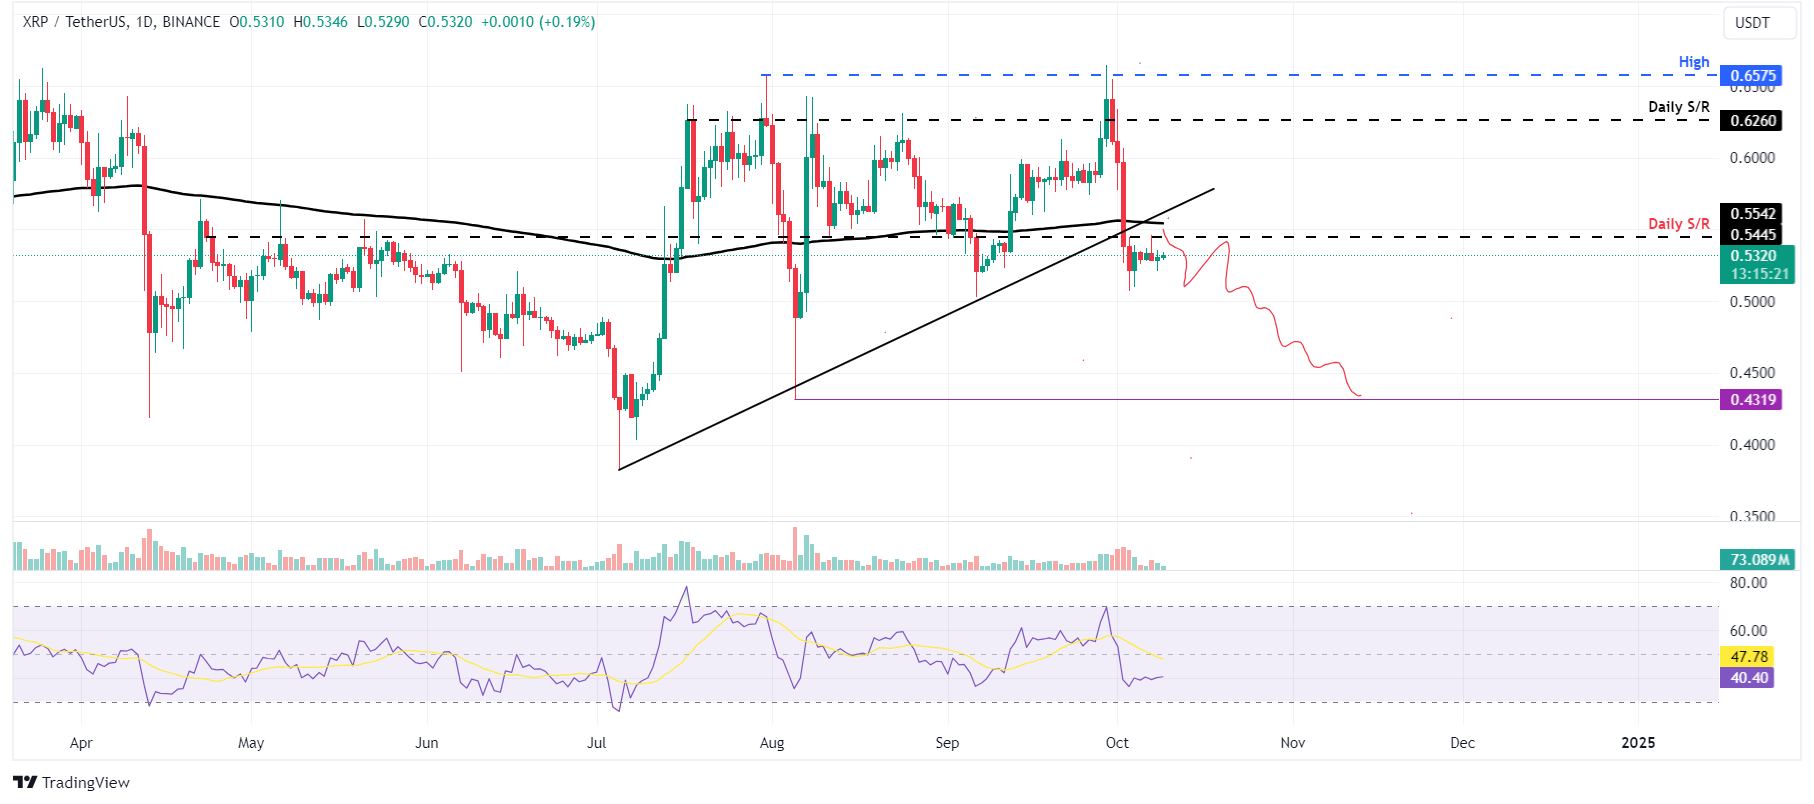
XRP/USDT daily chart
However, if XRP breaks and closes above the 200-day EMA at $0.554, it could extend the rise by 13% to retest its next daily resistance at $0.626.


Written by : Editorial team of BIPNs
Main team of content of bipns.com. Any type of content should be approved by us.


Share this article: