
Category: Crypto News, News
Can DOGE Surge To $0.29 If $0.13 Support Holds
Key Insights:
- Dogecoin is currently testing key resistance at $0.17 with $0.29 as a potential target if it holds above $0.13 support.
- An analyst noted a MACD bullish crossover on the 3-day chart, suggesting strong upward momentum for Dogecoin.
- Dogecoin technical analysis amid bullish indicators.
Dogecoin price is testing critical resistance at $0.17, while holding above its $0.13 support zone. If support remains intact, analysts project the price could reach $0.29 in the coming sessions.
Despite a drop in user activity, technical indicators suggest renewed bullish sentiment. MACD crossover and support trendlines point to potential gains, though momentum remains fragile.
Dogecoin Price Testing Resistance Levels at $0.17
Crypto analyst Ali Martinez has predicted an optimistic movement from Doge price in the upcoming week. The analyst noted that the $0.17 resistance and $0.13 support levels stand as the most important points to monitor.
He added that a price break above $0.17 could trigger DOGE to rise up to $0.21 before reaching potentially as far as $0.29 according to this analysis.
In addition, the analyst stated that maintaining the $0.13 support is crucial because this level is vital to sustain the bullish pattern. A decline below this level may signal a potential for a downtrend yet holding this support may lead to a price increase.
The chart has also shown a rising trendline, indicating that the broader market sentiment for DOGE remains generally positive, and any dip would likely be short-lived if the support holds.
MACD Bullish Crossover Signals Upward Momentum
Another analyst, Trader Tardigrade identified a key technical indicator throughout Dogecoin price movements that includes a 3-day MACD bullish crossover pattern. The technical indicator stands as one of the most widely used instruments to identify market directional shifts.
Market analysts acknowledge bullish crossover patterns whenever MACD crosses above the signal line since they signify upward price movements.

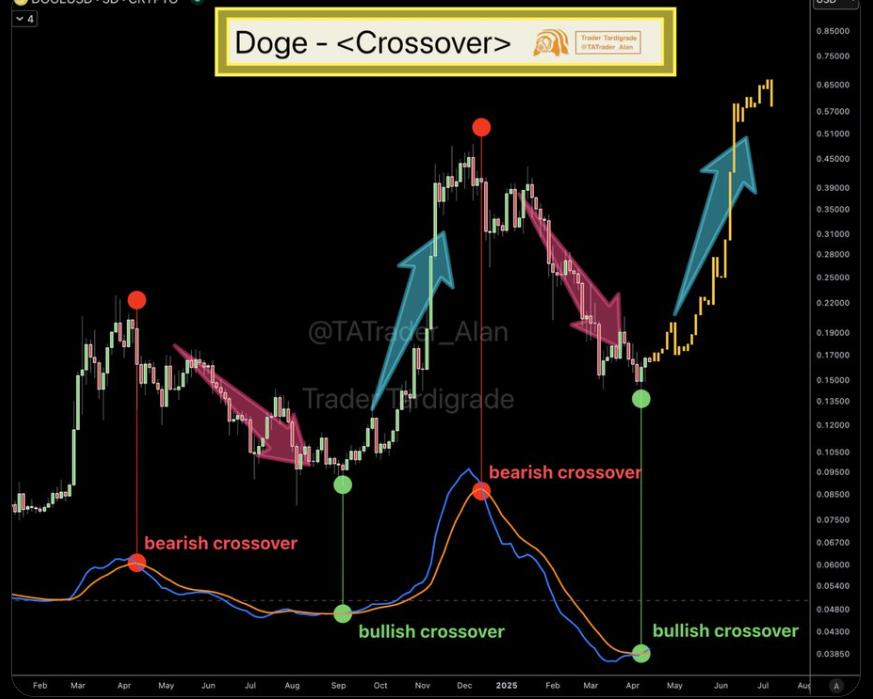
Besides, the current bullish crossover pattern is a sign that Dogecoin price has potential to continue rising. The MACD indicator often precedes price movements, and similar crossovers in the past have been followed by significant price increases.
On-Chain Data Points to Declining Engagement
Dogecoin saw a sharp drop in user activity, with daily active addresses down 98% from Dec. 2024 levels. This decline contrasts with bullish technical setups, reflecting cautious sentiment.

Still, some forecasts suggest DOGE could reach $5 if user engagement returns to 100 million daily users. That scenario remains speculative, with current trends not supporting such adoption levels yet.
As of writing, DOGE trades at $0.1658, up 0.59% in 24 hours. The 24-hour volume stands at $954.45 million, while its market cap is $24.69 billion.
Disclaimer
This article is for informational purposes only. Crypto investment involves inherent risks due to the volatility in price. Readers should conduct their research before making any investment decision. Also, you can consult a crypto expert before investing in cryptocurrencies.


Written by : Editorial team of BIPNs
Main team of content of bipns.com. Any type of content should be approved by us.


Share this article: