

Category: Forex News, News
Natural Gas Price Forecast: Rally Nears Breakout Point Amid Rising Momentum
Bullish Price Action
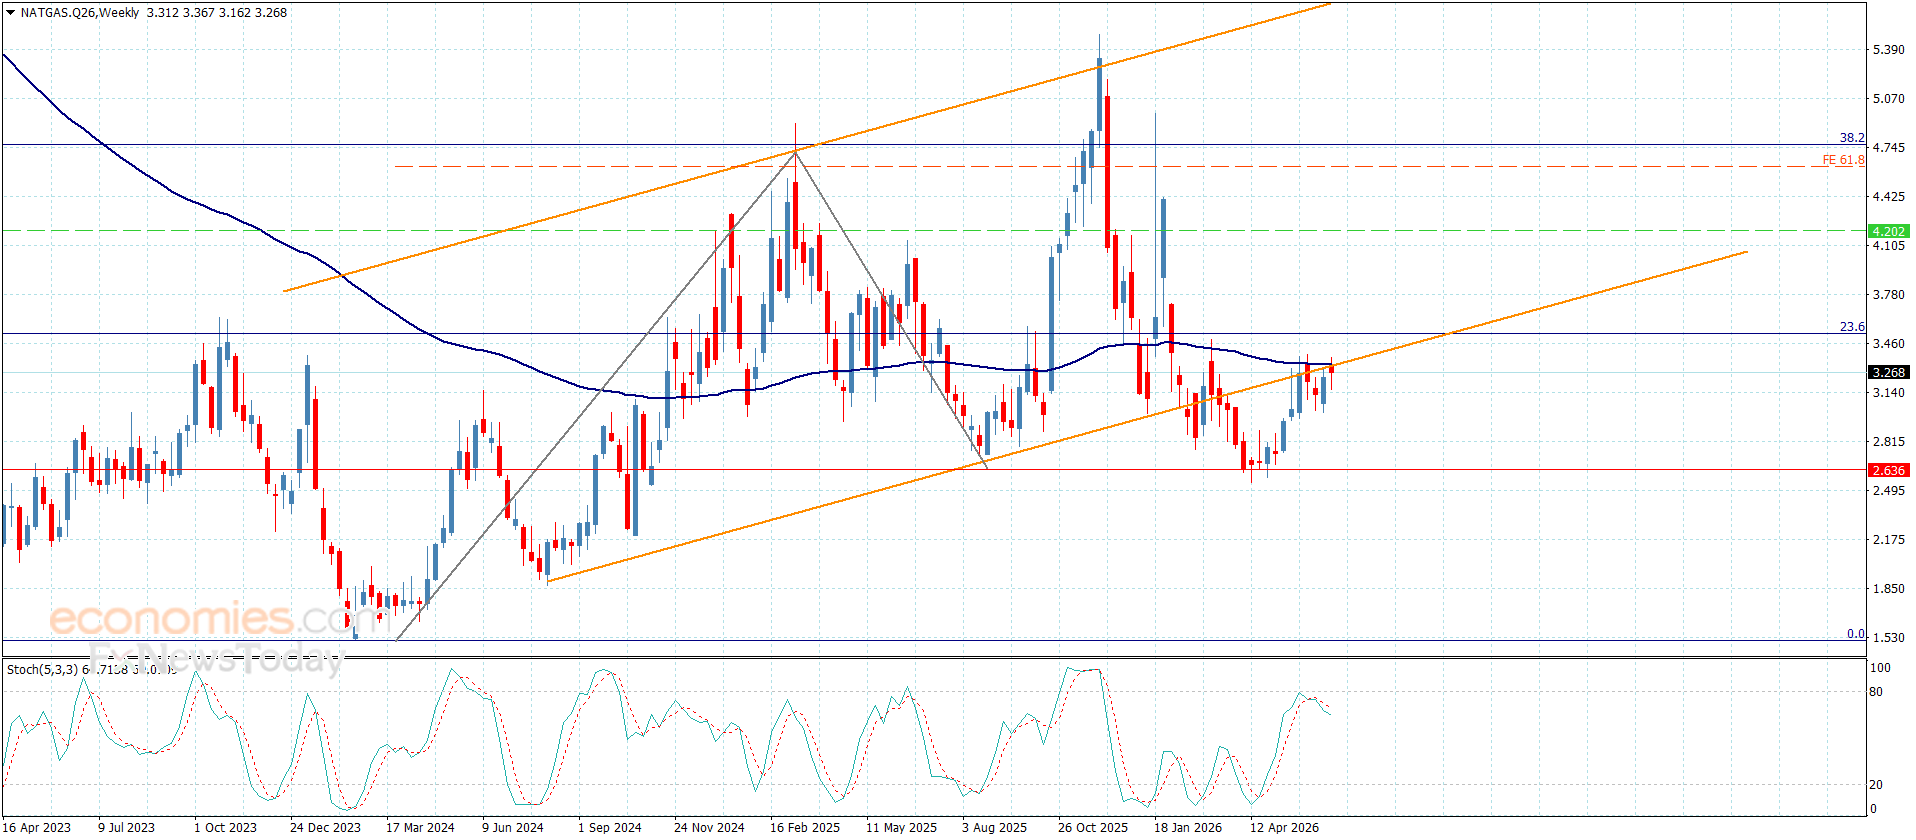
Today’s bullish price action represents a likely completion to the short three-day consolidation that followed Monday’s strong advance. It puts natural gas in a position to again challenge a resistance zone that was tested during four of the past five weeks. It is identified by weekly highs from $3.82 to $3.84 (B). The high price was the most recent swing high that led to a pullback. This behavior shows strong resistance. But if it is broken to the upside, a trend continuation signal is triggered and the continuation of the rising ABCD pattern, measured from the April low (A).
Signs of Strength
Nonetheless, since there have been signs of strong resistance and there is a large consolidation range above (head and shoulders top), until there is a decisive upside breakout there remains a risk that a bearish reversal could occur. Currently, that possibility would become more likely on a decline below today’s low. An initial potential support zone is at $3.52 currently, which is the convergence of the 20-Day and 50-Day MAs, therefore adding significance to the price zone.

Bull Breakout Above $3.84
Nonetheless, if an upside breakout triggers above $3.84, the next decision point looks to be an upside target zone from $4.08 to $4.12, consisting of the initial target from a rising ABCD pattern and the 61.8% Fibonacci retracement, respectively. Since the two levels are relatively close together, they could act like a magnet for price following a confirmed upside breakout. Confirmation would occur on a daily close above the price level.
Trend Points to Higher Prices
Notice that a swing low of $2.86 was established at the end of the bearish correction that followed the trend high of $4.90 in March. The subsequent advance from that low established a higher angle of ascent for the long-term trend, relative to the lower purple trendline that connects to the August 2024 swing low. This shows improving momentum and is supportive of a potential bull breakout and move for the price of natural gas.
For a look at all of today’s economic events, check out our economic calendar.
Source link


Written by : Editorial team of BIPNs
Main team of content of bipns.com. Any type of content should be approved by us.


.webp)

Share this article: