
Category: Crypto News, News
XRP Price Prediction: XRP Begins August With a Dip, but Divergence Signals a Surprise Upside
XRP kicked off August with a dip below the $3 mark, but bullish technical signals suggest the crypto asset could be on the verge of a sharp 20% rebound.
After falling nearly 16% from its mid-July high, Ripple’s XRP is showing early signs of a potential turnaround. Chart patterns hint at fading selling pressure and increasing buyer interest, even as broader market sentiment remains mixed. With key support levels holding firm, analysts are watching closely to see if XRP can capitalize on its bullish divergence and reclaim momentum this month.

XRP Faces Pressure Below $3.00 as Market Sentiment Cools
XRP opened the month of August with a modest pullback, dipping to an intraday low of $2.89 before recovering slightly above the $3.00 level. The broader crypto market downturn weighed on sentiment, causing Ripple’s XRP to drop nearly 16% from its recent peak of $3.66, reached on July 18. Despite the dip, analysts note that this decline comes with signs of weakening bearish momentum—offering hope for a potential rebound.
XRP was trading at around $3, up 1.64% in the last 24 hours at press time. Source: XRP Liquid Index (XRPLX) via Brave New Coin
One key signal lies in XRP’s low spot trading volume, which stood at approximately $168 million at the time of writing. The subdued volume reflects a seller exhaustion phase, meaning downward pressure could be losing steam. According to data from CryptoQuant’s XRP Spot Bubble Map, liquidity has significantly thinned out, with fewer buyers and sellers participating actively.
Low trading volume suggests that selling pressure may be easing, potentially paving the way for a bullish reversal if buying momentum increases.
Bullish Divergence Sparks Reversal Hopes
Technical analysis of XRP’s four-hour chart reveals a classic bullish divergence—a condition where the price makes lower lows while the Relative Strength Index (RSI) makes higher lows. This disconnect between price and momentum often indicates that the recent bearish trend is fading.

A potential bullish divergence is emerging on XRP’s 4-hour chart, signaling a possible trend reversal. Source: Cryptoinsightuk via X
Adding to the bullish setup is the formation of a Dragonfly Doji candlestick on the daily chart, characterized by a long lower wick and minimal upper shadow. Historically, this pattern has signaled a reversal, with XRP previously rallying 65% after a similar setup in April.
Crypto analyst Cryptoes emphasized that the $2.80–$2.95 support range remains a “make-or-break” level. Holding this support could pave the way for a sustained move higher.
Falling Wedge Pattern Could Trigger 20% Rally
Another encouraging signal is the appearance of a falling wedge pattern on XRP’s chart—a bullish reversal pattern that, if confirmed, could see XRP rally as much as 20% in the coming sessions.
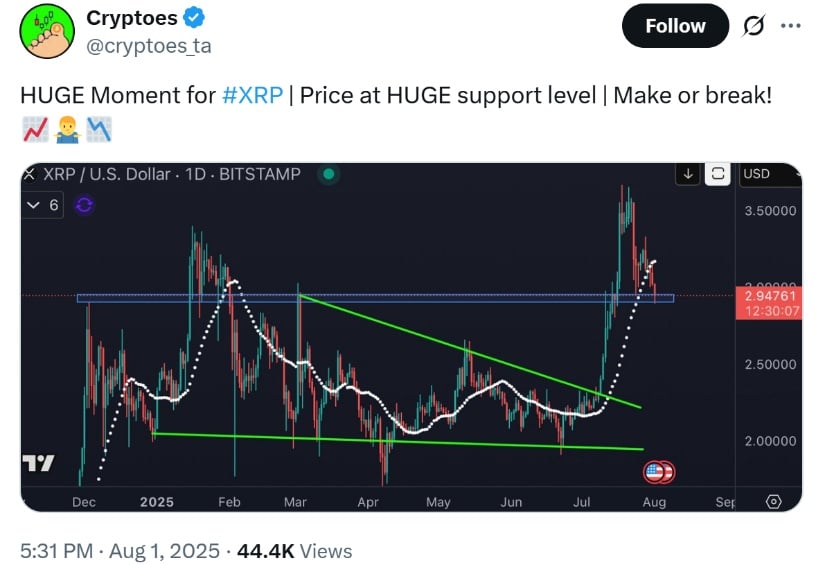
A descending triangle forming near $3.50 suggests consolidation, with TradingView analysis pointing to a potential +100% breakout rally fueled by strong bullish momentum. Source: Cryptoes via X
Currently trading around $2.98, XRP has already rebounded off the wedge’s lower trendline near the 200-period 4H EMA, a zone that provided strong demand. A breakout above the wedge’s upper resistance and the 0.236 Fibonacci retracement level near $3.07 could trigger a rally toward the $3.60–$3.65 range. If XRP breaks above the wedge resistance, a swift 20% surge could be on the table.
Derivatives Market: Liquidations Hint at Short Squeeze
In the derivatives segment, XRP has experienced significant liquidations totaling $41.4 million over the past 24 hours, with long positions accounting for $39 million of that sum, according to CoinGlass. These liquidations came amid a sharp drop in XRP price, suggesting traders betting on upside were caught off guard.
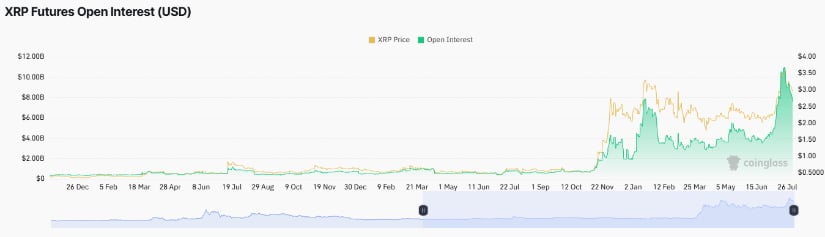
XRP Futures Open Interest (USD) chart. Source: Coinglass
Interestingly, this surge in long liquidations may set the stage for a short squeeze, particularly if XRP rebounds quickly. With open interest (OI) falling from a July peak of $10.94 billion to $8.13 billion, fewer leveraged bets are now in play—potentially reducing volatility and strengthening the base for a recovery.
Cautious Optimism Amid Mixed Indicators
While technical indicators such as the RSI and MACD show mixed signals, the overall structure leans neutral-to-bullish if XRP continues to defend key support levels. The MACD still flashes a sell signal, and RSI hovers below the midline, suggesting short-term consolidation may continue. However, a rise in speculative demand or positive Ripple news could quickly tilt momentum in favor of bulls.
Key levels to watch in the coming days include:
- Support: $2.76 (50-day EMA), $2.79–$2.95 zone
- Resistance: $3.07 (Fibonacci), $3.32 (swing high), and $3.65 (July peak)
Will XRP Go Up? Outlook Points to a Critical August
The question on many investors’ minds remains: Will XRP go up in August? Despite near-term pressure and overall market risk-off sentiment, several indicators suggest that XRP could reverse aggressively if technical breakout levels are breached.
Looking forward, XRP price predictions in 2025 remain bullish among long-term holders, especially if Ripple is able to gain clarity in its legal battles with the SEC. With the recent developments in the Ripple vs SEC lawsuit, including rumors of a possible XRP ETF, institutional interest in Ripple Labs and the XRP Ledger is a closely watched indicator.
As of the time of writing, XRP price today is hovering around the $3.00 mark. A successful break above this would confirm the bullish reversal and restore upside momentum in the coming weeks.


Written by : Editorial team of BIPNs
Main team of content of bipns.com. Any type of content should be approved by us.


.webp)
Share this article: