
Category: Crypto News, News
Solana Price Prediction: Bounce or Breakdown? All Eyes on the $170 Reclaim Level
Solana is testing a key demand zone near $160, as rising institutional futures activity and ETF momentum hint at a potential breakout ahead.
Solana might be gearing up for a major move, as fresh institutional demand collides with key technical support. Market participants are now eyeing the $150 to $160 zone closely, a region that once sparked a powerful rally.
Solana trading at around $158.07, down -3.38% in the last 24 hours. Source: Brave New Coin
Solana Futures Demand Surges Following ETF Momentum
Solana is kicking off August with a powerful data point, CME futures open interest has exploded to $800 million, up 370% from July’s $170 million. The chart shared by SolanaFloor reflects a dramatic shift in institutional appetite, coinciding with the first U.S.-approved Solana staking ETF. This spike puts CME ahead of other major exchanges like MEXC, CoinEx, and KuCoin, showing that traditional finance is now actively stepping into Solana’s ecosystem.

Solana CME futures open interest surges 370% in a month, signaling growing institutional appetite amid ETF momentum. Source: SolanaFloor via X
This sudden rise in futures exposure isn’t just about speculation; it’s about positioning. As open interest approaches previous cycle highs, market participants are anticipating more than just short-term volatility. With Solana trading near $160, institutional flows tied to ETF optimism could become a foundational driver for both spot and derivatives markets.

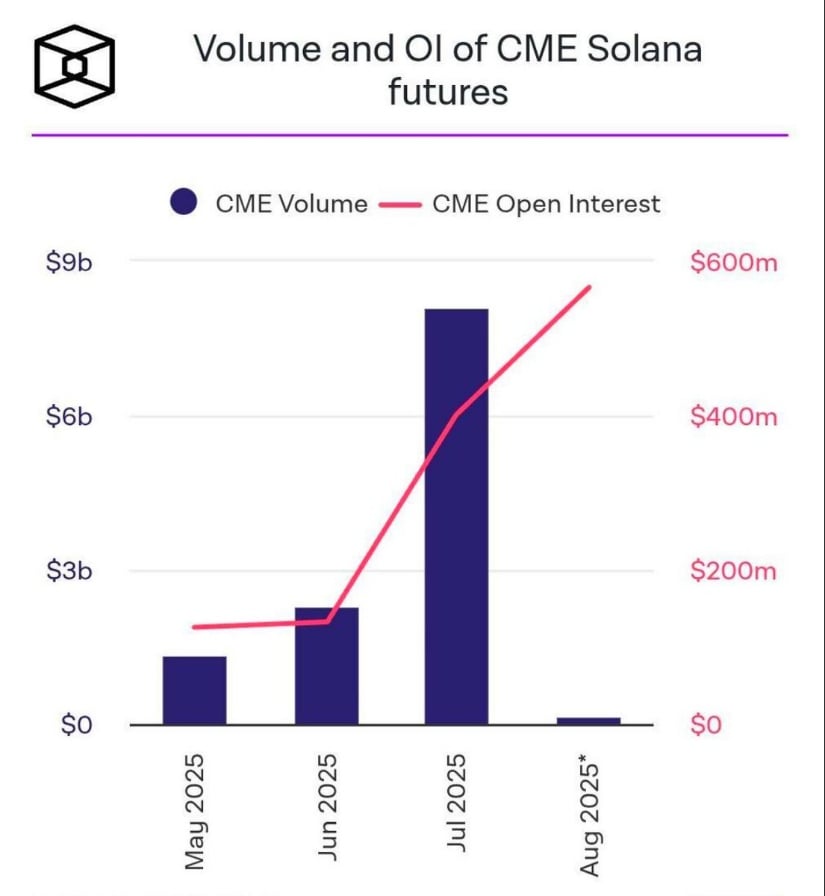
Solana’s CME futures open interest hits $800M. Source: SolanaFloor via X
Solana About to Enter Key Demand Zone
Solana’s price action is starting to align with the rising futures activity noted earlier. After topping out above $206, SOL has now corrected back into a familiar demand zone between $150 and $160, a region that previously acted as the launchpad for bullish reversals. The structure shown in the chart shared by BitGuru reveals a clear retracement phase, but one that’s still respecting prior breakout levels. Price is hovering just above the 0.618 Fibonacci zone from its last major leg up, which often serves as a reset point during uptrends.
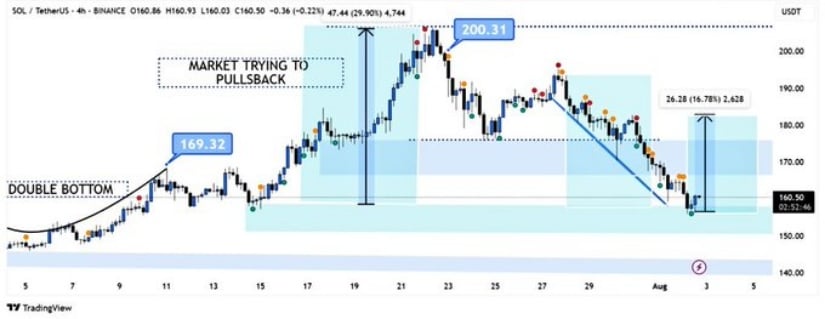
Solana revisits its $150 to $160 demand zone, hovering above the 0.618 Fib level in what could be a key setup for a bullish reversal. Source: BitGuru via X
If this level holds and a bounce follows, the technical setup favors a potential recovery leg with targets back towards $180. Past price reactions in this range, especially the mid-cycle double bottom, hint at buyers being ready to defend again.
Solana Technical Analysis
Solana is now testing the lower boundary of a well-defined parallel channel that’s been guiding its price action since April. As seen in the chart shared by The Boss, SOL is reacting to Bitcoin’s broader pullback but remains technically intact within its trend structure. The current level around $160 aligns with the base of this channel, as well as the 0.5 Fibonacci retracement zone from the recent $206 high. So far, this area has served as a reactive region that often halts deeper drawdowns.
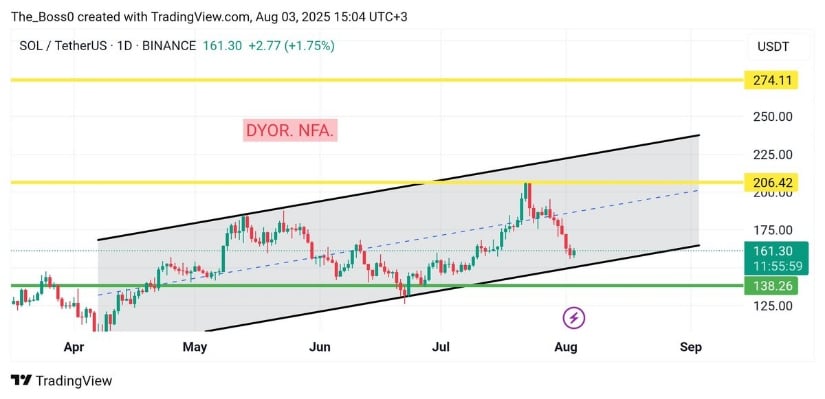
Solana tests the lower channel boundary near $160, with key resistances at $206 and $274 if the trend structure holds. Source: The Boss via X
If this lower boundary holds, the next visible resistance levels are marked near $206 and $274, which correspond with both the upper band of the channel and the 0.618 and 0.786 Fib zones. Given the recent surge in institutional futures activity, this chart reinforces the idea that current price action could just be a healthy consolidation phase within a larger trend.
Solana Liquidation Heatmap Highlights $170 Trigger Zone
Solana’s liquidity map is flashing a key short-term trigger level. According to CW8900’s latest chart, the largest concentration of liquidation sits just above $170.4, totaling $73.01 million in size. That pocket represents a cluster of over-leveraged short positions, meaning any decisive move above it could spark a wave of forced buys, essentially fueling a short squeeze.
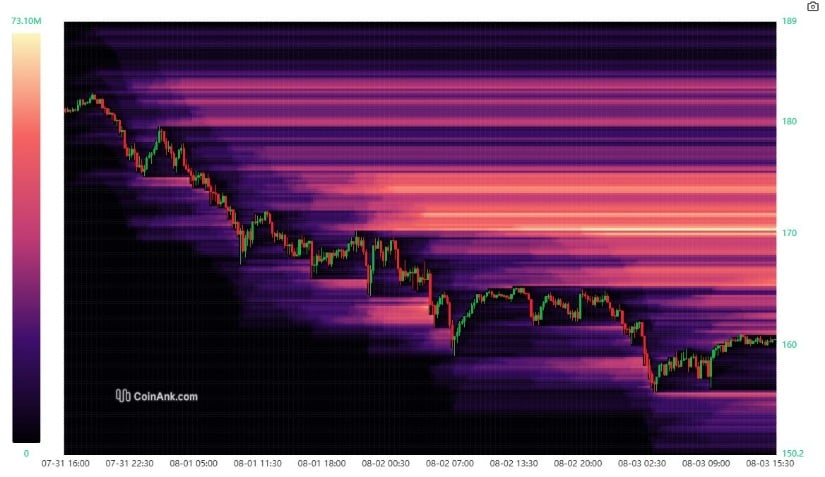
Solana’s liquidation heatmap shows $73M in shorts stacked above $170.4, setting the stage for a potential short squeeze. Source: CW8900 via X
In the context of the broader technical structure and rising ETF-driven futures demand, this $170 level becomes even more relevant. A reclaim of that zone would not only break local resistance but also position SOL back into breakout territory from the lower boundary of its channel.
Final Thoughts: Solana Price Prediction Hinges on Key Levels
Solana’s recent pullback into the $150 to $160 demand zone isn’t just another dip, it could be a critical retest. With institutional futures interest surging and ETF tailwinds still in play, this correction looks more like a technical cooldown than a full-blown reversal. If SOL holds this zone and reclaims the $170 liquidation trigger, we may see renewed bullish momentum, with $180 to $206 back on the table.
Looking ahead, the $170.4 short squeeze zone could act as the ignition point. Reclaiming that level not only shifts sentiment but also aligns with the broader channel and Fibonacci structure. Solana price prediction eyes a bullish move that could set the tone for August.

Written by : Editorial team of BIPNs
Main team of content of bipns.com. Any type of content should be approved by us.

.webp)

Share this article: