

Category: Forex News, News
Euro dips as strong US data tempers weekly gains
EUR/USD edges lower on Wednesday, trading around 1.1550 at the time of writing, down 0.10% on the day. The pair is consolidating after reaching a weekly high just below 1.1600, as the US figures published earlier in the day temporarily capped the bullish momentum seen earlier this week.
The latest data portray a US economy that is not weakening as quickly as previously suggested by earlier releases. Initial Jobless Claims came in at 216,000, beating expectations of 225,000, indicating the labor market is not deteriorating as sharply as feared. Meanwhile, US Durable Goods Orders rose 0.5% in September, above the 0.3% consensus, signaling resilience in manufacturing demand. These upside surprises helped the US Dollar Index (DXY) hold near 99.80, reversing the Euro’s (EUR) intraday advance.

Still, the numbers were not strong enough to shift the broader market narrative. Investors remain largely convinced that the Federal Reserve (Fed) will need to cut rates in December, a scenario still priced at over 80% according to the CME FedWatch tool, even after today’s data. Tuesday’s ADP report, which showed private-sector job losses over the four weeks ending November 8, continues to weigh on sentiment, while recent softness in consumption and consumer confidence reinforce expectations of an imminent policy pivot.
On the European front, support for the Euro remains modest. The European Central Bank (ECB) published its Financial Stability Review, highlighting elevated risks to financial stability in the Eurozone, particularly the vulnerability of Bond markets to high public debt in several member states. This, combined with the absence of any indication that the ECB is preparing to shift policy soon, limits the Euro’s ability to extend gains.
EUR/USD Technical Analysis
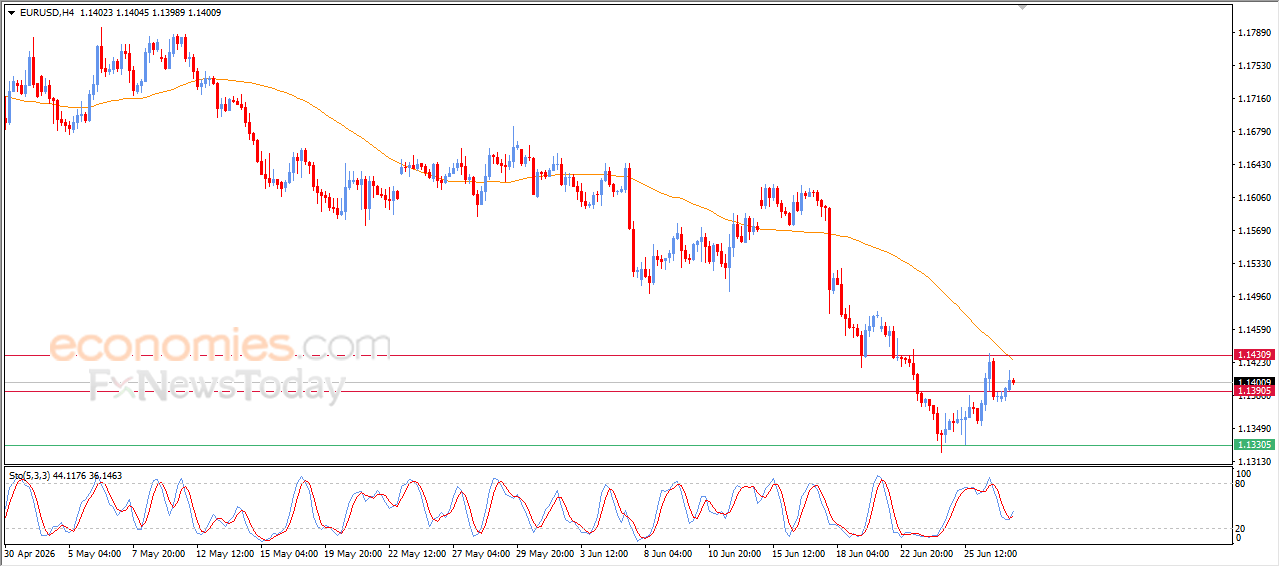
In the 4-hour chart, EUR/USD trades at 1.1549, down for the day and below the day open by 42 pips. The 100-period Simple Moving Average (SMA) slips to 1.1558, with price capped beneath it to maintain a bearish tone. The SMA’s gentle downward slope suggests persistent selling pressure. The Relative Strength Index (RSI) at 49.9 sits around the neutral line and softens, signaling fading upside momentum. A descending trend line from 1.1919 caps advances near 1.1599. Immediate support is seen at 1.1540, then at 1.1500, while resistance follows at 1.1650.
The 100-period SMA remains above price and points lower, keeping bears in control. A recovery above the average would ease pressure and could trigger a corrective bounce. RSI hovers near 50; a decisive push lower would tilt momentum bearish. On the upside, resistance is located at 1.1728, then at 1.1779, while a break under 1.1500 would expose support at 1.1470. Overall, the setup favors further downside unless buyers reclaim the moving average and extend beyond nearby resistance.
(The technical analysis of this story was written with the help of an AI tool)


Written by : Editorial team of BIPNs
Main team of content of bipns.com. Any type of content should be approved by us.


Share this article: