
Category: Forex News, News
Why Is Gold Crashing? How Low Can XAU/USD Chart Go and Gold Price Prediction 2026
Gold price is
in freefall. After spending the better part of 2026 consolidating near all-time
highs above $5,000, the yellow metal has lost approximately 6% in two
consecutive sessions, crashing through the psychologically critical $5,000
barrier on Wednesday and extending the decline to $4,700 per ounce on
Thursday, March 19, 2026, the lowest price since early February.
In this
article, I will break down the technical analysis of the XAU/USD, examine the
mechanics behind this week’s crash, and present the key gold price predictions
for 2026 , including where the real floor is if the selling continues. Based on
my 15 years of experience as an analyst and retail investor, here is what I am
watching.
Follow
me on X for real-time gold market analysis: @ChmielDk
Why Gold Is Crashing? The
Fed Pulled the Rug
Wednesday’s
FOMC decision was a hold, as expected – Polymarket had it at over 90%
probability and the market was fully prepared for no rate movement. What the
market was not prepared for was the hawkish tone of the dot
plot. The Fed trimmed its 2026 rate cut projections from two cuts to one,
citing hotter-than-expected producer inflation – February’s PPI came in
at +0.7%, well above consensus – and signalled that the Strait of
Hormuz-driven oil spike is creating inflation persistence that prevents easing.
The 10-year
Treasury yield jumped to 4.2%, the Dollar Index climbed toward 99.9, and gold –
a non-yielding asset whose entire bull thesis rested on falling real yields and
a weakening dollar – repriced accordingly.
As Dilin
Wu, Research Strategist at Pepperstone, frames it: “This sharp decline in
gold reflects a confluence of factors – large-scale risk asset liquidations, a
hawkish shift in Fed expectations, and a stronger dollar.” Crucially, he
views this as “a pricing logic adjustment rather than a reversal of the
long-term trend.”
The
technical break below the 50-day MA near $4,978 and below the $5,000
round level triggered momentum selling and profit-taking from a
crowded long, amplifying what was already a fundamental repricing.
The irony
noted by my earlier
gold analysis remains
fully applicable: gold is being sold during an active Middle East conflict
precisely because the oil shock from that conflict is now hurting
gold’s prospects by reigniting inflation and forcing the Fed to stay
hawkish. Higher oil means higher inflation means higher-for-longer rates means
gold suffers despite the geopolitical backdrop that should theoretically
support it.

Bloomberg
Intelligence’s Mike McGlone identified this paradox earlier this
week: “Gold’s best year in 2025 since 1979 – unequalled in a relatively
low-inflation environment – looks prescient ahead of 2026’s closure of the
Strait of Hormuz, with peak-price inklings.
Technical Outlook – What Follows Gold’s Warning? Store of Value’s Speculative Shift – Gold’s best year in 2025 since 1979 — unequaled in a relatively low-inflation environment — looks prescient ahead of 2026’s closure of the Strait of Hormuz, with peak-price inklings. The surge… pic.twitter.com/LhXk2U8EEy
— Mike McGlone (@mikemcglone11) March 16, 2026
The surge
to multiyear extremes vs. most moving averages and broad commodities may
suggest the store of value has shifted to a speculative risk asset.” That
framing – gold as speculative risk asset rather than pure safe haven – is the
most bearish structural argument currently circulating, and the two-day crash
gives it uncomfortable credibility.
Gold Technical Analysis:
The Levels That Matter Now
As my
technical analysis shows, gold’s two-day, 6% decline has materially changed the
chart structure. The consolidation near the all-time highs that
I described in Tuesday’s analysis has been broken to the downside, and the move
has opened up a sequence of support targets that were previously theoretical
but are now directly in play.
The first
support I am watching is $4,550 – the late 2025 historical
highs that marked the peak before the January blow-off to $5,600. This was an
area of significant buying last year and should attract some demand on the
first test. Below that, $4,360 is the next meaningful level,
representing a prior consolidation zone and Fibonacci retracement target.
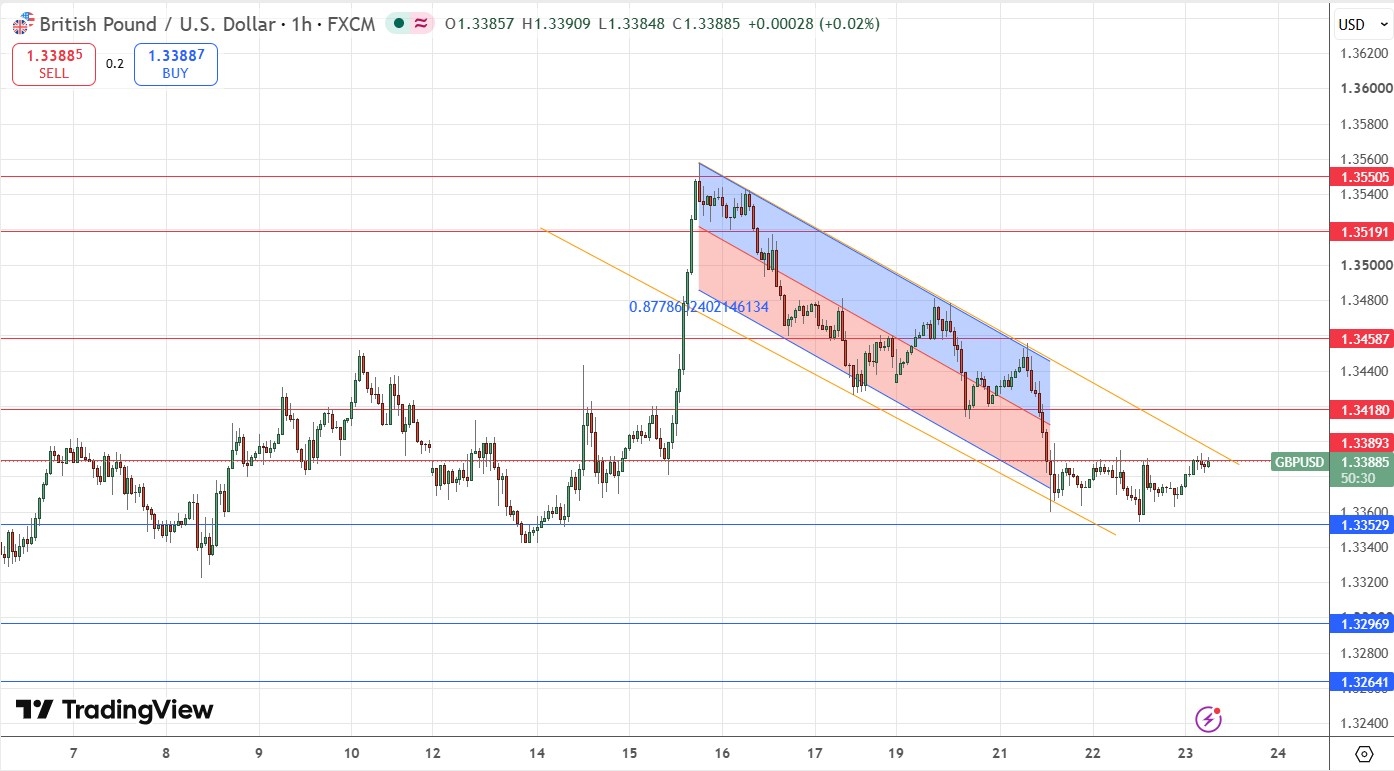
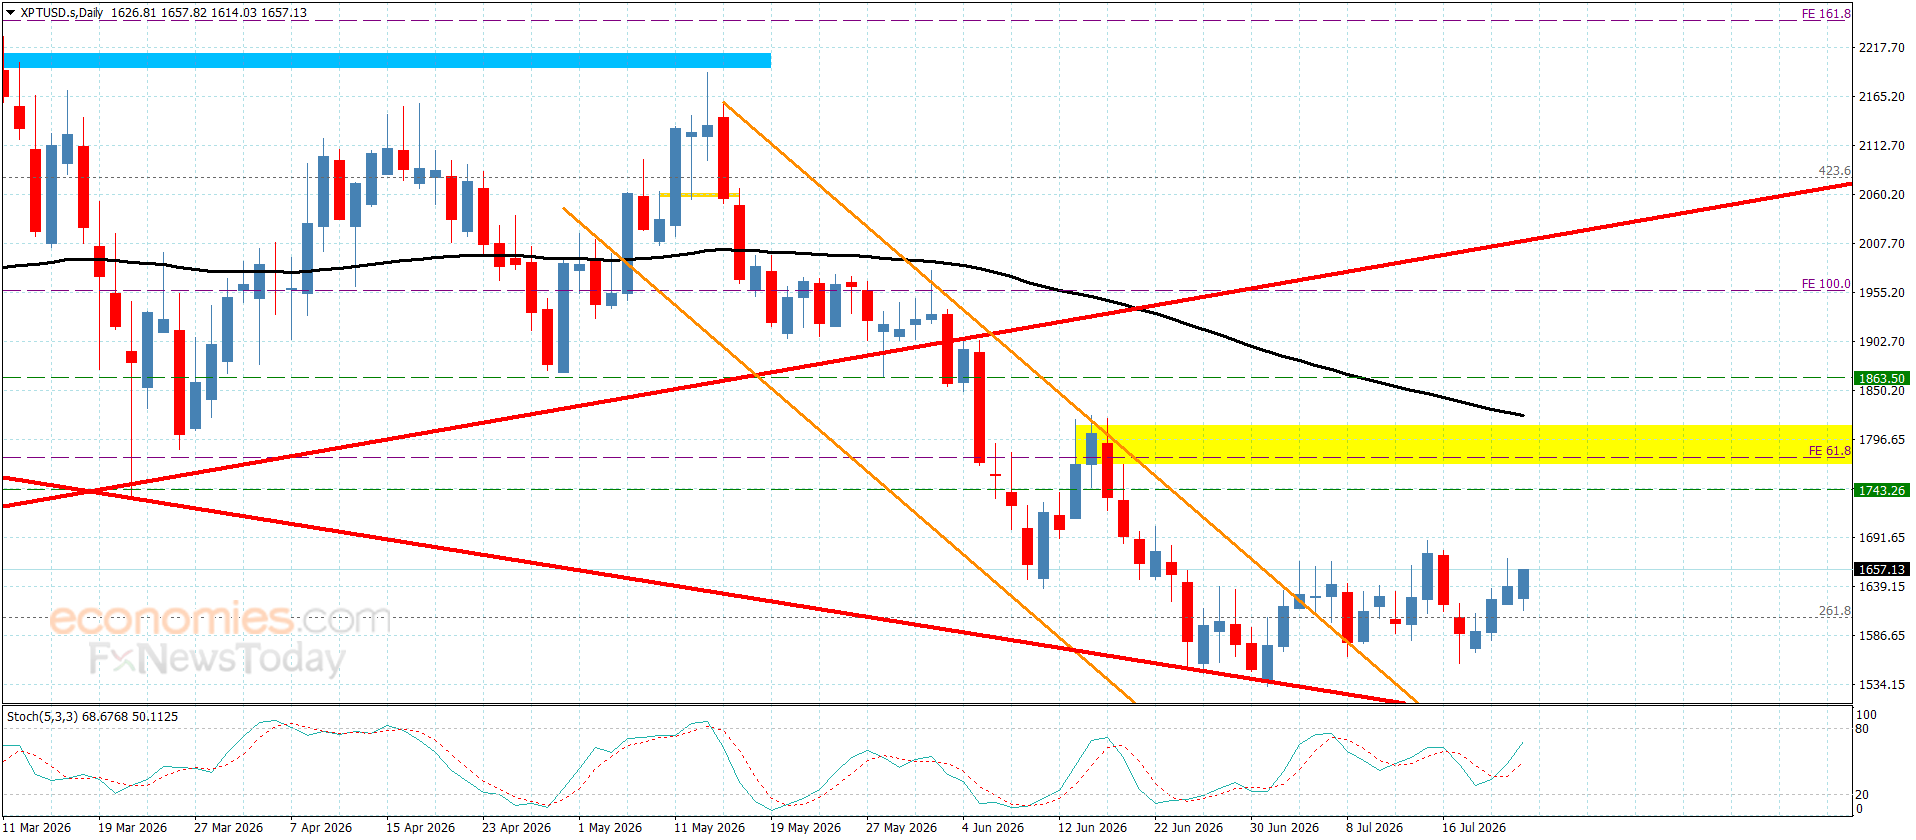
The level Why gold price is going down today? Source: Tradingview.com
that matters most on my entire gold chart is the 200-day EMA at
approximately $4,200. That is the boundary separating a bull trend from a
bear trend, and gold has not traded below it since late 2023. A sustained break
below $4,200 would be a genuinely significant technical event. It would open
the path toward $3,500 per ounce – the lows from which the
current near-uninterrupted rally to $5,600 began. From Thursday’s $4,700, that
scenario implies a further decline of over 25% and would
represent the most severe gold correction since the 2022 Fed tightening cycle.
Analyst @Kb__Officiall had
been maintaining a bearish gold bias since last week, targeting $4,650
as the primary downside target while watching for a potential
retracement to $5,080 before the next leg lower – a level that has now been
blown past entirely.
Weekly Outlook – #Gold( $XAUUSD )
Maintaining my bearish bias on $Gold this week. Last week’s momentum supports the downside and I expect the downward movement to continue.
However, I’m watching for a retracement into the 5080 zone first. If price pulls back into that area, it… pic.twitter.com/Sy6FU54aY8
— K_B📈📉 (@Kb__Officiall) March 15, 2026
His
framework, which generated 12,100 views, is playing out faster than even he
anticipated.
|
Level |
Type |
Notes |
|
$5,600 |
All-time high (Jan 2026) |
Gold -16% from here |
|
$5,000 |
Broken psychological support |
Lost Wednesday, now resistance |
|
$4,700 |
Current price (Mar 19) |
-6% in |
|
$4,550 |
First bear target |
Late 2025 historical highs |
|
$4,360 |
Second bear target |
Prior consolidation zone |
|
$4,200 |
200-day |
Last below here: late 2023 |
|
$3,500 |
Extreme bear target |
2025 rally starting point, -25%+ |
Silver Is Falling Harder
Than Gold
As my earlier
silver analysis warned, silver amplifies gold’s moves in both directions – and Thursday’s
session is proving that rule. Silver has fallen more sharply than gold in
percentage terms, and according to the Saxo Bank commodities report from Ole
Hansen, “silver may face a deeper retracement” due to its
“higher sensitivity to economic growth and industrial demand, combined
with rising concerns that energy-driven inflation will dent global
activity.”
The crowded
speculative positions that built up during the January $121 spike are still
being unwound, and the broader risk-off tone is accelerating exits.
My silver
chart from Tuesday remains valid: the $80 support and 50 EMA are
the immediate battleground. A break below $70 – the lower
consolidation boundary – activates the path toward the 200-day MA at $60 and
ultimately the October 2025 historical highs at $54.
Dilin Wu of
Pepperstone adds that copper is also trading lower and “adding to growth
worries” – when industrial metals fall in unison, it signals that the
market is pricing in genuine demand destruction, not just a monetary policy
adjustment.
Gold Price Predictions
2026: The Full Range
The 6%
two-day decline has not materially shifted the major institutional forecasts,
which were built on year-end rather than near-term targets. However, the
technical damage done to the chart warrants a full reassessment of the downside
scenarios.
|
Source |
Gold Target 2026 |
Notes |
|
My chart (extreme bear) |
$3,500 |
If 200 EMA at $4,200 breaks, -25%+ |
|
My chart (bear targets) |
$4,360 then $4,200 |
Sequential support levels |
|
@Kb__Officiall |
$4,650 |
Weekly downside target |
|
World Gold Council |
+5-15% from current |
$4,935-$5,405 scenario |
|
JP Morgan |
$5,000 (Q4 2026) |
Central bank buying thesis |
|
Goldman Sachs |
$6,000 |
Dollar weakness, rate cuts |
|
Robert Kiyosaki |
$35,000 |
One year |
FAQ
Why is gold crashing
today, March 19, 2026?
Gold is
falling for the second consecutive session after Wednesday’s Federal Reserve
decision delivered a hawkish hold: rates were kept at 3.5%-3.75% while the dot
plot was revised to show only one rate cut in all of 2026, down from two.
Hotter-than-expected February PPI at +0.7% pushed Treasury yields to 4.2% and
the dollar toward 99.9, both direct headwinds for non-yielding gold.
How low can gold go in
2026?
As shown on
my chart, the sequential downside targets are $4,550 (late
2025 historical highs), then $4,360 (prior consolidation), and
then the 200-day EMA at $4,200 – the critical bull/bear
dividing line. A sustained break below $4,200 opens the path toward $3,500,
the starting point of the entire 2025-2026 rally, representing a decline of
over 25% from Thursday’s $4,700. @Kb__Officiall targets $4,650 as the
near-term downside with potential for further weakness, while Mike McGlone
warns that gold may have shifted from safe-haven to speculative risk asset.
Is the gold bull market
over?
Not
according to the institutional consensus. JP Morgan maintains its $5,000 Q4
2026 target, Goldman Sachs holds its $6,000 forecast, and Dilin Wu of
Pepperstone describes the current decline as “a pricing logic adjustment
rather than a reversal of the long-term trend.” The structural supports –
central bank buying, US fiscal deficits, and geopolitical risk – remain intact.
What is the gold price
prediction for 2026?
The
institutional range runs from the World Gold Council’s conservative 5-15%
upside scenario from current levels to Goldman Sachs’ $6,000 target and Robert
Kiyosaki’s extraordinary $35,000
post-bubble-bust forecast. JP Morgan’s base case of $5,000 by Q4 2026 is the most credible
near-term institutional target. On the bear side, my chart’s $3,500 extreme
scenario and @Kb__Officiall’s $4,650 near-term target represent the downside
framework.
Gold price is
in freefall. After spending the better part of 2026 consolidating near all-time
highs above $5,000, the yellow metal has lost approximately 6% in two
consecutive sessions, crashing through the psychologically critical $5,000
barrier on Wednesday and extending the decline to $4,700 per ounce on
Thursday, March 19, 2026, the lowest price since early February.
In this
article, I will break down the technical analysis of the XAU/USD, examine the
mechanics behind this week’s crash, and present the key gold price predictions
for 2026 , including where the real floor is if the selling continues. Based on
my 15 years of experience as an analyst and retail investor, here is what I am
watching.
Follow
me on X for real-time gold market analysis: @ChmielDk
Why Gold Is Crashing? The
Fed Pulled the Rug
Wednesday’s
FOMC decision was a hold, as expected – Polymarket had it at over 90%
probability and the market was fully prepared for no rate movement. What the
market was not prepared for was the hawkish tone of the dot
plot. The Fed trimmed its 2026 rate cut projections from two cuts to one,
citing hotter-than-expected producer inflation – February’s PPI came in
at +0.7%, well above consensus – and signalled that the Strait of
Hormuz-driven oil spike is creating inflation persistence that prevents easing.
The 10-year
Treasury yield jumped to 4.2%, the Dollar Index climbed toward 99.9, and gold –
a non-yielding asset whose entire bull thesis rested on falling real yields and
a weakening dollar – repriced accordingly.
As Dilin
Wu, Research Strategist at Pepperstone, frames it: “This sharp decline in
gold reflects a confluence of factors – large-scale risk asset liquidations, a
hawkish shift in Fed expectations, and a stronger dollar.” Crucially, he
views this as “a pricing logic adjustment rather than a reversal of the
long-term trend.”
The
technical break below the 50-day MA near $4,978 and below the $5,000
round level triggered momentum selling and profit-taking from a
crowded long, amplifying what was already a fundamental repricing.
The irony
noted by my earlier
gold analysis remains
fully applicable: gold is being sold during an active Middle East conflict
precisely because the oil shock from that conflict is now hurting
gold’s prospects by reigniting inflation and forcing the Fed to stay
hawkish. Higher oil means higher inflation means higher-for-longer rates means
gold suffers despite the geopolitical backdrop that should theoretically
support it.
Bloomberg
Intelligence’s Mike McGlone identified this paradox earlier this
week: “Gold’s best year in 2025 since 1979 – unequalled in a relatively
low-inflation environment – looks prescient ahead of 2026’s closure of the
Strait of Hormuz, with peak-price inklings.
Technical Outlook – What Follows Gold’s Warning? Store of Value’s Speculative Shift – Gold’s best year in 2025 since 1979 — unequaled in a relatively low-inflation environment — looks prescient ahead of 2026’s closure of the Strait of Hormuz, with peak-price inklings. The surge… pic.twitter.com/LhXk2U8EEy
— Mike McGlone (@mikemcglone11) March 16, 2026
The surge
to multiyear extremes vs. most moving averages and broad commodities may
suggest the store of value has shifted to a speculative risk asset.” That
framing – gold as speculative risk asset rather than pure safe haven – is the
most bearish structural argument currently circulating, and the two-day crash
gives it uncomfortable credibility.
Gold Technical Analysis:
The Levels That Matter Now
As my
technical analysis shows, gold’s two-day, 6% decline has materially changed the
chart structure. The consolidation near the all-time highs that
I described in Tuesday’s analysis has been broken to the downside, and the move
has opened up a sequence of support targets that were previously theoretical
but are now directly in play.
The first
support I am watching is $4,550 – the late 2025 historical
highs that marked the peak before the January blow-off to $5,600. This was an
area of significant buying last year and should attract some demand on the
first test. Below that, $4,360 is the next meaningful level,
representing a prior consolidation zone and Fibonacci retracement target.
The level Why gold price is going down today? Source: Tradingview.com
that matters most on my entire gold chart is the 200-day EMA at
approximately $4,200. That is the boundary separating a bull trend from a
bear trend, and gold has not traded below it since late 2023. A sustained break
below $4,200 would be a genuinely significant technical event. It would open
the path toward $3,500 per ounce – the lows from which the
current near-uninterrupted rally to $5,600 began. From Thursday’s $4,700, that
scenario implies a further decline of over 25% and would
represent the most severe gold correction since the 2022 Fed tightening cycle.
Analyst @Kb__Officiall had
been maintaining a bearish gold bias since last week, targeting $4,650
as the primary downside target while watching for a potential
retracement to $5,080 before the next leg lower – a level that has now been
blown past entirely.
Weekly Outlook – #Gold( $XAUUSD )
Maintaining my bearish bias on $Gold this week. Last week’s momentum supports the downside and I expect the downward movement to continue.
However, I’m watching for a retracement into the 5080 zone first. If price pulls back into that area, it… pic.twitter.com/Sy6FU54aY8
— K_B📈📉 (@Kb__Officiall) March 15, 2026
His
framework, which generated 12,100 views, is playing out faster than even he
anticipated.
|
Level |
Type |
Notes |
|
$5,600 |
All-time high (Jan 2026) |
Gold -16% from here |
|
$5,000 |
Broken psychological support |
Lost Wednesday, now resistance |
|
$4,700 |
Current price (Mar 19) |
-6% in |
|
$4,550 |
First bear target |
Late 2025 historical highs |
|
$4,360 |
Second bear target |
Prior consolidation zone |
|
$4,200 |
200-day |
Last below here: late 2023 |
|
$3,500 |
Extreme bear target |
2025 rally starting point, -25%+ |
Silver Is Falling Harder
Than Gold
As my earlier
silver analysis warned, silver amplifies gold’s moves in both directions – and Thursday’s
session is proving that rule. Silver has fallen more sharply than gold in
percentage terms, and according to the Saxo Bank commodities report from Ole
Hansen, “silver may face a deeper retracement” due to its
“higher sensitivity to economic growth and industrial demand, combined
with rising concerns that energy-driven inflation will dent global
activity.”
The crowded
speculative positions that built up during the January $121 spike are still
being unwound, and the broader risk-off tone is accelerating exits.
My silver
chart from Tuesday remains valid: the $80 support and 50 EMA are
the immediate battleground. A break below $70 – the lower
consolidation boundary – activates the path toward the 200-day MA at $60 and
ultimately the October 2025 historical highs at $54.
Dilin Wu of
Pepperstone adds that copper is also trading lower and “adding to growth
worries” – when industrial metals fall in unison, it signals that the
market is pricing in genuine demand destruction, not just a monetary policy
adjustment.
Gold Price Predictions
2026: The Full Range
The 6%
two-day decline has not materially shifted the major institutional forecasts,
which were built on year-end rather than near-term targets. However, the
technical damage done to the chart warrants a full reassessment of the downside
scenarios.
|
Source |
Gold Target 2026 |
Notes |
|
My chart (extreme bear) |
$3,500 |
If 200 EMA at $4,200 breaks, -25%+ |
|
My chart (bear targets) |
$4,360 then $4,200 |
Sequential support levels |
|
@Kb__Officiall |
$4,650 |
Weekly downside target |
|
World Gold Council |
+5-15% from current |
$4,935-$5,405 scenario |
|
JP Morgan |
$5,000 (Q4 2026) |
Central bank buying thesis |
|
Goldman Sachs |
$6,000 |
Dollar weakness, rate cuts |
|
Robert Kiyosaki |
$35,000 |
One year |
FAQ
Why is gold crashing
today, March 19, 2026?
Gold is
falling for the second consecutive session after Wednesday’s Federal Reserve
decision delivered a hawkish hold: rates were kept at 3.5%-3.75% while the dot
plot was revised to show only one rate cut in all of 2026, down from two.
Hotter-than-expected February PPI at +0.7% pushed Treasury yields to 4.2% and
the dollar toward 99.9, both direct headwinds for non-yielding gold.
How low can gold go in
2026?
As shown on
my chart, the sequential downside targets are $4,550 (late
2025 historical highs), then $4,360 (prior consolidation), and
then the 200-day EMA at $4,200 – the critical bull/bear
dividing line. A sustained break below $4,200 opens the path toward $3,500,
the starting point of the entire 2025-2026 rally, representing a decline of
over 25% from Thursday’s $4,700. @Kb__Officiall targets $4,650 as the
near-term downside with potential for further weakness, while Mike McGlone
warns that gold may have shifted from safe-haven to speculative risk asset.
Is the gold bull market
over?
Not
according to the institutional consensus. JP Morgan maintains its $5,000 Q4
2026 target, Goldman Sachs holds its $6,000 forecast, and Dilin Wu of
Pepperstone describes the current decline as “a pricing logic adjustment
rather than a reversal of the long-term trend.” The structural supports –
central bank buying, US fiscal deficits, and geopolitical risk – remain intact.
What is the gold price
prediction for 2026?
The
institutional range runs from the World Gold Council’s conservative 5-15%
upside scenario from current levels to Goldman Sachs’ $6,000 target and Robert
Kiyosaki’s extraordinary $35,000
post-bubble-bust forecast. JP Morgan’s base case of $5,000 by Q4 2026 is the most credible
near-term institutional target. On the bear side, my chart’s $3,500 extreme
scenario and @Kb__Officiall’s $4,650 near-term target represent the downside
framework.


Written by : Editorial team of BIPNs
Main team of content of bipns.com. Any type of content should be approved by us.


Share this article: