
Category: Forex News, News
EUR/USD Forecast: Euro Bounces Despite Soft PMIs – Could We Re-Test 2-Month Highs?
is showing resilience, bouncing despite a slowdown in this morning’s Eurozone PMI survey – can it rally back to 2-month highs at 1.1830?
EUR/USD Key Points
- The US-Iran conflict continues to simmer in the background, despite waning interest on the part of traders.
- EUR/USD is showing resilience, bouncing despite a slowdown in this morning’s Eurozone PMI survey.
- A breakout from EUR/USD’s falling wedge pattern would increase the odds of a continuation back toward 2-month highs near 1.1830
Markets are once again on tenterhooks awaiting new developments in the US-Iran stalemate, with neither side willing to commit to talks or escalate military actions. While fresh developments are possible, even likely, heading into the weekend, it’s clear that general interest in the war is waning:

Source: Google Trends
Against that backdrop, traders are keeping at least one eye on economic data, which is painting a mixed picture of the fallout from the conflict. While today’s UK PMI surveys were generally better than expected, the same cannot be said for the Eurozone, where came in at 47.4, below the 49.8 reading expected. Even after a decent 52.2 reading in , the for the Eurozone remained in contractionary territory at 48.6.
As some readers may know, PMI surveys are among the most timely readings on current economic conditions, and today’s readings suggest that the Eurozone economy is stagnating at best as it navigates rising input price inflation, a development that could also push the ECB to raise interest rates later this year.
Euro Technical Analysis: EUR/USD 4-Hour Chart

Source: Tradingview, StoneX
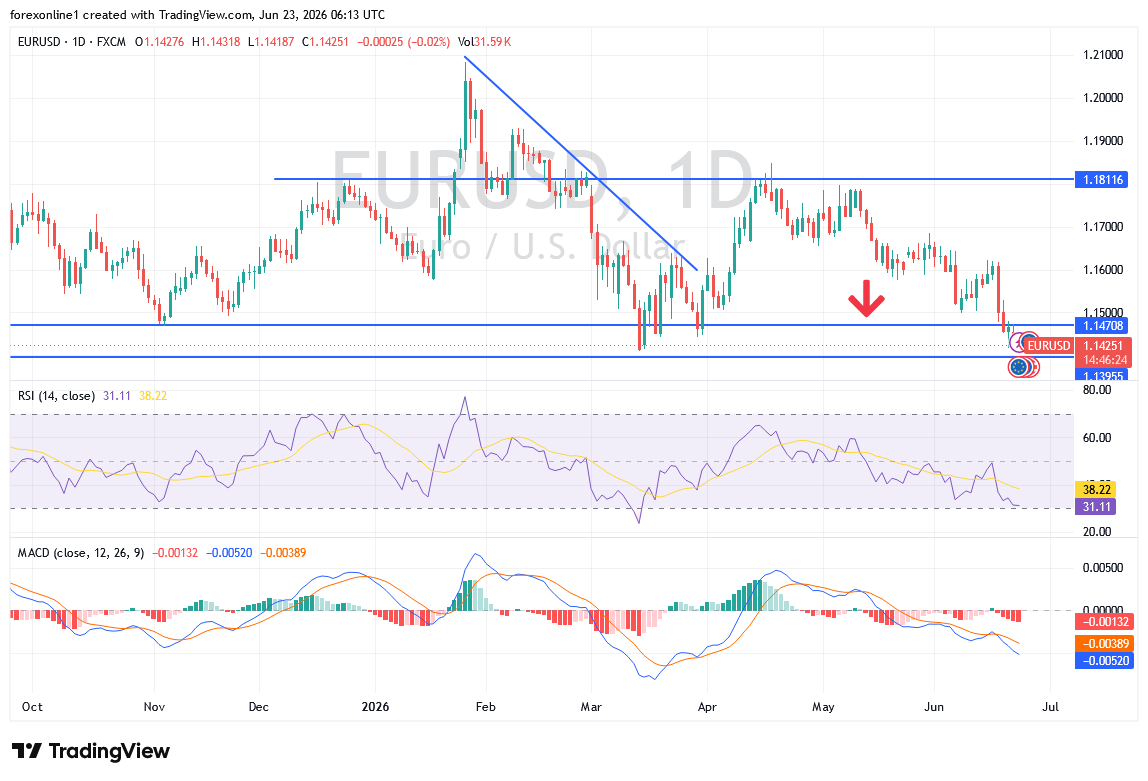
Despite the subdued PMI print, the euro is holding up relatively well against the world’s reserve currency. As the 4-hour chart below shows, the world’s most widely-traded currency pair is seeing a small bounce today after testing its 100-period (400-hour) MA.
More broadly, EUR/USD is carving out a falling wedge pattern over the past week, which is generally seen as a bullish pattern despite the name. A similar pattern on the 14-period RSI can be monitored for a potential leading sign of a bullish resumption.
A breakout above the top trend line would increase the odds of a continuation back toward 2-month highs near 1.1830 as we head into next week, though a break below the 400-hour MA would call the pattern into question.


Written by : Editorial team of BIPNs
Main team of content of bipns.com. Any type of content should be approved by us.


Share this article: