Category: Crypto News, News
A Strong V-Shaped Recovery on the Horizon for SOL
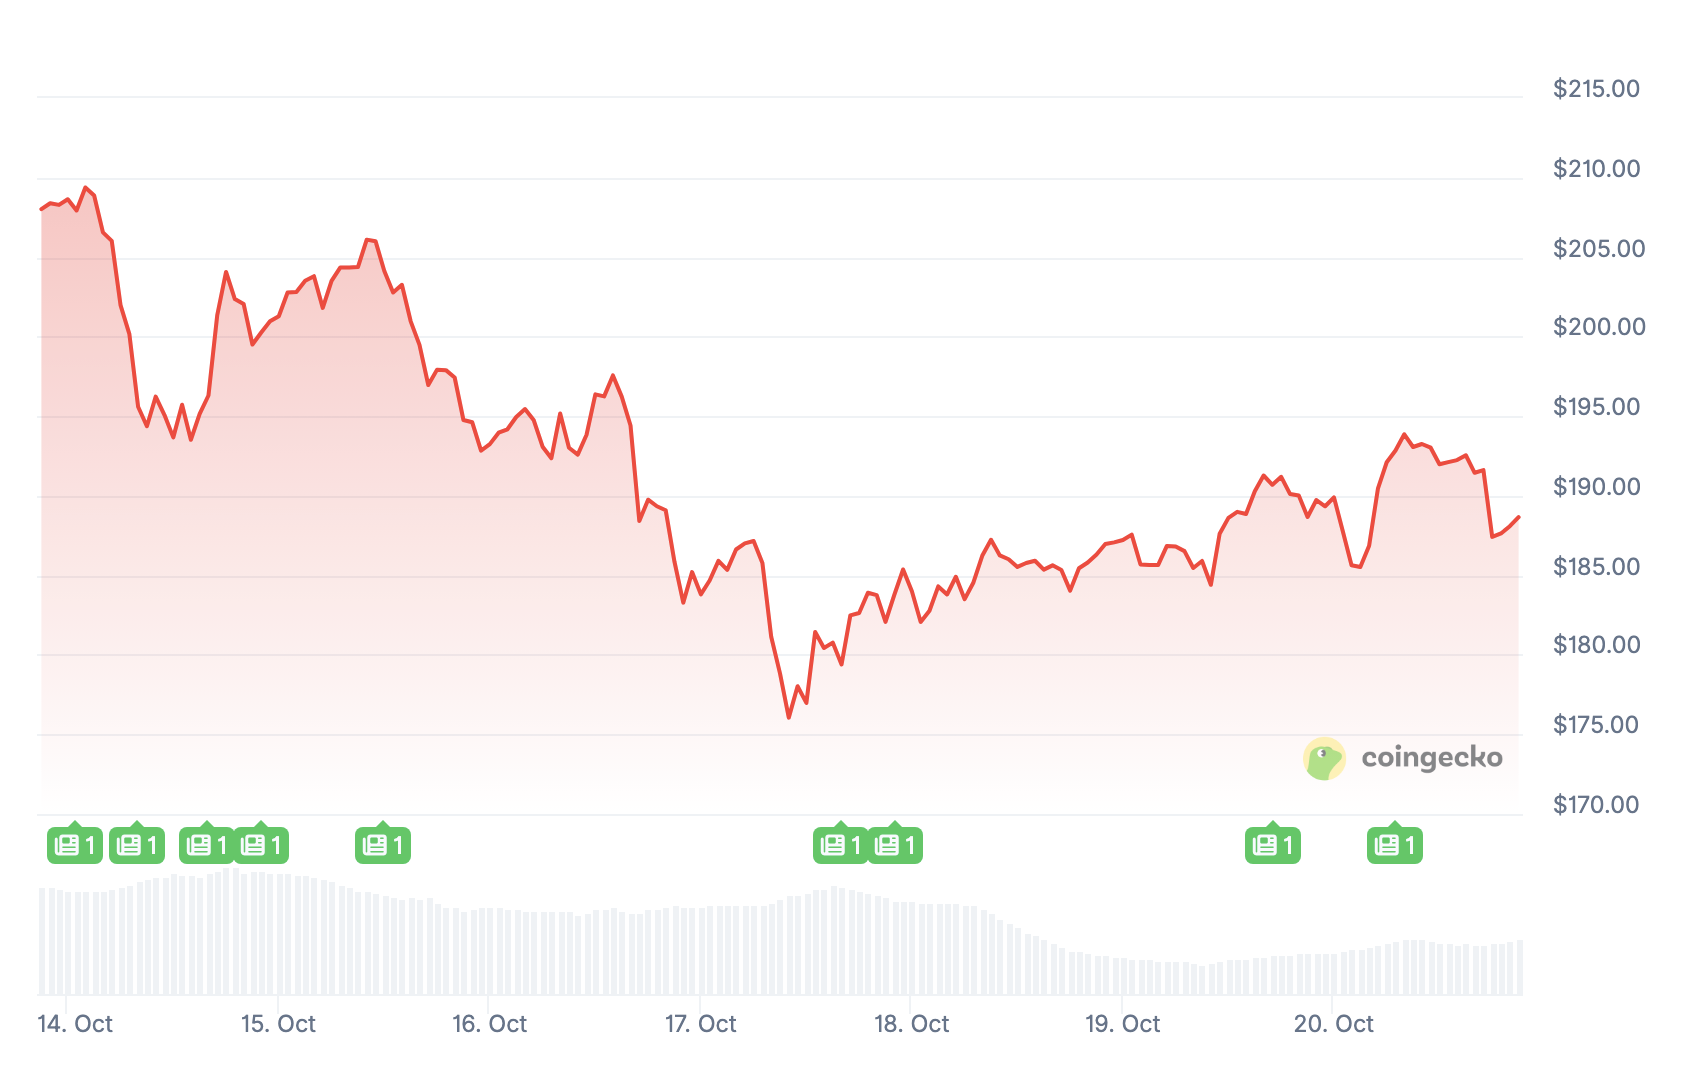
Solana (SOL) has recently been making headlines with a remarkable V-shaped recovery, showing resilience in the face of market volatility. Traders have been closely monitoring the token’s price action, which is displaying promising signs of further upside potential. A combination of technical indicators and fundamental data suggests that Solana could be poised for a significant bullish rally in the near term. Here’s a detailed look at the factors influencing SOL’s price action and what traders can expect moving forward.
Strong Bounce from Key Support Level
Solana’s price has seen an impressive rebound from a critical support level around $179.66. This level is notably aligned with the 61.8% Fibonacci retracement zone, a key area that often marks the end of bearish trends and signals the beginning of a reversal. Historically, this zone acts as a magnet for buyers, especially when bearish pressure begins to fade, and it seems to have done just that for Solana.
The recent bounce from this level validates the $179.66 support as a strong floor for the token, suggesting that Solana’s price could continue to trend upward in the coming weeks. Traders are eyeing potential bullish targets of $254.35, $302.02, and $345.76, which align with the Fibonacci extensions. These levels represent key resistance points where Solana could encounter selling pressure if it continues its upward momentum.
Positive Market Structure and Higher Lows
Solana’s overall market structure is looking increasingly positive as the token forms higher lows following the recovery from $179.66. This indicates renewed buyer interest and suggests that momentum could build in the weeks ahead. As long as the price holds above this support level, the potential for a breakout to new highs remains strong.
A break below $179.66 would invalidate the bullish setup, leading to a potential downside move. However, if market sentiment continues to favor the altcoin, Solana could move towards its first target of $254.35 in the near term, reinforcing the case for a V-shaped recovery.
MVRV Ratio: Signaling Recovery Phase
Solana’s Market Value to Realized Value (MVRV) ratio is another key metric providing insight into the token’s recovery. At the time of writing, the MVRV ratio is steadily climbing, suggesting that most investors who entered during previous accumulation phases are either at break-even or slightly in profit. This indicates that the token is in the midst of a recovery phase, with new buyers entering the market.
The MVRV ratio has remained in a neutral zone, reflecting neither overvaluation nor undervaluation of the asset. This suggests that there is optimism in the market, with more investors beginning to buy into Solana as it recovers from the $179.66 support. If the MVRV ratio continues to rise, it could signal increased confidence in Solana’s price momentum, aligning with the bullish targets indicated by the Fibonacci analysis.
However, traders should remain cautious if the MVRV ratio spikes into overbought territory. This could signal a period of profit-taking, which may cause short-term pullbacks. A sustained MVRV ratio between 1.0 and 2.5 would suggest continued bullish momentum.
RSI: Neutral-to-Bullish Sentiment
The Relative Strength Index (RSI) is another crucial indicator for assessing Solana’s price action. The recent RSI readings have indicated that Solana is currently in a neutral-to-bullish zone, with values trending between 55 and 60. This range suggests that Solana is not yet overbought, leaving room for further upward movement without triggering a reversal.
In previous rallies, Solana’s RSI has often peaked around the 70-75 range before experiencing pullbacks. Given that the current RSI is still in the neutral zone, there is ample room for the token to rise further without becoming overheated. This supports the case for a continued bullish trend, as Solana has not yet reached the overbought levels that could signal a reversal.
A Robust Case for a Bullish Rally
Overall, Solana’s technical and fundamental indicators are aligning to create a strong case for a bullish rally. Key support at $179.66, combined with Fibonacci retracement levels, a rising MVRV ratio, and a neutral-to-bullish RSI, all point to a potential continuation of the recovery. The V-shaped price action observed over the past few weeks highlights the resilience of the token and the growing optimism among traders.
As long as Solana can maintain support at $179.66, the altcoin could target its first major resistance at $254.35, with further upside potential to $302.02 and $345.76. Traders should closely monitor the MVRV ratio and RSI to gauge market sentiment and adjust their positions accordingly.
Conclusion: Preparing for Potential Upside
Solana’s recovery has been impressive, and the technical indicators suggest that there is more room for growth. With a strong support level at $179.66, bullish Fibonacci targets, and positive momentum in the MVRV ratio and RSI, Solana is positioning itself for a potential V-shaped recovery in the near term.
However, as always, traders should stay vigilant and watch for any shifts in market sentiment that could impact the token’s price action. If Solana continues to build on its recent recovery, it could deliver significant returns for investors in the coming weeks.
Post Views: 2
Written by : Editorial team of BIPNs
Main team of content of bipns.com. Any type of content should be approved by us.
Share this article:


