XAG/USD Plunges To Alarming Three-Week Low Below $80 Ahead Of Critical Fed Decision

EUR/USD holds steady above 1.1400 early Monday after losing more than 1.5% in the previous week. An improving risk mood could help the pair edge higher but the technical outlook suggests that the bearish bias stays intact in the near term.
The table below shows the percentage change of Euro (EUR) against listed major currencies last 7 days. Euro was the weakest against the Australian Dollar.
| USD | EUR | GBP | JPY | CAD | AUD | NZD | CHF | |
|---|---|---|---|---|---|---|---|---|
| USD | 0.93% | 0.69% | 0.78% | 0.74% | -0.43% | 0.96% | 1.34% | |
| EUR | -0.93% | -0.25% | -0.16% | -0.22% | -1.37% | -0.01% | 0.38% | |
| GBP | -0.69% | 0.25% | 0.13% | 0.04% | -1.12% | 0.25% | 0.63% | |
| JPY | -0.78% | 0.16% | -0.13% | -0.02% | -1.18% | 0.19% | 0.57% | |
| CAD | -0.74% | 0.22% | -0.04% | 0.02% | -1.17% | 0.21% | 0.60% | |
| AUD | 0.43% | 1.37% | 1.12% | 1.18% | 1.17% | 1.39% | 1.77% | |
| NZD | -0.96% | 0.01% | -0.25% | -0.19% | -0.21% | -1.39% | 0.37% | |
| CHF | -1.34% | -0.38% | -0.63% | -0.57% | -0.60% | -1.77% | -0.37% |
The heat map shows percentage changes of major currencies against each other. The base currency is picked from the left column, while the quote currency is picked from the top row. For example, if you pick the Euro from the left column and move along the horizontal line to the US Dollar, the percentage change displayed in the box will represent EUR (base)/USD (quote).
Crude Oil prices continue to push higher to start the week but the upside remains capped for now, as investors assess the latest headlines surrounding the Middle East conflict.
Over the weekend, the US military hit targets located on Kharg Island, a strategic Iranian outpost in the Persian Gulf, and warned it could hit Oil infrastructure next if Tehran keeps disrupting naval activity in the Strait of Hormuz. Trump also called on allies to help secure the Strait of Hormuz.
European Union (EU) foreign ministers are reportedly debating how they could provide support in trying to secure the Strait of Hormuz, and the UK plans to send minesweeping drones. Japanese Prime Minister (PM) Sanae Takaichi said on Monday that they are exploring ways to protect Japanese vessels in the Middle East, but said they don’t currently have any plans to dispatch the navy to the region.
The US economic calendar will feature mid-tier data releases on Monday, which are likely to be ignored by investors. Later in the week, the Federal Reserve (Fed) and the European Central Bank (ECB) will conduct policy meetings.
In the meantime, US stock index futures rise between 0.4% and 0.6% in the early European session. In case risk flows start to dominate the action in financial markets following a bullish opening in Wall Street, the US Dollar (USD) could lose some strength and allow EUR/USD to inch higher.
The near-term bias is bearish, as the pair holds well below the 20- and 50-period Moving Averages (MAs) clustered in the mid-1.15s on the 4-hour chart, while the longer-term 100- and 200-period MAs descend from the 1.17s and 1.18s, reinforcing a downside trend structure. Price trades near the lower Bollinger Band after an extended slide from the upper band region, underscoring persistent selling pressure. The Relative Strength Index (RSI) hovers in the low 30s after printing sub-30 readings, signaling oversold conditions but not yet a decisive momentum reversal.
Immediate resistance is seen at 1.1500, where prior horizontal resistance converges with the falling 20-period MA, and a break above this area would open the way toward 1.1670, aligning with the descending 100-period MA and a key structural cap. On the downside, initial support emerges near 1.1400, defined by a drawn horizontal level just beneath the market, with a clear break exposing 1.1330 and then 1.1300 as the next bearish targets. As long as EUR/USD holds below 1.1500, rallies remain vulnerable to selling into this resistance band.
(The technical analysis of this story was written with the help of an AI tool.)
The Euro is the currency for the 20 European Union countries that belong to the Eurozone. It is the second most heavily traded currency in the world behind the US Dollar. In 2022, it accounted for 31% of all foreign exchange transactions, with an average daily turnover of over $2.2 trillion a day.
EUR/USD is the most heavily traded currency pair in the world, accounting for an estimated 30% off all transactions, followed by EUR/JPY (4%), EUR/GBP (3%) and EUR/AUD (2%).
The European Central Bank (ECB) in Frankfurt, Germany, is the reserve bank for the Eurozone. The ECB sets interest rates and manages monetary policy.
The ECB’s primary mandate is to maintain price stability, which means either controlling inflation or stimulating growth. Its primary tool is the raising or lowering of interest rates. Relatively high interest rates – or the expectation of higher rates – will usually benefit the Euro and vice versa.
The ECB Governing Council makes monetary policy decisions at meetings held eight times a year. Decisions are made by heads of the Eurozone national banks and six permanent members, including the President of the ECB, Christine Lagarde.
Eurozone inflation data, measured by the Harmonized Index of Consumer Prices (HICP), is an important econometric for the Euro. If inflation rises more than expected, especially if above the ECB’s 2% target, it obliges the ECB to raise interest rates to bring it back under control.
Relatively high interest rates compared to its counterparts will usually benefit the Euro, as it makes the region more attractive as a place for global investors to park their money.
Data releases gauge the health of the economy and can impact on the Euro. Indicators such as GDP, Manufacturing and Services PMIs, employment, and consumer sentiment surveys can all influence the direction of the single currency.
A strong economy is good for the Euro. Not only does it attract more foreign investment but it may encourage the ECB to put up interest rates, which will directly strengthen the Euro. Otherwise, if economic data is weak, the Euro is likely to fall.
Economic data for the four largest economies in the euro area (Germany, France, Italy and Spain) are especially significant, as they account for 75% of the Eurozone’s economy.
Another significant data release for the Euro is the Trade Balance. This indicator measures the difference between what a country earns from its exports and what it spends on imports over a given period.
If a country produces highly sought after exports then its currency will gain in value purely from the extra demand created from foreign buyers seeking to purchase these goods. Therefore, a positive net Trade Balance strengthens a currency and vice versa for a negative balance.
Today’s early reaction is just textbook position-squaring in reaction to a dip in the dollar and easing 10-year Treasury yields. Both are increasing the appeal of non-yielding bullion.
The relationship between yields, the dollar and gold is interesting, but the major story driving the price action in gold at this time is crude oil. Here’s why gold has been under pressure since the war between the U.S. and Iran started on February 28.
Higher crude oil prices could push inflation higher and this will likely make the Federal Reserve more cautious about cutting interest rates. If they continue to push the rate cuts into the future then this could keep real yields elevated. A dovish outlook from the Fed is one of the main reasons gold has been so strong over the past two years. Elevated yields could become a major headwind for gold if crude oil continues to climb.
In my opinion, the key level to watch for crude oil is $100. Brent oil is currently above this level, WTI is getting close to overcoming this price. A sustained move over this level will be bearish for gold. It’s important to note that fundamentally, we’re not just dealing with ending the war, but also keeping supply moving through the Strait of Hormuz and repairing the damaged infrastructure.
Some will argue that gold is a hedge against inflation, but this case is a little different and not so textbook because of the relatively high interest rates, which make yielding assets like Treasurys more attractive to investors. Now we don’t expect to see a change in the longer-term trend, but on a day-to-day basis, gold will struggle to gain traction until it reaches a key value area or until inflation subsides enough for the Fed to comfortably resume its rate-cutting plans.
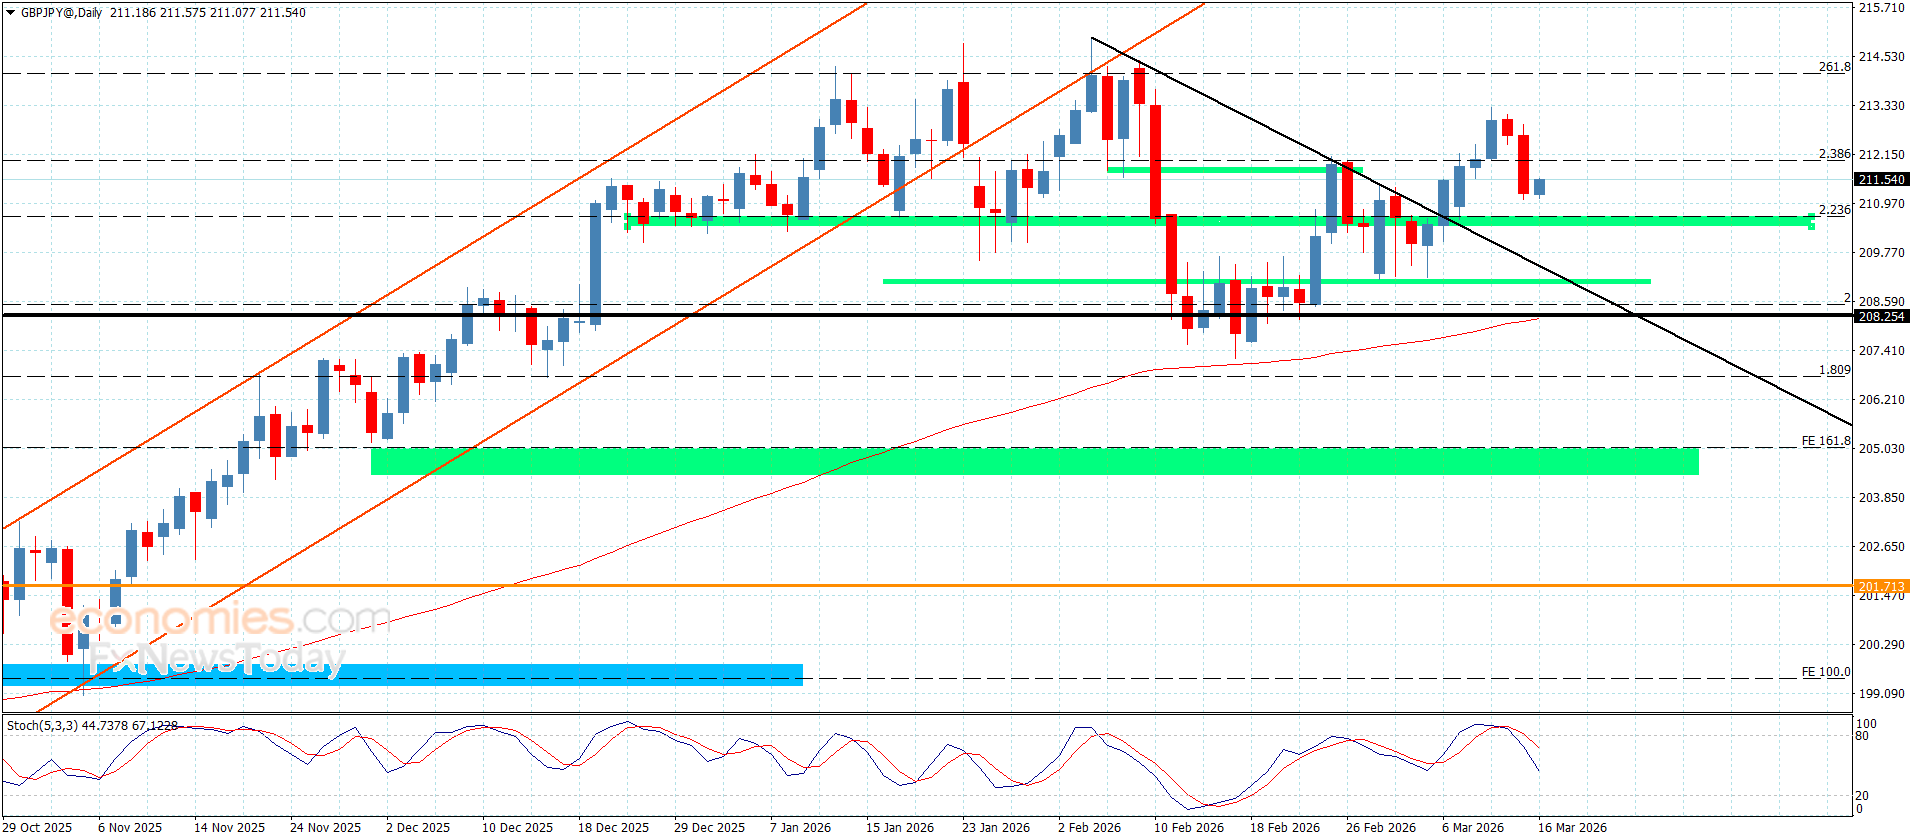
The GBPJPY pair lost positive momentum, forcing it to provide mixed trading as we expected previously to reach 211.05. The current negativity is caused by stochastic exit from the oversold levels, but it will not affect the bullish trend, depending on forming additional support at 210.60 against the current trading.
We expect forming mixed trading to confirm the importance of gathering positive momentum, which allows it to renew the bullish attempts by its rally towards 211.75 and 212.10, while reaching below the previously mentioned support and providing a negative close will force it to suffer several losses that might begin at 210.00 and 209.60.
The expected trading range for today is between 210.70 and 212.10
Trend forecast: Fluctuating within the bullish trend.
NEW YORK, March 14, 2026, 14:18 EDT
Natural gas futures in the U.S. slipped Friday. April Henry Hub contracts, the standard benchmark, wrapped up the day at $3.131 per mmBtu—down a little more than 3%. Forecasters are calling for mostly mild conditions through March, which has traders anticipating softer late-season heating demand. MarketWatch
The retreat stands out, given that the U.S. market remains shaped mostly by internal factors—supply, storage, and the weather—rather than the more acute LNG crunch seen overseas. According to the U.S. Energy Information Administration’s March Short-Term Energy Outlook, gas prices in Europe and Asia have climbed due to slower LNG flows through the Strait of Hormuz. But in the U.S., prices look set to stay largely insulated. Export terminals were already pushing capacity before the disruption, so there’s little slack left to boost shipments abroad for now. U.S. Energy Information Administration
The EIA now sees Henry Hub prices averaging around $3.76 per mmBtu in 2026, down from last month’s $4.31 call. For 2027, the agency is looking at $3.85. Unusually warm weather in February left inventories higher than expected, which has pulled the price outlook lower for the near term. U.S. Energy Information Administration
Storage helps buffer supply. As of the week ended March 6, working gas in storage hit 1,848 billion cubic feet—141 bcf higher than the same point last year, though still 17 bcf under the five-year norm. The EIA projects inventories finishing the winter close to 1,840 bcf. U.S. Energy Information Administration
Overseas supply remains under pressure. LNG for April delivery into Northeast Asia slipped to $19.50 per mmBtu, down from $22.50 the previous week. But JERA’s CEO, Yukio Kani, dismissed hopes that Middle East disruptions would resolve in a matter of weeks as “far too optimistic.” Venture Global CEO Mike Sabel, by contrast, described the ongoing volatility as “very short-term” and said he sees “very stable liquefaction prices” in the longer run. Reuters
Europe remains squeezed. On Friday, Dutch TTF front-month gas—the regional price benchmark—traded at roughly 50.1 euros per megawatt hour. Earlier in the week, Reuters noted the contract had eased back near 50 euros after jumping close to 65.5 euros on conflict headlines. Still, prices are sitting about 50% higher than February as storage levels across the region linger around 27% of capacity, the lowest for this time since 2022. Investing.com
Signals out of the U.S. continue to suggest ample supply. Gas rigs ticked up by one this week to 133, according to Baker Hughes, with the Haynesville figure now at its highest since May 2023. The EIA’s March report projects Lower 48 marketed gas production to average 118 bcf/d in 2026, rising to 121 bcf/d in 2027. Reuters
The downside risk for prices remains murky. NOAA’s 8-14 day forecast points to lingering below-normal temperatures in the Northeast, even while swaths of the West and central U.S. trend warmer. On the other side of the Atlantic, Europe is still staring at big storage deficits after burning through unusually large volumes. Another cold snap in late March or an unexpected drop in LNG flows could flip the supply balance quickly. Climate Prediction Center
The government’s yearly projection remains notably higher than the front-month market, at least for the moment. Friday settled at $3.131, trailing the EIA’s 2026 average of about $3.76. That points to the agency holding out for stronger prices ahead, despite trimming its outlook again. MarketWatch
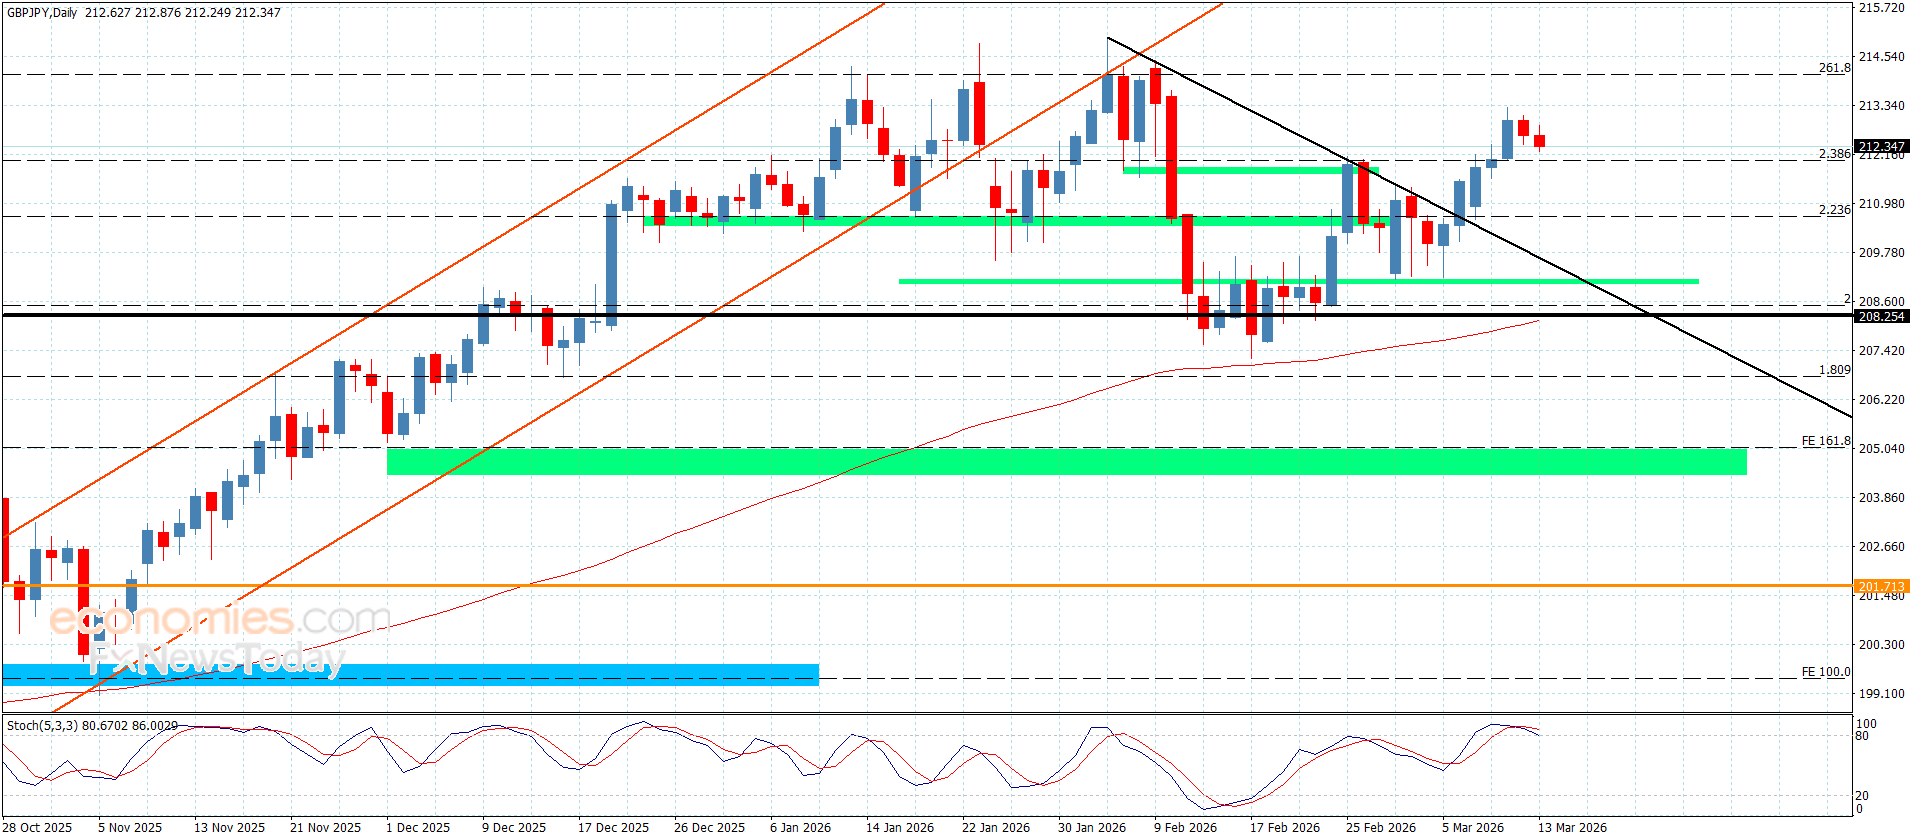
The GBPJPY pair repeatedly provided negative closes below 213.00 level, forcing it to provide mixed trading by reaching 211.90 as previously expected, this decline will not threaten the bullish scenario, depending on the continuation of forming extra support at 210.60 level, which makes us wait for gathering positive momentum, to activate the attempts of breaching the barrier and targeting new positive stations that might extend towards 214.20 and 215.00.
While breaking 210.60 level and holding below it might force it to form strong decline, which forces it to suffer several losses by reaching 209.80 and 209.10.
The expected trading range for today is between 211.80 and 213.00
Trend forecast: Fluctuating within the bullish trend
BitcoinWorld
Silver Price Forecast: XAG/USD Plunges to Near $84.50 as Resilient US Dollar Dominates
NEW YORK, April 2025 – The silver price forecast turned bearish today as the XAG/USD pair lost significant ground, trading near the $84.50 level. This sharp decline primarily stems from a surprisingly resilient US Dollar, which continues to exert downward pressure on dollar-denominated commodities. Consequently, traders are reassessing their positions in the precious metals complex.
The recent movement in the silver price forecast highlights a classic inverse relationship. Specifically, the US Dollar Index (DXY) has rallied for three consecutive sessions. This rally follows stronger-than-expected US retail sales data and hawkish commentary from Federal Reserve officials. Therefore, market participants are pricing in a higher-for-longer interest rate environment. Higher US interest rates typically bolster the dollar’s appeal to yield-seeking investors. As a result, assets priced in dollars, like silver, become more expensive for holders of other currencies, dampening demand.
Historically, the XAG/USD pair exhibits high sensitivity to dollar strength. For instance, during the 2022-2023 rate hike cycle, silver experienced similar periods of consolidation and decline. However, analysts note that industrial demand fundamentals for silver remain robust. The global transition to green energy and electric vehicles continues to underpin long-term consumption. This creates a complex dynamic where short-term currency headwinds clash with long-term structural demand.
Several key factors are currently fueling the US Dollar’s ascent, directly impacting the silver price forecast. First, recent economic indicators suggest the US economy retains underlying momentum. Strong employment figures and persistent service-sector inflation give the Federal Reserve little impetus to cut rates prematurely. Second, geopolitical tensions in Europe and the Middle East have triggered a flight to safety. The US Dollar and US Treasuries remain preferred safe-haven assets during periods of uncertainty.
Furthermore, comparative monetary policy plays a crucial role. While the Fed maintains a cautious stance, other major central banks, like the European Central Bank, have signaled a more dovish pivot. This policy divergence widens the interest rate differential, making dollar-based assets more attractive. The table below summarizes the primary drivers:
| Driver | Impact on USD | Impact on Silver (XAG/USD) |
|---|---|---|
| Strong US Economic Data | Positive | Negative |
| Hawkish Fed Policy Stance | Positive | Negative |
| Geopolitical Risk (Flight to Safety) | Positive | Mixed (Safe-haven but dollar-denominated) |
| Divergent Global Central Bank Policies | Positive | Negative |
Market strategists provide critical context for the current silver price forecast. Dr. Anya Sharma, Head of Commodities Research at Global Markets Insight, states, “The short-term trajectory for silver is inextricably linked to real yields and the dollar. The current macro environment is challenging for non-yielding assets.” She further explains that while industrial demand provides a floor, it often fails to offset intense financial market selling during risk-off periods. Meanwhile, technical analysts point to key support levels. The $84.00 zone represents a major psychological and technical barrier, having acted as support multiple times in Q1 2025. A sustained break below this level could trigger further automated selling.
Data from the Commodity Futures Trading Commission (CFTC) shows that managed money accounts have reduced their net-long positions in silver futures for two straight weeks. This shift in speculative positioning often precedes or confirms a bearish trend. However, physical market indicators tell a different story. Reported silver imports into key markets like India and China have remained steady, suggesting underlying physical demand is absorbing some of the paper market’s selling pressure.
Understanding the silver price forecast requires examining historical patterns. Silver is known for its high volatility compared to gold. This characteristic stems from its dual role as both a monetary metal and an industrial commodity. During periods of dollar strength and rising rates, the monetary aspect suffers first. For example, the 2013 ‘Taper Tantrum’ saw silver lose over 35% of its value as the dollar rallied on expectations of Fed tightening. Today’s market echoes some of those dynamics but within a different fundamental backdrop of energy transition demand.
Market psychology also plays a significant role. The $85.00 level had served as a consolidation point. The break below it has likely triggered stop-loss orders from bullish traders, accelerating the downward move. This creates a feedback loop where technical selling reinforces fundamental drivers. Traders now watch for signs of capitulation or a reversal in dollar momentum as potential catalysts for a silver rebound.
The immediate silver price forecast remains under pressure, with XAG/USD hovering near $84.50 due to pronounced US Dollar strength. The confluence of resilient US economic data, a patient Federal Reserve, and geopolitical risk flows continues to support the greenback. While long-term industrial demand for silver provides a fundamental underpinning, short-term price action is dominated by currency and interest rate dynamics. Market participants should monitor upcoming US inflation data and Fed communications closely, as these will be pivotal for the dollar’s next move and, by extension, the path for silver prices.
Q1: Why does a strong US Dollar cause silver prices to fall?
A strong US Dollar makes silver, which is priced in dollars, more expensive for buyers using other currencies. This typically reduces international demand, putting downward pressure on the price.
Q2: What is the XAG/USD pair?
XAG is the ISO 4217 currency code for one troy ounce of silver. USD is the code for the US Dollar. The XAG/USD pair shows how many US dollars are needed to purchase one ounce of silver.
Q3: Besides the US Dollar, what other factors influence the silver price forecast?
Key factors include global industrial demand (especially from solar panel and electronics manufacturing), real interest rates, geopolitical uncertainty, mining supply, and investment flows into silver-backed ETFs.
Q4: Is the current decline in silver a buying opportunity for long-term investors?
Some analysts view periods of dollar-induced weakness as potential entry points, given silver’s critical role in renewable energy and technology. However, timing the market is difficult, and diversification is always recommended.
Q5: How does silver’s price action typically compare to gold’s during dollar rallies?
Silver generally exhibits higher volatility than gold. During strong dollar rallies, silver often experiences larger percentage declines due to its lower liquidity and its hybrid identity as both a precious and industrial metal.
This post Silver Price Forecast: XAG/USD Plunges to Near $84.50 as Resilient US Dollar Dominates first appeared on BitcoinWorld.
– Written by
David Woodsmith
STORY LINK Pound Sterling to Dollar Forecast: GDP Miss Sparks Fresh GBP Sell-Off
The Pound to Dollar exchange rate (GBP/USD) slipped back towards three-month lows near 1.3250 on Friday as recession concerns and rising energy prices weighed heavily on Sterling.
Weak UK GDP data intensified fears that the economy may struggle to withstand the latest oil shock, while safe-haven demand and firmer crude prices continued to underpin the US dollar.
The Pound to Dollar (GBP/USD) exchange rate was subjected to renewed selling on Friday with a slide to just above 1.3250 and close to 3-month lows.
Risk appetite dipped amid fears over a prolonged increase in energy prices which helped underpin the dollar while the Pound was hit by weaker than expected GDP data with the risk that recession chatter will intensify.
A break of 1.3250 would risk a further decline to the 1.3200 area. An easing of Middle East fears and retreat in energy prices will be needed for a short-term GBP/USD rebound.
UK GDP was unchanged for January compared with consensus forecasts of a 0.2% increase and followed a 0.1% gain for December. There was no growth in the dominant services sector while a 0.2% increase in construction output was offset by a 0.1% retreat in industrial production.
Get better rates and lower fees on your next international money transfer.
Compare TorFX with top UK banks in seconds and see how much you could save.
RSM chief economist Thomas Pugh, commented; “Zero growth in January highlights just how little momentum the economy had coming into the energy crisis. That makes it more likely that growth will dip sharply below 1% this year, even if there is a swift resolution to the crisis.”
Tomasz Wieladek, chief European macro economist at T. Rowe Price was downbeat on the outlook; “The UK has been one of the weakest advanced economies in terms of recent growth performance. Therefore, the current oil price shock will most likely not just lead to inflation, but also push the UK economy into recession, raising unemployment and reducing GDP. Stagflation is just around the corner.”
Given fears over higher inflation, markets are now pricing in over an 80% chance that the Bank of England will raise rates by 25 basis points by the end of 2026.
ING noted difficulties for the Bank of England; “Don’t rule out UK growth picking up through the first quarter, despite a weak January. But the energy price spike risks a longer period of stagnation through 2026, as inflation rises, the jobs market keeps cooling and real wages fall back. We think the bar for a Bank of England rate hike is high.”
The dollar posted a further advance in global markets amid defensive demand due to the on-going Middle East crisis. Brent crude is trading close to $100 p/b, while equities have lost ground. The US has temporarily lifted oil sanctions on Russia.
Commerzbank forex strategist Volkmar Baur commented; “These statements now sound more like attempts to somehow lower the oil price again, to which the market seems to be responding less and less.”

International Money Transfer? Ask our resident FX expert a money transfer question or try John’s new, free, no-obligation personal service! ,where he helps every step of the way,
ensuring you get the best exchange rates on your currency requirements.
TAGS: Pound Dollar Forecasts
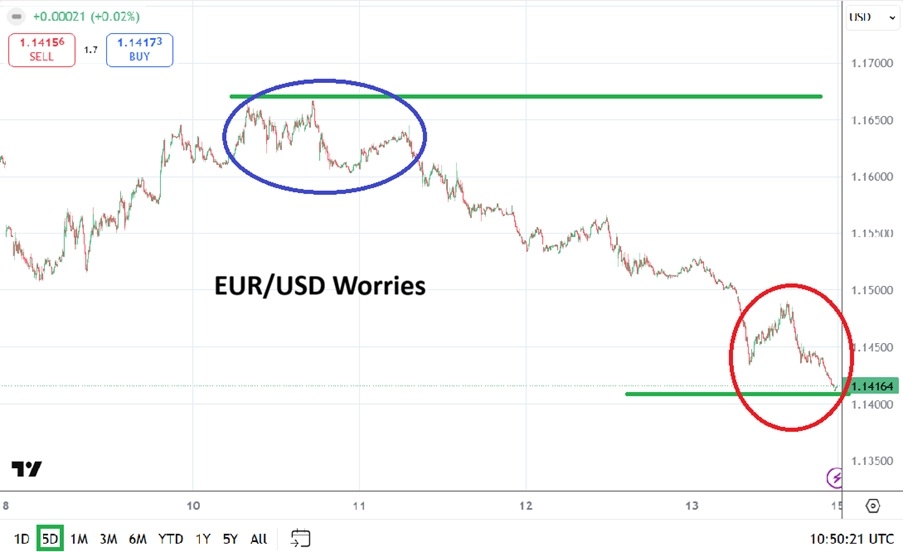
On the 27th of February the EUR/USD was around the 1.18300 vicinity and showing some signs of nervousness as financial institutions seemed to be situating themselves for potential conflict in the Middle East. The EUR/USD had touched highs around the 1.20500 level in late January. As of this weekend the currency pair is situated near 1.14165, touching lows not seen since early August of 2025.
The Iranian war has ignited worries in the financial arena globally. The EUR/USD has certainly felt headwinds as risk adverse sentiment has roared and certainly was sustained going into this weekend.
The EUR/USD is traversing important support levels perhaps in the minds of technical traders who may feel it is oversold. However, the current sentiment that is engulfing the broad markets may not pay attention to the current support levels and could take the EUR/USD lower.

The ability to rupture below the 1.15000 level on Friday and sustain selling is a signal that financial institutions are not comfortable. Global equities are struggling. And developing news this weekend regarding the Iranian war remains in dynamic flux. The war is entering the third week of fighting and is not about to develop into sudden peace.
While the U.S Federal Reserve is meeting this coming week and will announce their FOMC decision, there is little to no chance that the Fed can lower interest rates now. The price of WTI Crude Oil will have an impact on inflation globally and investors understand this dynamic. The EUR/USD’s lower range may find that it is tested once again as tomorrow’s price action begins. The notion that the currency pair is oversold may feel correct, but near-term sentiment remains anxious at best, and outright nervous for many.
Logically many traders including large players in the EUR/USD may perceive the currency pair is oversold, and this may certainly prove to be correct. But shifting fluctuations are likely to remain rather fast and inexperienced speculators should brace themselves for emotional tests if they are wagering.
Timeframes matter for day traders and looking for reversals higher will be tempting but very dangerous.
Momentum pushes upwards may develop, but speculators who do not have deep pockets should remain quite cautious, particularly early on Monday as global markets open after having digested new Iranian war developments which will continue to manifest throughout Sunday.
Behavioral sentiment remains fragile and barometers including the prices of WTI Crude Oil and U.S 10 Year Treasury yields should be watched by EUR/USD participants in the coming days.
Forex trading is likely to remain quite challenging this week. Financial institutions certainly are nervous and this has caused widespread buying of the USD against most major currencies. The EUR/USD which was trading quite contently with positive sentiment above the 1.18000 from late January until late February has vanished. Looking for a return to higher values in the near-term may prove to be wishful thinking. Traders with bias towards the EUR need to be careful and make sure they understand short and near-term wager contemplation may not match their their mid-term outlooks.
The coming week of trading in the EUR/USD is going to remain hectic. Day traders may want to look for quick hitting tests while using strict entry orders and take profit targets. The temptation to believe the EUR/USD has been oversold may feel correct, but that doesn’t mean that financial institutions will pay attention. Equity indices should be watched, if the major U.S indices like the S&P 500 remain under pressure this might create headwinds for the EUR/USD in the near-term too.
Ready to trade our weekly forecast? We’ve shortlisted the best European brokers in the industry for you.
I wrote on 8th March that the best trades for the week would be:
Long of Gold following a daily (New York) close above $5,418.55. This did not set up.
Long of Wheat.
A summary of last week’s most important data in the market:
USA CPI (inflation) – as expected at an annualized rate of 2.4%.
US Core PCE Price Index – as expected at 0.4% month-on-month.
US Preliminary GDP – lower than expected at 0.7% over the quarter when a reading as high as 1.4% was expected, which may contribute to bearish sentiment in the US stock market.
US JOLTS Job Openings – slightly higher than expected.
US Unemployment Claims – as expected.
UK GDP – lower than expected, with no change month-on-month while an increase of 0.2% was expected.
Canada Unemployment Rate – unexpectedly ticked higher to 6.7% while 6.6% was expected.
Last week’s data had very little effect on the market. What did affect the market was the ongoing and escalating war in the Middle East, which has pushed the price of crude oil higher, damaged the economies of the Gulf states which are suffering from attacks from Iran, and raised tension between the USA and China. There are open and frightening questions over how this war might end, with the parties on the bring of seriously escalating by targeting critical energy and infrastructure.
Clearly, the USA and Israel are successfully striking all the targets they want to inside Iran, while suffering very few casualties themselves. There is damage to US bases and facilities near the Gulf, and relatively minor damage in Israel. There is massive damage to Iran’s regime and military. What is far from clear is the fate of the Iranian regime and the large supply of enriched uranium which is somewhere in Iran.
Prediction markets see this war continuing for at least another two weeks. It is very unlikely to stop quickly, which increases the potential for it to disrupt or influence markets.
A large-scale Israeli invasion of Lebanon is also on the table, after Hezbollah entered the war on Iran’s side and began attacking Israel, although this is unlikely to affect markets much.
Iran has begun striking economic targets in the Gulf states, as well as certain oil infrastructure.
We are on the brink of a serious escalation.
The middle east war is likely to remain more influential that any economic data releases which are scheduled over the coming week. Having said that, we will see an unprecedented seven major central bank policy meetings within the same week!
The coming week’s most important data points, in order of likely importance, are:
US Federal Reserve Policy Meeting
US PPI
Reserve Bank of Australia Policy Meeting (rate hike of 0.25% is expected)
Bank of Japan Policy Meeting
European Central Bank Policy Meeting
Bank of England Policy Meeting
Bank of Canada Policy Meeting
Canadian CPI (inflation)
Swiss National Bank Policy Meeting
US Unemployment Claims
New Zealand GDP
Australia Unemployment Rate
UK Unemployment Claims
It will be a public holiday in Japan on Friday.
Currency Price Changes and Interest Rates
For the month of March, I made no monthly Forex forecast as the US Dollar was not in a clear trend at the start of the month.
Last week saw no currency crosses with excessive volatility, so I am making no forecast for the coming week.
The US Dollar was again the strongest major currency last week, while the New Zealand Dollar was the weakest. Directional volatility decreased slightly last week, with 37% of all major pairs and crosses changing in value by more than 1%.
Next week’s volatility is likely to increase and might be exceptionally high due to the escalation of the war in the Middle East, which is now threatening oil facilities, which might generate volatility in the US Dollar, the Japanese Yen, and the Canadian Dollar, not to mention stock markets. There could also be unforeseen side effects which might affect other currencies.
You can trade these forecasts in a real or demo Forex brokerage account.
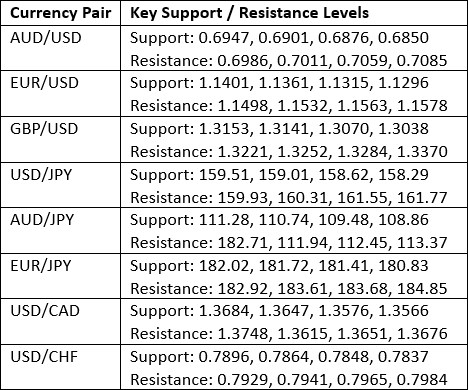
Key Support and Resistance Levels
The US Dollar had its strongest week since November, powering higher to close at a fresh 9-month high price with an unusually large candlestick which closed right on the high of its range. These are very bullish signs. The price is obviously in a valid long-term trend and has further room to rise before reaching the key resistance level at 101.39.
There are three reasons for the greenback’s strength:
The Fed is looking less likely to cut rates in 2026, with the CME FedWatch tool now showing the markets are barely expecting a single cut of 0.25%, at the Fed’s December meeting. The 2-Year Treasury Yield has risen to a level not seen since August 2025.
The escalating war in the Middle East which is now seriously threatening to meaningfully restrict global supplies of crude oil and potentially trigger a more hostile relationship between the USA and China, is generating a flight into the US Dollar. The war is also starting to impact Gulf states such as the U.A.E. which are increasingly being targeted by Iran.
Nervous markets are seeing liquidation of American stock positions, meaning American equity is being redeemed into Dollars, raising demand for Dollars.
It is very hard to see this situation changing over the coming week, unless there will be a highly surprising sudden end to the war in the Middle East. I will be very confident being long of the US Dollar over the coming week.
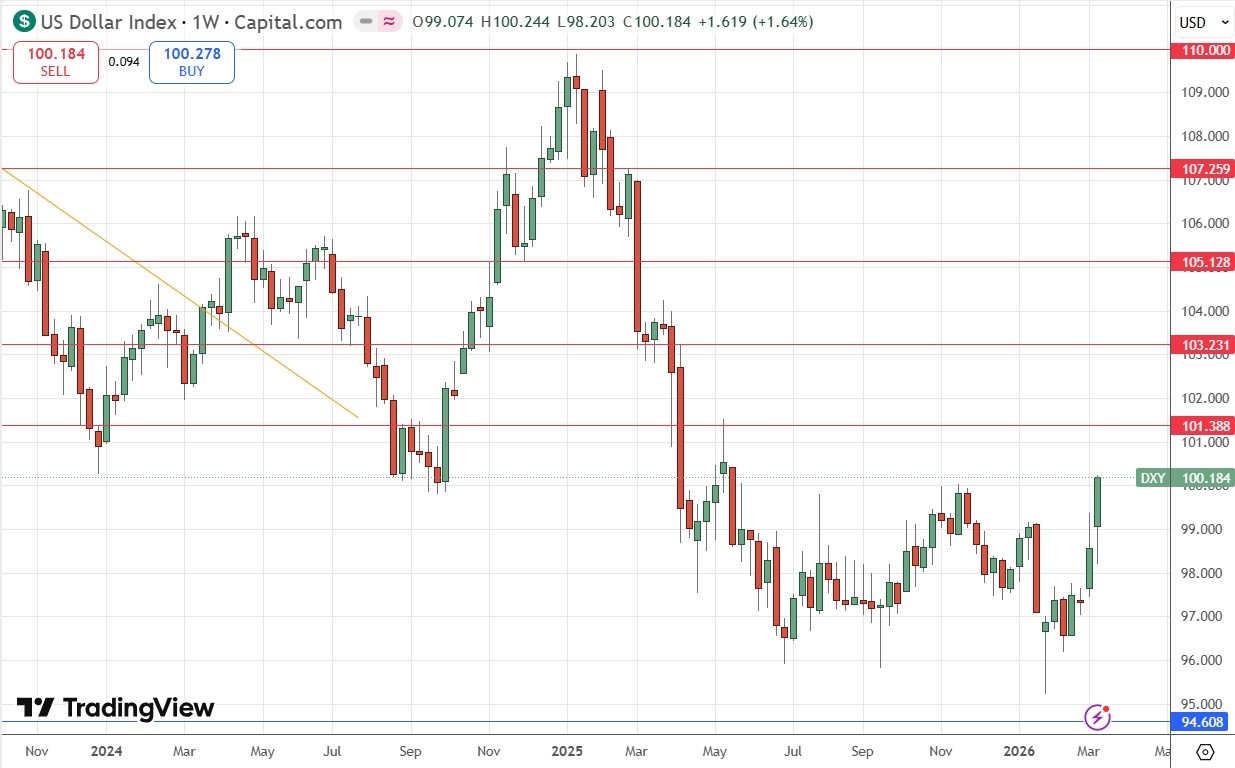
US Dollar Index Weekly Price Chart
The USD/JPY currency pair gained strongly last week, closing right on the high of its range with a reasonably large bullish candlestick at an 18-month high. These are bullish signs and I am long of this currency pair. The only doubt I have is that we have not yet cleared the big round number at ¥160 which has acted as resistance for a long time.
Another technically encouraging sign is the bullish breakout we saw a few weeks ago from the narrowing triangle formation that can be seen within the price chart below, although this does not prove much for the future, just that we have had a nice technical breakout which now continues into blue sky.
I explained above why the US Dollar is the strongest of all the major currencies, and why this is likely to continue over the coming week. As for the Japanese Yen, although the Bank of Japan would like to raise its rates, it is having great difficulty in doing so due to the high level of debt in Japan. The Japanese Yen has been in a long-term bearish trend.
There are excellent fundamental, sentimental, and technical reasons to be long here, but more cautious traders might want to wait for a New York close above ¥160 before going long.
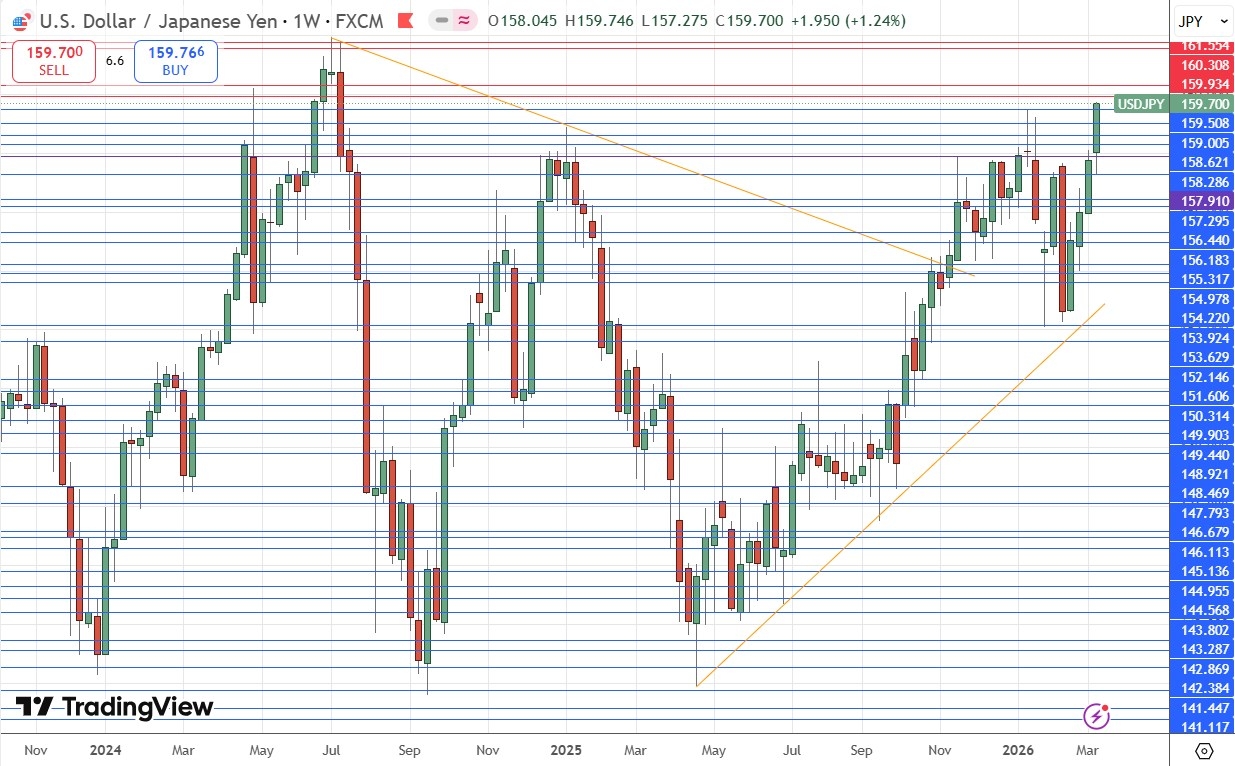
USD/JPY Weekly Price Chart
WTI Crude Oil rose last week, but not by much, as President Trump had some success in talking the price down by hinting the war would end soon, even though there was really no such early end on the table at all.
Despite the small rise overall, the price briefly reached $120 on Monday before falling back, but as the daily chart below shows, it is rising again, and the price action looks bullish.
The war in the middle east was showing signs of escalating during the second half of last week, with the rumour that Iran had begun mining the Strait of Hormuz through which about 20% of the world’s crude oil transits keeping a bid in the price.
However, after markets closed on Friday for the weekend, news came that the US sent in heavy bombers to wipe out all the military defenses on Kargh Island, an island just off the coast of Iran near Iraq and Kuwait at the end of the Gulf, which processes 90% of Iran’s crude oil exports. President Trump has publicly threatened to devastate the oil facilities there, or at least to “reconsider” his decision to spare them, if Iran does not start to allow free passage through the Strait of Hormuz. However, President Trump has also made it clear that he expects other nations to step up and help in opening the Strait. Effectively, Trump knows that the USA is not affected directly by the closure of the Strait, so he is expecting other countries to take care of their own problem. Ironically, this might calm the price of crude oil as nobody really expects other countries to do much about Hormuz. However, the effective closure of Hormuz is going to eventually send the price well above $100 if it persists.
It is likely to be dangerous to enter now as we could easily see a fast and huge move in the price either up or down. However, the price action does look bullish, and the long trend trade from the breakout near $65 will have survived for most trend following systems, so longs will still be dominating orders.
If you do go long, do it with a very small position size that reflects the enormously high volatility which we see in the price now.
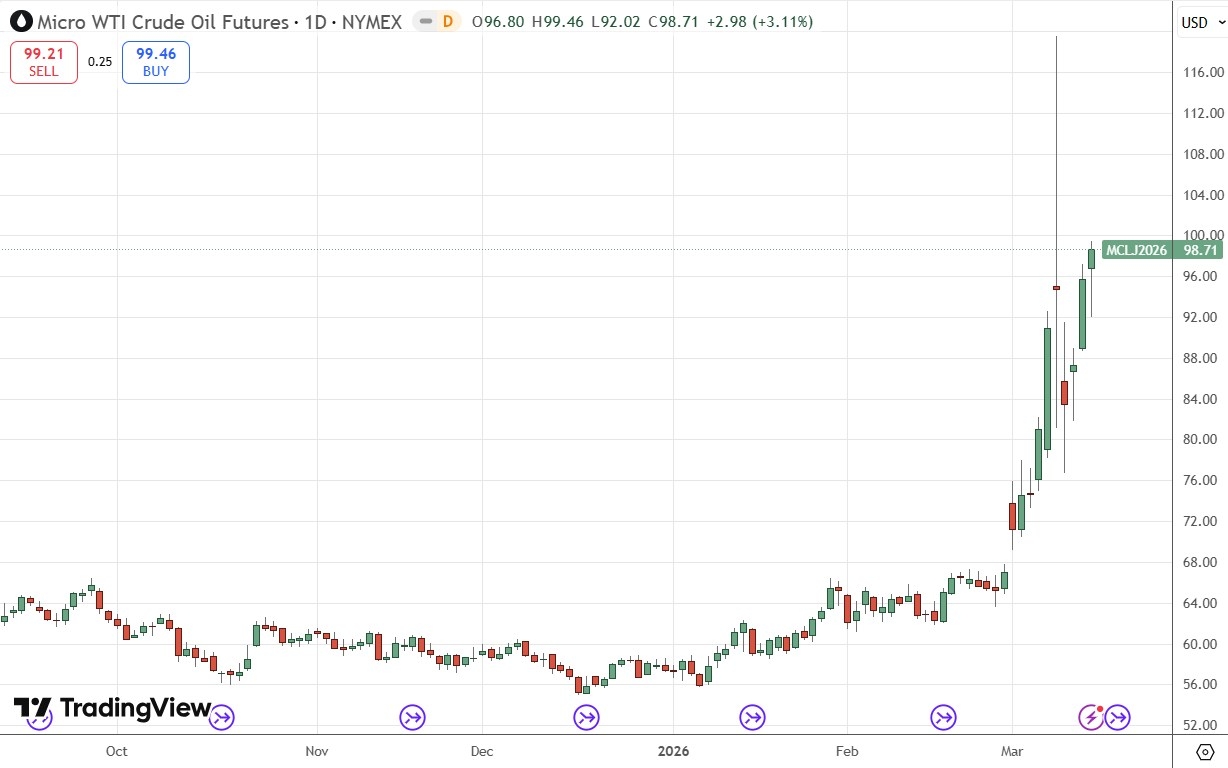
WTI Crude Oil Daily Price Chart
RBOB Gasoline futures briefly traded at a new 3-year high last week before falling back, but like Crude Oil, the price action remains bullish.
This is all about what I wrote just above concerning WTI Crude Oil. As the price of crude oil rises, so the price of Gasoline is almost certain to rise with high positive correlation between the two assets, as gasoline is derived by refining crude oil.
As I wrote above, it might be too late for a long trade, and if you do feel you have to go long here, use a very small position size (respect the very high volatility) and a trailing stop to avoid a catastrophic loss. Remember that what goes up very hard and very fast can come down just the same way.
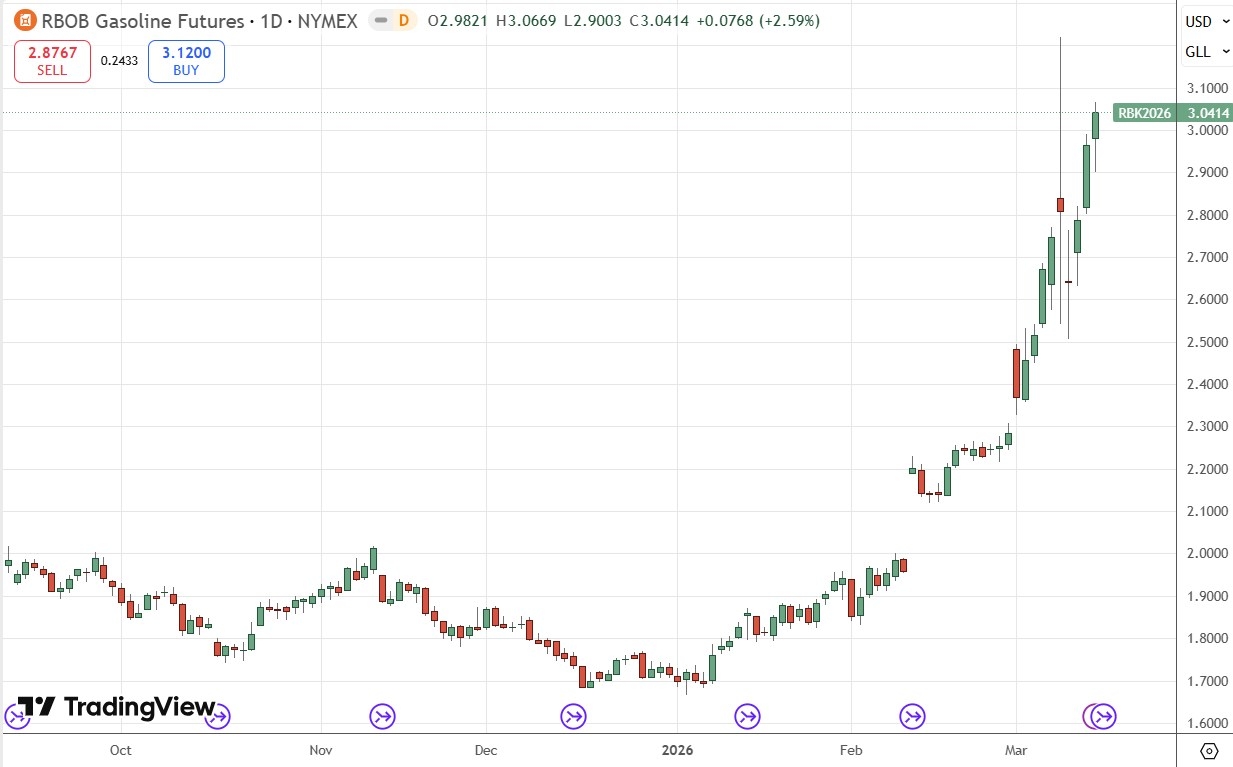
RBOB Gasoline Futures Daily Price Chart
ZW Wheat futures are slightly lower over the week, after reaching their highest price in a year during the previous week but ended the week on a strong note with bullish price action which suggests technically that new highs are going to be reached. Many analysts see the ongoing middle east war as pushing the price of grains up but there are deeper reasons relating to supply issues in the grain markets and changes to the wheat business in the USA.
If Wheat futures are too big for you (and they probably are), you can get exposure to US Wheat by buying the Teacrium Wheat Fund (WEAT) which is an ETF and very affordable.
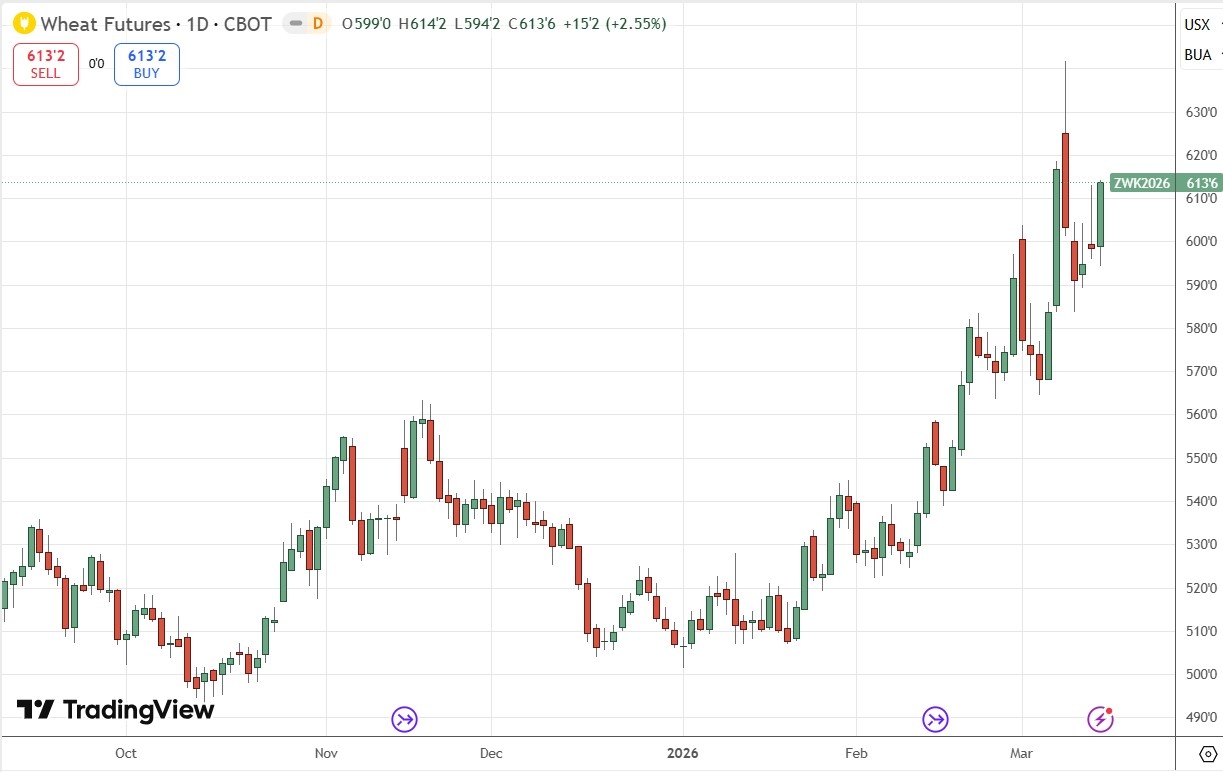
Wheat Futures Daily Price Chart
Last week was poor for the US stock market, with the S&P 500 Index not only closing lower, but ending the week right on its low of the week after breaking below the long-term support level at 6,737.
Technically, things are looking firmly bearish. Look at the topping price action underneath and just touching the big round number at 7,000 which we have seen over recent weeks, and the way the price has started to move lower from there with growing momentum.
I see the price quite quickly reaching the other significant round number at 6,500 or possibly stopping at the horizontal support at 6,522. This area is likely to be strong support and the 200-day moving average is not far below which gives even more supportive confluence. If the price breaks below all that, the market really will be in big trouble.
The US stock market, and stock markets generally, are looking bearish for two reasons:
The over-extended and massive bull market which ran for a long time.
The escalating war in the Middle East which is threatening to cause serious damage to global oil supplies and the economies of the Gulf states.
Despite the bearish outlook, shorting the US stock market, especially an Index, is not easy, and should only be attempted by experienced traders.
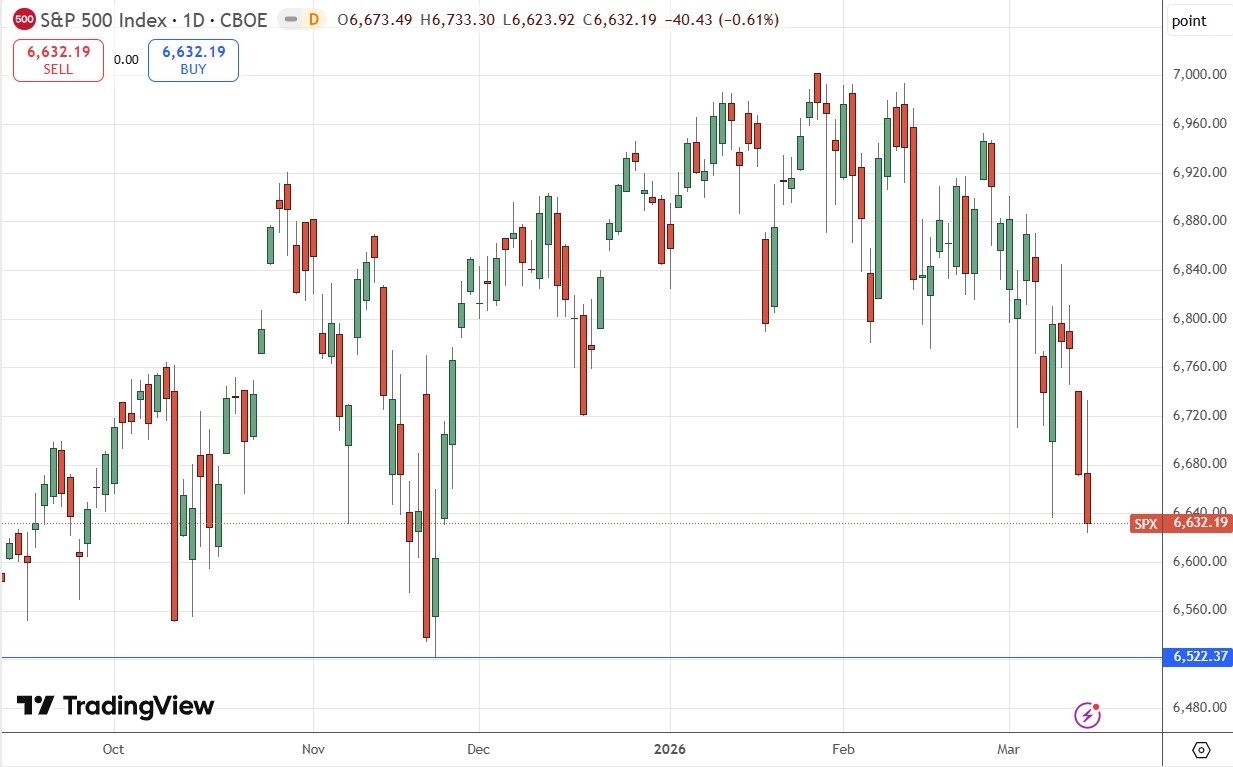
S&P 500 Index Daily Price Chart
I see the best trades this week as:
Long of the USD/JPY currency pair.
Long of Wheat.
Ready to trade our weekly Forex forecast? Check out our list of the top 10 Forex brokers in the world.