About Editorial team of BIPNs

Main team of content of bipns.com. Any type of content should be approved by us.
11 07, 2026

Pound to Dollar Forecast: GBP Holds Firm Despite USD Recovery

By |2026-07-11T04:16:04+03:00July 11, 2026|Forex News, News|0 Comments


– Written by

The Pound to Dollar exchange rate (GBP/USD) slipped back from 20-day highs near 1.3400 as renewed Middle East tensions encouraged investors to rotate back into the US Dollar. Despite the pullback, Sterling remained relatively resilient, with markets continuing to favour the Pound on improving UK sentiment while awaiting fresh clues on the Federal Reserve’s policy outlook.

GBP/USD Forecasts: 3-Week Highs

The Pound to Dollar (GBP/USD) exchange rate posted a strong advance to 3-week highs at 1.3430 in Asian trading on Thursday before a significant retreat to near 1.3400.

A break above 1.3450 could trigger a challenge on 2-month highs in the 1.36 area.

The dollar and Pound have both continued to gain traction in global markets with the focus on energy prices and yields.

The dollar gained initial support from a dip in risk appetite, but asset prices overall were resilient while higher yields underpinned the Pound.

ING commented; “High-yielding currencies can enjoy better insulation against the stronger dollar given the summer months and investors’ tendency to jump into carry trade positions on any sell-off.”

Save on Your GBP/USD Transfer

Get better rates and lower fees on your next international money transfer.
Compare TorFX with top UK banks in seconds and see how much you could save.


Compare the Best GBP/USD Rates »

There will, however, still be unease over underlying UK fiscal trends and a further increase in yields could start to undermine the Pound, especially if there are renewed fears over the economic policies under Prime Minister Burnham.

After strong gains on Wednesday, oil prices were little changed, but with a gain of over 10% this week.

Kyle Rodda, senior financial market analyst at Capital.com commented; “A flare-up of Middle East tensions has rattled global markets again and jammed a war risk premium back into asset prices.”

There are also potential implications for Federal Reserve policy

Rodda added; “A jump in oil prices could bring forward the timing of a Fed hike.”

According to ING; “Our bias is that higher energy prices will provide fuel for the Fed hawks and keep the dollar supported on dips – particularly against the low yielders.

MUFG also noted potential risks; “If tensions in the region were to intensify further and the price of oil continue to rise sharpy, it could reinforce the USD’s recent upward momentum especially now that the Fed has indicated that it is open to raising rates this year. US yields moved back towards recent highs yesterday.”

Minutes from June’s Federal Reserve minutes suggested two clear scenarios. One group indicated that rate cuts will be delayed while another section will want a near-term rate hike if inflation remains high.

MUFG is still cautious over the dollar outlook; “Overall, the minutes support our view that the new Fed Chair Warsh will favour leaving rates on hold if energy prices remain at lower levels. We expect the US dollar to give back recent gains if Fed rate hike expectations are disappointed, although acknowledged that renewed tensions in the Middle East pose upside risks.”

Like this piece? Please share with your friends and colleagues:


International Money Transfer? Ask our resident FX expert a money transfer question or try John’s new, free, no-obligation personal service! ,where he helps every step of the way,
ensuring you get the best exchange rates on your currency requirements.

TAGS: Pound Dollar Forecasts

Source link

11 07, 2026

WTI Crude Oil: Elliott Wave Analysis and Forecast for 10.07.26–17.07.26

By |2026-07-11T04:04:06+03:00July 11, 2026|Forex News, News|0 Comments


The article covers the following subjects:

Major Takeaways

  • Main scenario: Consider long positions from corrections above 67.00 with a target of 91.80–105.17. A buy signal: the price holds above 67.00. Stop Loss: below 65.50, Take Profit: 91.80–105.17.
  • Alternative scenario: Breakout and consolidation below 67.00 will allow the asset to continue declining to the levels of 62.00–58.50. A sell signal: the level of 67.00 is broken to the downside. Stop Loss: above 68.50, Take Profit: 62.00–58.50.

Main Scenario

Consider long positions from corrections above 67.00 with a target of 91.80–105.17.

Alternative Scenario

Breakout and consolidation below 67.00 will allow the asset to continue declining to the levels of 62.00–58.50.

Analysis

A descending correction appears to have formed as the second wave of larger degree (2) on the weekly chart, with wave C of (2) completed as its part. On the daily time frame, an ascending third wave (3) is likely developing. Within it, the first wave of smaller degree 1 of (3) has formed, and a downward correction has been completed as the second wave 2 of (3). Wave 3 of (3) has presumably started developing on the H4 time frame, with wave (i) of i of 3 forming as its part. If the presumption is correct, WTI will continue to rise to 91.80–105.17. The level of 67.00 is critical in this scenario as a breakout below it will enable the asset to continue declining to the levels of 62.00–58.50.


This forecast is based on the Elliott Wave Theory. When developing trading strategies, it is essential to consider fundamental factors, as the market situation can change at any time.

Price chart of USCRUDE in real time mode

The content of this article reflects the author’s opinion and does not necessarily reflect the official position of LiteFinance broker. The material published on this page is provided for informational purposes only and should not be considered as the provision of investment advice for the purposes of Directive 2014/65/EU.


According to copyright law, this article is considered intellectual property, which includes a prohibition on copying and distributing it without consent.

Rate this article:

{{value}} ( {{count}} {{title}} )


Source link

11 07, 2026

USD/JPY: Elliott Wave Analysis and Forecast for 10.07.26–17.07.26

By |2026-07-11T00:15:18+03:00July 11, 2026|Forex News, News|0 Comments

The article covers the following subjects:

Major Takeaways

  • Main scenario: Consider long positions from corrections above 160.35 with a target of 165.00–170.00. A buy signal: the price holds above 160.35. Stop Loss: below 159.80, Take Profit: 165.00–170.00.
  • Alternative scenario: Breakout and consolidation below 160.35 will allow the pair to continue declining to the levels of 158.90–158.00. A sell signal: the level of 160.35 is broken to the downside. Stop Loss: above 160.90, Take Profit: 158.90–158.00.

Main Scenario

Consider long positions from corrections above 160.35 with a target of 165.00–170.00.

Alternative Scenario

Breakout and consolidation below 160.35 will allow the pair to continue declining to the levels of 158.90–158.00.

Analysis

On the weekly time frame, an ascending third wave of larger degree 3 has formed, a downward correction has been completed as the fourth wave 4, and the fifth wave 5 is developing. On the daily chart, the third wave of smaller degree (3) of 5 appears to be developing, with wave 3 of (3) forming as its part. On the H4 time frame, wave i of 3 has formed, a local correction has been completed as wave ii of 3, and wave iii of 3 has started developing. If the presumption is correct, USD/JPY will continue to rise to 165.00–170.00. The level of 160.35 is critical in this scenario as a breakout below it will enable the pair to continue declining to the levels of 158.90–158.00.


This forecast is based on the Elliott Wave Theory. When developing trading strategies, it is essential to consider fundamental factors, as the market situation can change at any time.

Price chart of USDJPY in real time mode

The content of this article reflects the author’s opinion and does not necessarily reflect the official position of LiteFinance broker. The material published on this page is provided for informational purposes only and should not be considered as the provision of investment advice for the purposes of Directive 2014/65/EU.


According to copyright law, this article is considered intellectual property, which includes a prohibition on copying and distributing it without consent.

Rate this article:

{{value}} ( {{count}} {{title}} )


Source link

11 07, 2026

Forecast update for EURUSD -10-07-2026

By |2026-07-11T00:03:11+03:00July 11, 2026|Forex News, News|0 Comments


The EURJPY pair repeated providing negative closes below the barrier at 185.85, forcing it to delay the bullish trend, to activate the bearish corrective trend by reaching 184.75.


Suffering new negative pressure makes us resume the corrective attempts, attempting to reach 184.55, to press on the support at 184.20 to find an exit to resume the negative trading, while breaching the barrier will confirm its readiness to record new gains by its rally towards 186.20 and 186.60.


The expected trading range for today is between 184.20 and 185.60


Trend forecast: Bearish


Source link

10 07, 2026

The GBPJPY losses the positive momentum– Forecast today – 10-7-2026

By |2026-07-10T20:13:42+03:00July 10, 2026|Forex News, News|0 Comments

The GBPJPY pair approached the extra target at 218.10 by its last bullish rally, but its neediness to the bullish momentum by stochastic attempt to exit the overbought level that pushed it to form corrective rebound, to settle near 217.00.


The continuation of the trading fluctuation below the barrier at 118.10 makes us expect forming corrective trading, to target 216.30 level reaching the extra support near 215.45, while breaching the barrier and holding above it will open the way for resuming the bullish trend, reminding you that the stability of the next main target near 218.65 level.


The expected trading range for today is between 216.55 and 218.10


Trend forecast: Fluctuated within the bullish trend


Source link

10 07, 2026

Platinum price repeats the sideways fluctuation– Forecast today – 10-7-2026

By |2026-07-10T20:02:11+03:00July 10, 2026|Forex News, News|0 Comments


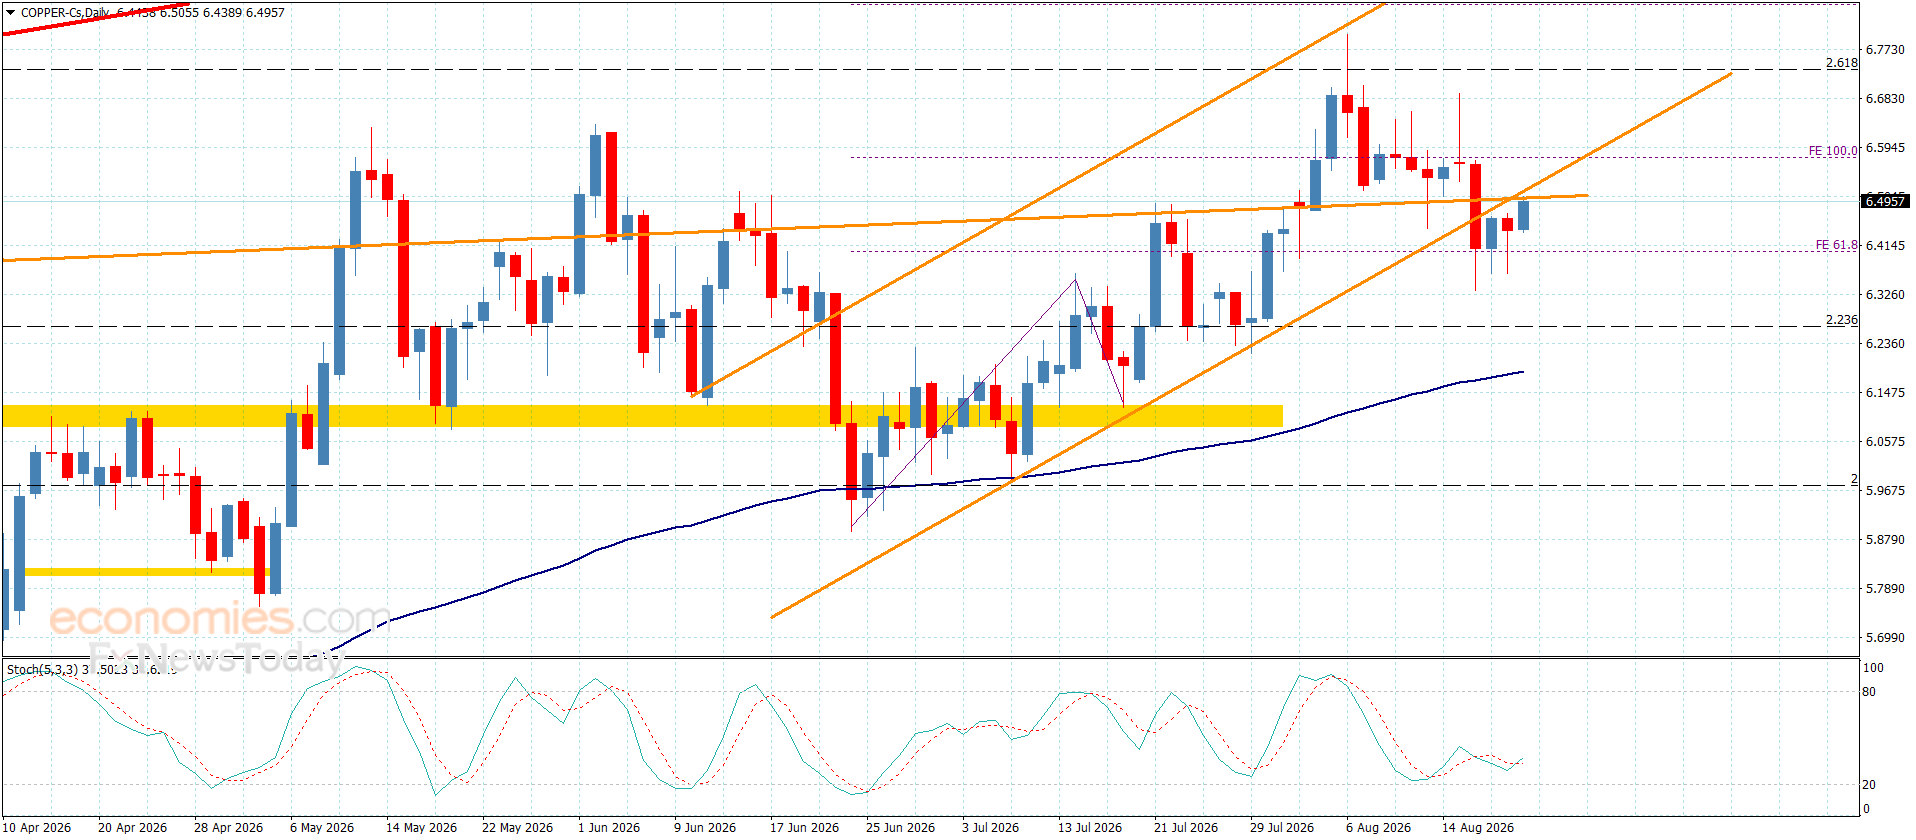
Copper price failed to break $2.9500 level, affected by the stability of the moving average 55 near it, forcing it to delay the corrective decline and forming some bullish waves, to settle near $6.2000.


The current bullish rally doesn’t affect the bearish corrective trend due to the stability below $6.3000 barrier, which makes us wait for gathering the negative momentum again, which allows it to renew the pressure on the barrier at $5.9500 to find an exit for targeting new bearish stations that begin at $5.8100, while breaching the barrier and holding above it will open the way for recording extra gains that might begin at $6.4600.


The expected trading range for today is between $5.9500 and $6.3000


Trend forecast: Bearish


Source link

10 07, 2026

The EURJPY surrenders to the stability of the barrier– Forecast today – 10-7-2026

By |2026-07-10T16:12:15+03:00July 10, 2026|Forex News, News|0 Comments

The GBPJPY pair approached the extra target at 218.10 by its last bullish rally, but its neediness to the bullish momentum by stochastic attempt to exit the overbought level that pushed it to form corrective rebound, to settle near 217.00.


The continuation of the trading fluctuation below the barrier at 118.10 makes us expect forming corrective trading, to target 216.30 level reaching the extra support near 215.45, while breaching the barrier and holding above it will open the way for resuming the bullish trend, reminding you that the stability of the next main target near 218.65 level.


The expected trading range for today is between 216.55 and 218.10


Trend forecast: Fluctuated within the bullish trend


Source link

10 07, 2026

Silver Price Forecast: XAG/USD Surges To Near $59 As US Dollar Weakens

By |2026-07-10T16:01:03+03:00July 10, 2026|Forex News, News|0 Comments


Source link

10 07, 2026

GBP/USD Forecast 10/07: Chaos Triggers Range (Video)

By |2026-07-10T12:10:48+03:00July 10, 2026|Forex News, News|0 Comments

The British pound initially rallied against the USD on Thursday but seems to be running into a touch of trouble.

GBP/USD

The British pound initially rallied against the US dollar during trading here on Thursday, and it then tested an area that was a major resistance barrier just waiting to happen, where supply had come into the market aggressively several days ago. Now we find ourselves trying to form a bit of a shooting star just above the 200-day EMA. We have to ask whether or not the sellers are going to get aggressive.

Interest rates in America did dip just a touch. I think you also have a situation where it’s difficult to get aggressive against the US dollar, although you can certainly make an argument if there is one currency that probably has a good shot at really taking it to the US dollar, it’s the British pound.

Middle East Chaos and Range Dynamics

That being said, I think there are a lot of questions right now about what’s going to happen next in the Middle East, and that’s causing some chaos. The markets, I believe, continue to just hang around this area, and I just don’t see how markets are looking for a big move in one direction or the other. This is a currency pair that tends to range quite a bit, and we are basically in the middle of the range from last year. So, a little bit of hesitation here makes sense. Maybe a short-term selling opportunity, but I think you’re somewhat in no man’s land.

I did this yesterday, I put this out, and I suggested that maybe the British pound is a great measure of the US dollar. If the pound starts to fall, then that means your dollar is going to strengthen against multiple other currencies. If the US dollar starts to fall apart, you should see the pound be one of the biggest beneficiaries. So, I think this is still very much a tertiary indicator more than anything else.

Ready to trade our daily Forex GBP/USD analysis? We’ve made this UK forex brokers list for you to check out.

Christopher Lewis is a technical analyst and market commentator at DailyForex with more than two decades of trading experience in Forex and other leveraged markets. Based in Columbus, Ohio, he specializes in chart-based analysis of major currency pairs, stock indices, commodities, and energy markets, focusing on clear support and resistance levels, trend structure, and risk management. Christopher produces daily written and video analysis for traders who rely on technical setups to navigate volatile market conditions

As seen on: Pairs Of Aces Podcast,The Trader Guy, FXEmpire

Source link

10 07, 2026

Coffee prices today July 10th: Continue to increase sharply, approaching 100,000 VND/kg

By |2026-07-10T11:58:44+03:00July 10, 2026|Forex News, News|0 Comments


Domestic coffee prices today

Coffee prices today in the domestic market simultaneously increased very strongly in key production areas. The average price was recorded at 98,300 VND/kg, an increase of 6,000 VND/kg compared to the previous update.

In Dak Lak, coffee prices increased by 6,000 VND/kg, to 98,200 VND/kg. In Gia Lai, coffee prices reached 98,300 VND/kg, also increasing by 6,000 VND/kg.

In Lam Dong, coffee prices today increased by 6,100 VND/kg, to 97,900 VND/kg. This is still the lowest level among the surveyed areas.

The old Dak Nong area recorded the highest purchase price, reaching 98,400 VND/kg, an increase of 6,100 VND/kg compared to the previous update.

Thus, domestic coffee prices currently fluctuate from 97. 900-98. 400 VND/kg. The gap between the region with the highest and lowest prices is 500 VND/kg.

After a strong increase session, the domestic coffee price level has approached the threshold of 100,000 VND/kg. This is a notable increase after two previous deep decline sessions.

The USD/VND exchange rate according to Vietcombank is recorded at 26,074 VND/USD.

World coffee prices

World coffee prices simultaneously increased sharply in the most recent trading session. Both Robusta on the London exchange and Arabica on the New York exchange recorded large increases.

On the London exchange, the September 2026 Robusta futures contract increased by 302 USD/ton, equivalent to 8.07%, to 4,043 USD/ton.

During the session, this contract at one point increased to 4,066 USD/ton. Trading volume reached 14,265 lots.

Robusta for November 2026 delivery increased by 290 USD/ton, equivalent to 7.81%, to 4,002 USD/ton.

The January and March 2027 terms increased by 285 USD/ton and 282 USD/ton respectively, to 3,967 USD/ton and 3,933 USD/ton.

The July 2026 Robusta contract reached 4,603 USD/ton, up 171 USD/ton. However, this term has low trading volume because it is close to maturity, so the September contract reflects the market trend more clearly.

On the New York exchange, Arabica increased very strongly. September 2026 Arabica futures contract increased by 38.10 US cents/lb, equivalent to 12.30%, to 347.90 US cents/lb.

During the session, this contract at one point increased to 348.55 US cents/lb. Trading volume reached 34,370 lots.

Arabica December 2026 futures increased by 30.95 US cents/lb, equivalent to 10.41%, to 328.20 US cents/lb.

The March and May 2027 terms increased by 28.80 US cents/lb and 27.85 US cents/lb respectively, to 321.00 US cents/lb and 318.30 US cents/lb.

The July 2026 Arabica contract increased by 32.70 US cents/lb, to 356.95 US cents/lb. However, this term has lower volume than long-term contracts because it is close to maturity.

Coffee price assessment

Domestic coffee prices surged sharply after two consecutive deep declines. This development is accompanied by a very strong recovery of Robusta and Arabica prices in the world market.

In the short term, the coffee market is fluctuating strongly due to the intertwined impact between profit-taking activities, buying force returning after deep declines and cautious psychology in the face of weather risks in large production areas.

The fact that Arabica prices increased by more than 12% and Robusta increased by more than 8% shows that buying power has returned quite strongly on the two exchanges. With the domestic market, the upward momentum of world prices often quickly affects buying and selling sentiment, especially when the price level has fluctuated strongly in recent sessions.

However, it should be noted that too strong uptrends often come with technical correction risks. After coffee prices increase rapidly, profit-taking activities may appear in the market, causing prices to continue to fluctuate strongly in the following sessions.

From a global supply-demand perspective, a report by the International Coffee Organization (ICO) shows that the market previously reacted to the prospect of improved supply. This is a factor that may limit the upward momentum of coffee prices in the medium term.

For Brazil, the Foreign Agricultural Services Agency of the US Department of Agriculture (USDA/FAS) said that the Brazilian National Supply Company (CONAB) forecasts Brazil’s coffee production in the 2026-2027 crop year to reach 66.7 million bags, an increase of 18% compared to 2025.

Brazil is the world’s largest Arabica producer. Therefore, the prospect of a large crop in this country is still an important factor that could put pressure on Arabica prices, although the short-term market is still sensitive to weather risks and harvest progress.

Rabobank of the Netherlands also assessed that the expectation of a large coffee crop in Brazil may put pressure on global prices, in the context of generally favorable weather conditions for crop development.

With Robusta, supply from our country continues to be a noteworthy factor. The USDA/FAS report in Vietnam forecasts that Vietnam’s coffee production in the 2026-2027 crop year will increase to 32.5 million bags converted to green beans, thanks to production expansion after a period of high coffee prices.

Our country is the world’s largest Robusta producer, so the prospect of increased production may put pressure on Robusta in the medium term. However, in the short term, prices may still fluctuate sharply due to export demand, inventory and developments on international exchanges.


Source link

Go to Top