Category: Crypto News, News
Can SOL Reach $300 or Even $500?
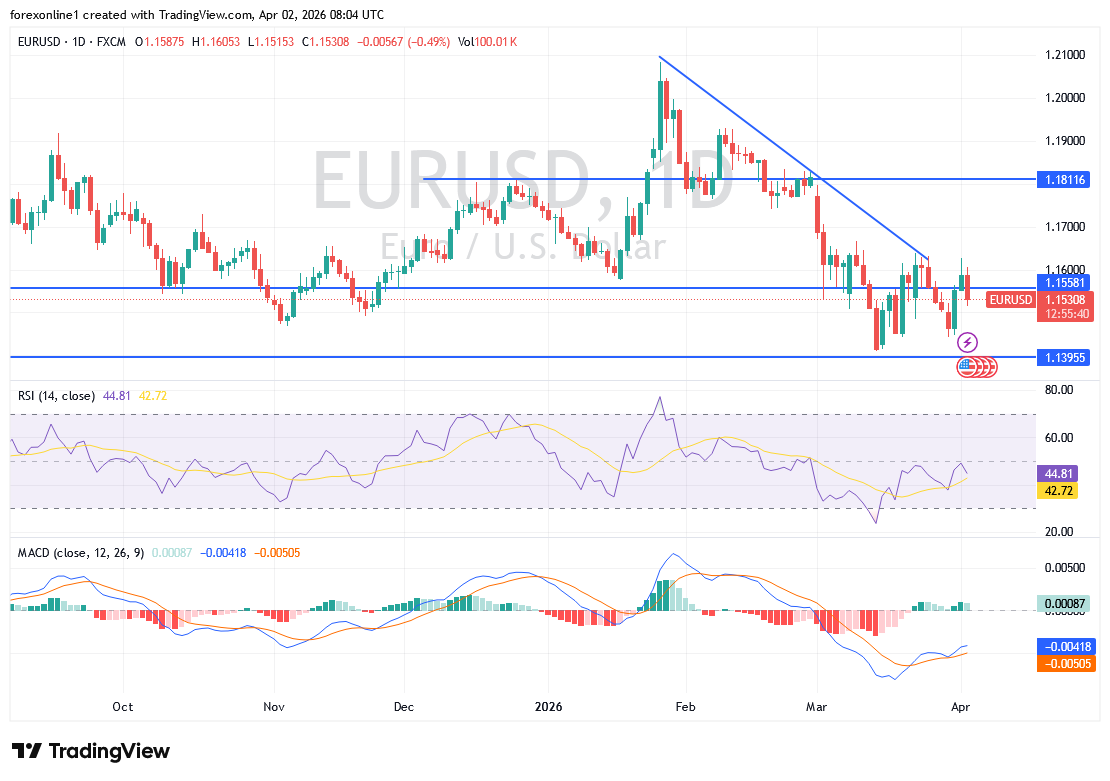
daily chart reveals a symmetrical triangle pattern forming, marked by descending resistance around $156 and ascending support near $143. This structure suggests a tightening price range that typically precedes a significant breakout or breakdown.
Currently, SOL is hovering near the lower boundary of the triangle, putting immediate focus on whether support can hold or if downside pressure will prevail.

The price is trading below all major EMAs, indicating ongoing bearish sentiment and technical resistance across multiple timeframes. A decisive move above these averages, particularly above $156, would signal renewed bullish momentum.
Additionally, the 0.236 Fibonacci retracement level at $142.65 is aligning closely with the triangle support. A breakdown below this key level could open the door for further downside, potentially reaching $131 or even $120 in a more extended sell-off.


Written by : Editorial team of BIPNs
Main team of content of bipns.com. Any type of content should be approved by us.


Share this article: