
Category: Crypto News, News
Cardano Price Prediction: On-Chain Growth Clashes With Bearish Signals in Tight Market Range
Cardano struggles near key support zones, with short-term indicators flashing weakness despite steady on-chain growth.
Cardano is showing mixed signals that have traders on edge. While long-term growth in active addresses remains a positive sign, several technical indicators are starting to flash warning signs. According to analyst Alpha Crypto Signal, ADA is now forming an inverted V-shape pattern on the daily chart. If this setup plays out, Cardano could face short-term downside pressure toward the $0.58 zone before any real recovery takes hold.

Cardano Active Addresses Show Steady Growth
Despite the broader market still navigating through uncertain conditions, Cardano’s active addresses are quietly climbing. As shown in the chart shared by Jesse Peralta, the total number of ADA addresses with a balance has continued rising, even while the price remains well below its 2021 highs. This divergence between user activity and price indicates sustained network engagement.
Cardano’s active addresses continue climbing steadily. Source: Jesse Peralta via X
What stands out is how the number of active holders hasn’t just remained steady, it has steadily grown. This on-chain trend suggests that ADA may be experiencing gradual accumulation or organic network expansion, even in a less speculative phase. While price action has stalled near the $072 region, the uptick in addresses supports the idea that interest in Cardano remains.
Cardano Price Prediction: Fractal Suggests Next Leg Could Target $5.96
The chart shared by CryptoIRELAND1 draws a striking comparison between Cardano’s 2020-2021 surge and its current structure. Using a repeating fractal model, the chart maps out similar consolidation behavior and trajectory angles, projecting a possible target around $5.96.


Cardano’s current structure mirrors its 2020 run, with a fractal setup hinting at a possible breakout toward $5.96. Source: CryptoIRELAND1 via X
Technically, the similarities are notable: both cycles show a rounded accumulation zone followed by a breakout and sharp vertical expansion. The yellow trendline across the top frames represents long-term resistance, with this projection suggesting that ADA could revisit it.
Cautious Short-Term Outlook: Cardano Price Tests Important Support
While long-term holders continue accumulating, Cardano’s short-term structure is flashing potential signs of weakness. The chart shared by Alpha Crypto Signal highlights an inverted V-shape pattern on the daily timeframe. This formation is often associated with buyer’s exhaustion. With ADA now sitting around $0.72, near the 50-day moving average, this zone becomes critical to watch for any immediate bounce or breakdown.
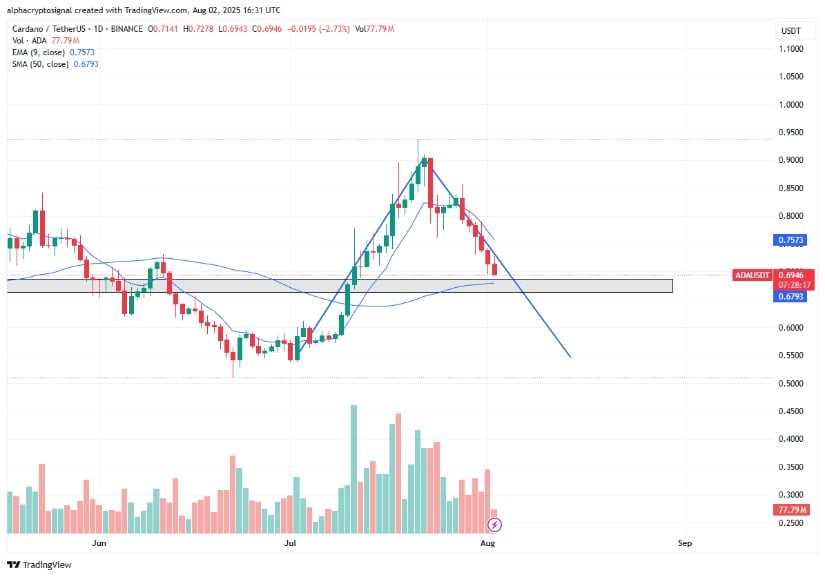
Cardano tests key support near $0.72 as an inverted V-pattern and rising volume raise short-term downside risks. Source: Alpha Crypto Signal via X
Volume is ticking up slightly on this down leg, adding to the weight of the reversal argument. The $0.67 to $0.71 area remains a key demand region, but failure to hold it could expose the price to a move back towards $0.58. This more cautious technical setup contrasts with the bullish fractal view noted in the previous section, reinforcing that ADA may face near-term turbulence before any breakout attempt takes shape.
Cardano Back-Tests 20-Week SMA as Bollinger Bands Tighten
As Cardano flirts with critical support zones, it’s also engaging with an important trend indicator—the 20-week simple moving average (SMA). The chart shared by Cantonese Cat shows ADA pulling back and testing this mid-range level. Currently hovering just above $0.72, ADA’s interaction with the 20-week SMA could set the tone for the short-term direction.
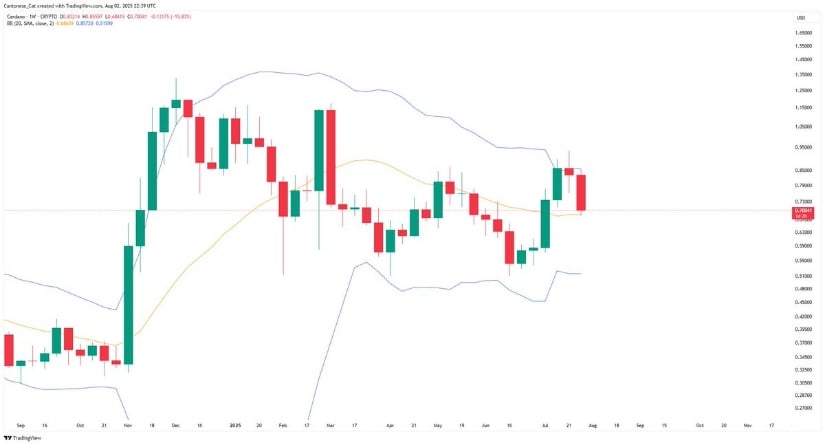
Cardano hovers above its 20-week SMA as tightening Bollinger Bands hint at an imminent breakout or breakdown. Source: Cantonese Cat via X
As for the Bollinger Bands, they’re starting to tighten, which typically precedes a sharp directional move. Whether ADA resolves this with a bounce or breakdown, this confluence of indicators reinforces that the market is entering a decision phase.
Final Thoughts: ADA Faces a Pivotal Moment Ahead
Cardano’s latest metrics offer a tale of two timeframes. On one side, the steady climb in active addresses and long-term accumulation paints a picture of quiet strength and growing user engagement. On the other hand, short-term signals like the inverted V-shape, tightening Bollinger Bands, and SMA retests suggest that ADA is navigating a crucial technical zone.
If bulls can defend the $0.67 to $0.71 region and flip the $0.75 to $0.80 zone back into support, a push toward the bullish fractal target above $5 could re-enter the conversation. But if the price slips below the 20-week SMA with volume, short-term downside toward $0.58 may come first.


Written by : Editorial team of BIPNs
Main team of content of bipns.com. Any type of content should be approved by us.


Share this article: