The main category of Crypto News.
You can use the search box below to find what you need.
[wd_asp id=1]
The main category of Crypto News.
You can use the search box below to find what you need.
[wd_asp id=1]
Polygon’s POL token is drawing renewed attention as price strength, derivatives activity, and infrastructure development converge. Recent chart action shows a decisive recovery phase after weeks of consolidation.
Besides technical momentum, improving spot flows and new ecosystem tools add context to the market’s near-term outlook. Consequently, traders are reassessing risk as POL tests higher levels near the $0.15 zone.
POL price action on the four-hour chart reflects a clear upward trend. The market advanced sharply from the $0.118 area toward $0.149. This move followed a prolonged sideways phase, which often precedes stronger directional breaks. Significantly, price now trades above key exponential moving averages across short and long periods.
The EMA alignment shows sustained bullish control. The 20-period average continues to act as dynamic support near $0.131. Hence, dips toward this zone may attract buyers if momentum cools. Fibonacci retracement levels also reinforce this structure. The $0.129 and $0.138 zones remain important buffers during any pullback.
However, the Donchian Channel places price above its upper boundary. That condition often signals near-term exhaustion. Consequently, consolidation or a shallow retracement could emerge before another push higher. Resistance remains concentrated near $0.149, which marks the recent swing high.

Futures open interest adds another layer to the narrative. Open interest expanded steadily from mid-summer and peaked near $180 million in early autumn. That phase aligned with stronger speculative appetite. However, October saw rapid deleveraging, which pushed open interest sharply lower.
Since then, derivatives activity stabilized between $55 million and $70 million. Moreover, the recent uptick toward $66 million suggests traders are returning cautiously. Leverage remains restrained compared with previous highs. This structure reduces liquidation risk but also limits explosive upside.
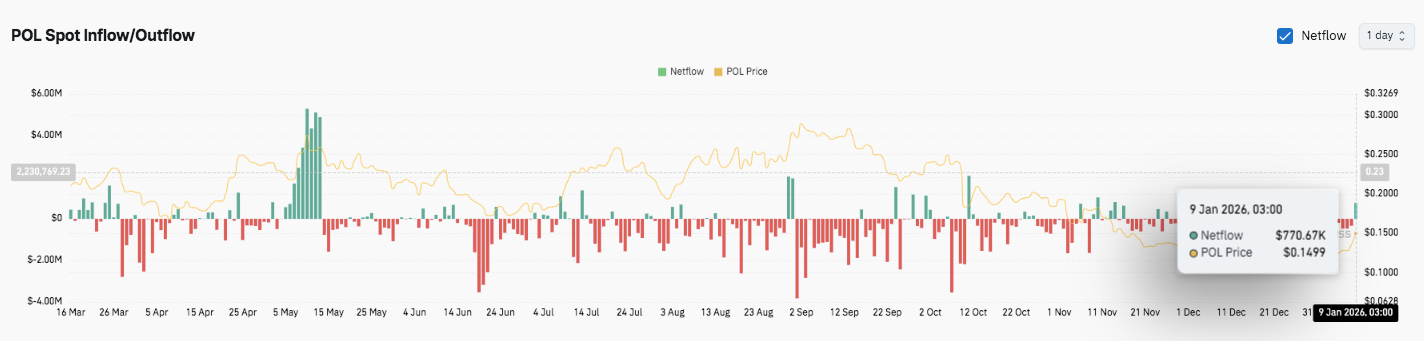
Spot flow data supports this measured shift. Earlier periods showed persistent outflows and sharp sell-side spikes. Additionally, those flows coincided with price weakness. Into late November and December, outflows moderated and netflows moved closer to balance. The latest modest inflow near $770,000 aligns with price stability near $0.15.
Beyond charts, ecosystem progress continues. Polygon Labs recently introduced the Open Money Stack. The initiative focuses on regulated stablecoin payments and cross-border transfers. It combines compliance, wallets, orchestration, and settlement into a unified framework.
Moreover, the stack aims to connect onchain and offchain systems without sacrificing interoperability. Developers can onboard users and integrate payment and yield features more efficiently. Several components already operate through partners, with further releases planned.
Polygon’s POL token continues to trade at a technically sensitive zone, where momentum remains constructive but not yet decisive. Price action on the short-term timeframe shows POL attempting to hold above recent breakout levels near $0.145–$0.149. Consequently, traders are closely monitoring whether buyers can sustain control or if consolidation deepens before the next directional move.
From a structural standpoint, POL appears to be compressing after a sharp impulse move. EMAs remain positively stacked, supporting the broader uptrend. However, price trading near the upper Donchian boundary signals short-term exhaustion risk. Hence, consolidation or a shallow retracement would remain healthy for trend continuation.
Polygon’s short-term outlook depends on whether buyers can defend the $0.138–$0.145 area while pressuring the $0.150 resistance. Technical compression suggests volatility expansion may follow.
If bullish momentum builds alongside improving spot flows, POL could target $0.158 and $0.165 next. However, failure to hold $0.138 risks a reset toward $0.129 or lower. For now, POL trades in a pivotal zone where confirmation will shape the next leg.
Disclaimer: The information presented in this article is for informational and educational purposes only. The article does not constitute financial advice or advice of any kind. Coin Edition is not responsible for any losses incurred as a result of the utilization of content, products, or services mentioned. Readers are advised to exercise caution before taking any action related to the company.
Jakarta, Pintu News – Dogecoin (DOGE) is currently trading at technically sensitive levels, as short-term momentum starts to slow down after the previous sharp rally. The latest price action on Kraken’s 4-hour DOGE/USD chart shows that buyers still dominate the overall market structure.
However, consolidation below the resistance area indicates that the market is evaluating the direction of the move, rather than going straight for a breakout. This pause came after an impulsive move from the $0.115 to $0.155 range, which signaled strong participation from the buyers’ side.
As a result, traders are now focusing on whether the support level can hold during this cooling phase.
Dogecoin’s short-term trend is still bullish, although the upward momentum is starting to ease. DOGE continues to form higher lows, indicating that the recovery structure is maintained.
Read also: Shiba Inu Still Under Pressure Due to Surge in Liquidations: Can SHIB Price Rise?
Moreover, the medium-term trend appears to be stabilizing after the formation of a higher low around the $0.116 level. This recovery has shifted market sentiment away from aggressive selling pressure. However, the price is now stuck below the $0.148 supply zone, creating a narrow trading area.
Importantly, DOGE is still trading above the key area of the Fibonacci level and EMA cluster combined, which reinforces the bullish bias. The $0.141 to $0.142 zone is the first important point for the bulls to defend.
This level is a combination of the 0.618 Fibonacci retracement and the previous breakout area. If the price fails to hold here, then there is a risk of a deeper correction. On the other hand, the $0.138 to $0.137 range has a dense cluster of EMAs, adding to the significance of the area as a demand zone.
Resistance is still clear and layered. DOGE faces immediate selling pressure around $0.148, which is the area where the price has recently been stuck. In addition, the psychological level of $0.150 could attract new momentum if broken successfully. A confirmed breakout above $0.155 would signal the continuation of the uptrend and open up the potential towards $0.160.
On the downside, a controlled correction to around $0.134 is still considered reasonable and does not damage the long-term structure. However, if there is a net breakdown below $0.125, then the bullish scenario will fall. Therefore, traders are now watching these zones closely to determine the direction of the next move.

Derivatives data provides important context to the structure of price charts. Open interest in the Dogecoin futures market shows a cyclical pattern – expanding during rallies and contracting after the price peaks.
The peak in open interest that occurred near the previous high suggests aggressive use of leverage to chase the price. However, the latest data shows that open interest has now stabilized at around $1.8 billion as the DOGE price hovers around $0.15. This stability indicates reduced speculative pressure.
Read also: PEPE Price Jumps 50% in a Week: Is an 80% Rise Awaiting?
Spot flow data supports this view. In recent sessions, net outflows from exchanges have continued to dominate, meaning DOGE is being pulled off trading platforms.
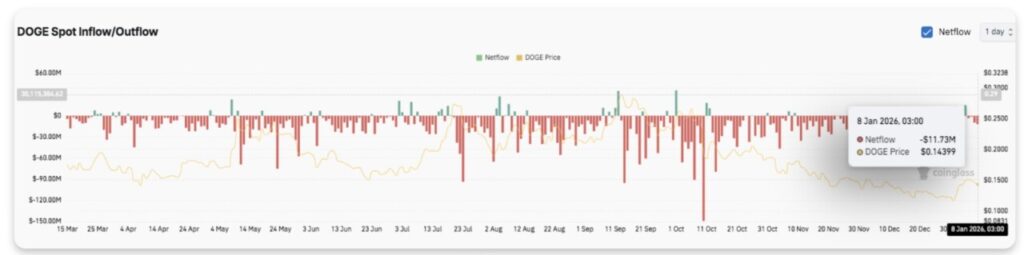
This suggests that selling pressure is likely to be limited. The latest outflow of around $11.7 million occurred while the price stayed above the $0.14 level. Overall, this behavior reflects cautious accumulation, rather than aggressive speculation.
Dogecoin’s price structure remains positive as key technical levels are still evident ahead of the short-term trading sessions.
Currently, the price is still in a consolidation phase after a strong impulsive rise, which reflects compression rather than exhaustion.
Rising Levels (Resistance):
Immediate resistance is in the range of $0.1478-$0.1485, an area where sellers have consistently held back the upside.
If price manages to break and hold this zone, the upside potential could continue to $0.1500, then to the swing high at $0.1557. A confirmed breakout above $0.155 would most likely accelerate the momentum towards the $0.160 area.
Downside Levels (Support):
Initial support is in the $0.1410-$0.1420 range, which is reinforced by the 0.618 Fibonacci retracement and the previous breakout structure. Below that, the EMA cluster in the range of $0.1383-$0.1375 becomes an important demand zone.
If the price correction continues, the $0.1340 area could be the next target, while $0.1255 becomes the last level that determines the validity of the bullish scenario.
Upper Limit Resistance:
The high of $0.1557 is an important point that the bulls need to break in order to continue the uptrend and open up the upside potential to higher levels.
From a Structure Perspective:
DOGE price appears to be moving in a compression pattern (volatility tightening) within a narrowing range, after rallying from $0.115 to $0.155. The pattern of higher lows is still intact, while short-term lower highs are also forming indicating a consolidation phase below the resistance.
Therefore, volatility expansion becomes increasingly likely as the price approaches the apex of this pattern.
That’s the latest information about crypto. Follow us on Google News to get the latest crypto news about crypto projects and blockchain technology. Also, learn crypto from scratch with complete discussion through Pintu Academy and stay up-to-date with the latest crypto market such as bitcoin price today, xrp coin price today, dogecoin and other crypto asset prices through Pintu Market.
Enjoy an easy and secure crypto trading experience by downloading Pintu crypto app via Google Play Store or App Store now. Also, get a web trading experience with various advanced trading tools such as pro charting, various types of order types, and portfolio tracker only at Pintu Pro.
*Disclaimer
This content aims to enrich readers’ information. Pintu collects this information from various relevant sources and is not influenced by outside parties. Note that an asset’s past performance does not determine its projected future performance. Crypto trading activities have high risk and volatility, always do your own research and use cold cash before investing. All activities of buying and selling bitcoin and other crypto asset investments are the responsibility of the reader.
Reference:
XRP rallied 25% in the first week 2026 from $1.77 December low to $2.38 January 6—37% below July 2025 ATH $3.65 with $1.3B ETFs absorbed in 50 d
Exchange balances dropped 57% from 4B XRP to 1.7B in 2025. This marks one of the largest annual supply reductions on record.
XRP’s path to $4 requires a BlackRock XRP ETF filing credibility shock, RLUSD scaling banking rails, and 3-4 Fed rate cuts.
Have You read The New Report Shaking Up Retirement Plans? Americans are answering three questions and many are realizing they can retire earlier than expected.
XRP (CRYPTO: XRP) trades near $2.30 after rallying 25% in the first week of 2026, recovering sharply from December lows near $1.77. Despite this momentum, XRP remains 37% below its July 2025 all-time high of $3.65. The question for 2026 is straightforward: Can institutional demand push XRP to $4, or will $2.50 be the ceiling?
The bulls see renewed institutional conviction driving a full re-rating. They target $4-$8 based on Standard Chartered’s projection and the $1.3 billion already absorbed by XRP ETFs in just 50 days. The bears argue XRP has already shown its limits. They point to XRP’s large supply and weak value capture as factors that could cap upside to $2.50-$3.00. The answer comes down to institutional behavior: Do they accumulate for years, or trade volatility and move on?

After a brutal Q4 2025 that saw XRP slide from its July peak of $3.65 to December lows near $1.77, the token staged a remarkable recovery in early January. XRP opened 2026 at $1.84 and surged to $2.38 by January 6—a 25-28% gain in just one week. The rally outpaced most major cryptocurrencies and brought renewed attention to XRP’s institutional narrative.
The move coincided with several catalysts: continued ETF inflows, improving regulatory sentiment, and a broader risk-on rotation in crypto markets. From a technical perspective, XRP broke through resistance at $2.00 and briefly tested $2.40 before pulling back. The token now trades around $2.27-$2.30, consolidating recent gains.
The most compelling development was the unprecedented success of spot ETF launches. In just 50 days since mid-November, XRP ETFs absorbed $1.3 billion with 43 consecutive trading days of positive inflows and zero outflows. That makes XRP the second-fastest crypto ETF to cross the billion-dollar threshold after Bitcoin.
Seven spot XRP ETFs now trade in the United States with combined assets under management exceeding $2 billion and approximately 793 million XRP tokens locked in custody. Major issuers include Canary Capital (XRPC), Grayscale (GXRP), Bitwise (XRP), Franklin Templeton (XRPZ), REX-Osprey (XRPR), 21Shares (TOXR), and newer entrants.
Polymarket is moving mainstream as Dow Jones adds real-time odds to WSJ, Barron’s, and MarketWatch. For Hong Kong investors, live probabilities on rates, elections, and earnings can sharpen trade timing and risk control. We track BTCUSD alongside these signals to gauge macro sentiment. This integration puts event views next to headlines, so positioning can update faster. Used well, it supports clearer decisions on exposure, hedges, and even treasury planning in Web3 operations across HK.
Dow Jones started embedding Polymarket odds across major properties, including WSJ, Barron’s, and MarketWatch. The Dow Jones partnership places market-implied probabilities beside daily reporting, which can speed investor reactions. The initial rollout is highlighted by the WSJ team here: Polymarket, Dow Jones Partner to Display Prediction-Markets Data in Dow Jones Content. Expect odds on rate cuts, election paths, and high-impact corporate events.
HK traders can now scan WSJ live odds during the cash session and pre-market, then align exposures across US equities, crypto, and local derivatives. Polymarket turns fuzzy narratives into numbers, which helps with sizing and stops. With probabilities in view, we can stress-test positions more quickly around US CPI prints, FOMC meetings, and earnings that often move Asia hours the next day.
Polymarket odds reflect the price where risk clears, not a guarantee. Depth and liquidity matter. Tight spreads, steady turnover, and diversified participation improve signal quality. We pair the odds with realized volatility and news timestamps. For added context on business workflows this could influence, see Meyka’s brief: January 08: Dow Jones–Polymarket Deal Brings Live Odds to WSJ.
Polymarket gives a fast read on macro binaries that often sway crypto. If prediction market data shows rising odds of Fed cuts, liquidity-sensitive assets can bid. If odds swing toward tighter policy, we fade beta or hedge. We do not trade odds alone. We blend Polymarket with funding rates, basis, and cross-asset moves to refine BTC timing and risk.
Spot sits at US$93,870.06, day range US$91,479.28 to US$94,825.27, as of 07 Mar 2025 09:00 UTC. RSI is 55.08, ADX 31.66 shows a strong trend, and CCI 189.44 flags overbought. Price is near or above Bollinger upper US$93,350.12, while ATR at 3,391.97 implies brisk swings. MACD histogram is positive at 1,053.15, suggesting improving short-term momentum.
We track the 50-day average at US$89,243.98 as near-term support and the 200-day at US$106,601.45 as resistance. The Bollinger middle, US$88,768.91, and Keltner middle, US$89,757.19, are secondary supports. Year high is US$126,198.07. A sustained close back inside bands can cool momentum. Strong odds shifts on Polymarket around Fed meetings could add fuel either way.
The Dow Jones partnership validates Polymarket as a data source that executives will see daily. That visibility can nudge CFOs at HK Web3 firms to trial crypto-native treasury and payroll workflows. Live probabilities help with cash buffers around event risk. Teams can decide when to convert, hedge, or delay noncritical outflows based on shifting odds and liquidity conditions.
Start with SFC-licensed VASPs, set segregated wallets, and define payout rails in HKD for staff and vendors. Use Polymarket to map event windows, then pre-fund on-chain wallets ahead of risk dates. Build a simple treasury ladder, for example splitting working capital across stablecoins, fiat HKD, and BTC, with thresholds that trigger conversions when odds or volatility cross set levels.
Codify risk: hedge ratios, maximum BTC drawdown, and conversion rules back to HKD after payroll. Track on-chain flows with audit-ready tools and keep KYC files current. Reconcile prediction market data and execution timestamps to prove policy compliance. This turns Polymarket from a headline feature into a measurable input that improves board reporting and cash management discipline.
Polymarket is now visible where many HK readers already spend time. That makes event probabilities easier to act on, but they work best beside other signals. Our playbook is simple. Track the WSJ widgets for odds on the Fed, elections, and mega-cap earnings. Map those dates to existing positions. For BTC, watch momentum versus band levels and the 50 and 200 day averages, then size risk accordingly. For HK Web3 operators, define treasury and payroll rules that reference odds, volatility, and licensed liquidity. Start small, measure fills and slippage, and only expand after the data adds clear value to returns and operations.
What is Polymarket and why does it matter now?
Polymarket is a crypto-native prediction market where prices reflect odds on real-world events. It matters now because Dow Jones is embedding these odds into WSJ, Barron’s, and MarketWatch. That puts quantified probabilities next to daily news, which can speed decision-making for Hong Kong investors who trade macro, equities, and crypto.
How can Hong Kong traders use WSJ live odds day to day?
Check odds before Asia open, during US data releases, and ahead of earnings. Align position size, hedges, and stops to the probability path. Combine odds with implied volatility, volume, and price levels. Avoid trading every wiggle. Use odds shifts to time entries and exits around key macro and company events.
Do Polymarket odds predict BTC price moves?
Not directly. They are one input among many. Odds often lead sentiment around macro catalysts, which can influence BTC. We pair Polymarket data with momentum, funding, and liquidity. If odds cluster and technicals confirm, confidence rises. If odds are noisy or liquidity is thin, we reduce size and rely on core levels.
What should HK Web3 firms change in treasury and payroll?
Introduce clear rules for conversions to HKD, hedge thresholds, and event calendars tied to odds. Use SFC-licensed platforms, segregated wallets, and audit trails. Start with small pilot payouts and stablecoin buffers. Review results monthly. If the process lowers volatility and costs without adding risk, expand the program gradually.
Disclaimer:
The content shared by Meyka AI PTY LTD is solely for research and informational purposes.
Meyka is not a financial advisory service, and the information provided should not be considered investment or trading advice.
Technical analysis is dominated by the price prediction of XRP and Cardano. CoinMarketCap records that XRP is trading at $2.25 and has a volume of $136.62B and accumulation trends indicate that it could be in breakout phase towards the targets of $5 to $8. At $15.1B, Cardano has a value of $0.42 in the technical indicators that are displayed to be within the range of $0.80 to $1.20.
They both exhibit bullish structures with 2x to 3x returns. Yet Pepeto ($PEPETO) presale at $0.000000176 steals investor spotlight through mathematical advantages enabling 100x probability.
Having raised 7.14M, built 100K+ participants, and attracted 850+ platform applications, Pepeto (https://pepeto.io/) considered the Best Crypto to Invest In, demonstrates momentum overshadowing established cryptocurrency predictions. To know why presale is a stealer of spotlight one has to look at percentage probability and absolute price targets.
XRP Breakout Technical Position.
XRP of $2.25 exhibits strong technical trends. The price consolidated at the range of $2.00 to 2.50 as a base towards possible break out. Accumulation of volume posits maintenance of institutional positioning. New ETF products have offered regulated access mechanisms. It is reported that XRP investment products record inflows of unprecedented $46M a day showing systematic capital investment.
Technical analysts get resistance at 3.00 first then 4.50 then finally at 5-8 and then 8. The degree of regulatory clarity after the SEC case gives confidence lacking in other cryptocurrencies. Ripple contracts with banks to carry out cross-border payments advance gradually. These basics lend bullish projections. Between 2.25 to $5, this is approximately 2.2x. Reaching $8 delivers 3.5x. Very good returns and low exponential potential of $136.$62B.
Cardano Golden Cross Formation.
At $0.42, Cardano has first golden cross of 2026 and this has led to increased speculation. This technical indicator is realized when short-term moving average is crossed in an upward direction by the long-term average that is followed by the growth of prices in the past. The 50-day MA broke through the 200 day MA indicating the possibility of bullish momentum building.
Technical targets indicate that the first resistance level will be at $0.80 then psychological barrier at $1.00 till shot to range of $1.20 to $1.50 in the long term momentum. Recent additions such as Midnight sidechain launch and Protocol 25 upgrade give underlying support. Peer-reviewed methodology enhances interest due to the appeal of institutional interest. Between $0.42 and $0.80 is a little more than 1.9x. Achieving $1.20 returns about 2.8x. A respectable performance with mathematical limitations curtail exponential results of $15.1B.
Why Pepeto Presale Steals Spotlight
Despite XRP and Cardano bullish predictions, Pepeto (https://pepeto.io/) presale dominates investor attention. The mathematics explain why. To reach 100x on a $136.62B it takes $13.66T. Cardano reaching 100x needs $1.51T. Both are confronted with unrealistic capital requirements. Pepeto reaching 100x from $0.000000176 needs just $300M to $400M.
The presale raising $7.14M is an indication of serious capital commitment at the time of quietest phase. It has organic momentum to reach community of 100K+ participants. The platform applications of 850+ demonstrate that there is ecosystem demand prior to launch. Infrastructure including PepetoSwap, cross-chain bridge, zero-fee exchange, and 216% staking addresses comprehensive memecoin needs.
Context validates targets. PEPE keeps $2.78B, SHIB has got $5.28B, DOGE is at $25.35B. Tens of billions sustained value is demonstrated in the memecoin category. Pepeto capturing fraction achieves 100x from comprehensive utility infrastructure differentiating it from pure speculation tokens. While XRP and Cardano offer solid 2x to 3.5x predictions, Pepeto presale offers 100x probability stealing investor focus.
Rotation of Capitals between Predictions and Presale
The psychology of investors will cause them to exercise a capital rotation mechanism where they shift their interest to earlier projects. XRP and Cardano forecasts are decent returns that will need time to go through the consolidation and breakout cycles. Pepeto (https://pepeto.io/) presale offers compressed timeframe potential. The inclusion in exchange listings may prompt swift gains on a rapid relative basis compared to prolonged established cryptocurrency currency momentum.
Also, pre-sale involvement captures the optimum entry unachievable after listing. The buyers of XRP and Cardano at the current price do not obtain the benefits of accumulation at an earlier stage. Pepeto presale participants secure lowest pricing before broader market discovery. This timing gap is the reason why presale steals the spotlight when compared to XRP and Cardano technical power.
The Ability to Access Spotlight Opportunity
Visit Pepeto.io (https://pepeto.io/) and connect Ethereum wallet like MetaMask or Trust Wallet. Eth, USDT, and BNB purchases and credit card purchases are available in Web3Payments. Create stake at 216% returns maximizing. On the upslope side in the news, out of 700,000 rewards shared by those who pre-sold, there was a token upside growth, which is two times as lucrative an opportunity as sitting and waiting until XRP or Cardano breakout announcements.
Conclusion
The target of the price prediction: the XRP may grow to between 5 and 8 based on the XRP price at the price level of $2.25 implying returns of 2.2x to 3.5x. 1.9x-2.8x returns on cardano at a prediction of $0.80-$1.20 at $0.42. They both exhibit bullish technical arrangements. However, Pepeto (https://pepeto.io/) presale at $0.000000176 steals investor spotlight through 100x probability. The project has brought up 7.14M dollars, constructed $100K + community, and found 850+ applications of its platform.
Comprehensive infrastructure including PepetoSwap, bridge, exchange, and 216% staking creates sustained value. The mathematical benefits allow 100x using $300M to $400M compared to the impossible $13.66T of XRP and the difficult to achieve $1.51T of Cardano. While XRP and Cardano offer solid predictions, Pepeto presale captures investor focus through superior asymmetric probability and compressed opportunity window.
To stay ahead of key updates, listings, and announcements, follow Pepeto on its official channels only:
Website: https://pepeto.io
X (Twitter): https://x.com/Pepetocoin
Telegram: https://t.me/pepeto_channel
Instagram: https://www.instagram.com/pepetocoin/
Contact: Dani Bonocci
Website: https://www.tokenwire.io
Phone: +971586738991
SOURCE: Pepeto
Press release distribution
This release was published on openPR.
Solana just scored another credibility win as Jupiter rolled out JupUSD, a stablecoin backed by BlackRock’s tokenized BUIDL fund. It’s a clear sign that institutional-grade finance keeps moving on-chain.
Yet the news barely shifted Solana price predictions, as attention has already moved elsewhere. Traders are fixated on DeepSnitch AI and its looming catalyst.
Rumors suggest the team is lining up multiple Tier 1 CEX listings shortly after the January TGE, a development that could reshape its trajectory fast.
With analysts calling DSNT a potential 100x play for 2026, whales have already committed $1.1M+ to the presale, with analysts believing DeepSnitchAI could outperform any Solana price predictions this year.
Jupiter has introduced JupUSD, a new dollar-pegged stablecoin developed in partnership with Ethena Labs. Issued natively on Solana as an SPL token, JupUSD is designed to function as a core settlement asset across Jupiter’s DeFi ecosystem.
Ninety percent of JupUSD’s reserves are initially backed by USDtb, a licensed stablecoin collateralized by shares of BlackRock’s tokenized money-market fund.
At the same time, the remaining 10% is held in USDC to support liquidity. Reserves are custodied by Porto via Anchorage Digital and are verifiable on-chain.
DeepSnitch AI is quickly locking in its role as a true “picks and shovels” opportunity for the 2026 AI-driven bull run. The presale has already cleared $1.1 million, with DSNT priced at $0.03269, a 115% gain that’s already outpacing most Solana price predictions.
What sets DeepSnitch AI apart is execution. The protocol makes DYOR faster and far harder to get wrong. Four AI agents are now live, giving traders insight usually reserved for insiders.
SnitchFeed tracks whale movements in real time. SnitchScan flags risky contracts before capital goes in. SnitchGPT turns raw on-chain data into clear, actionable answers.
The latest addition, AuditSnitch, adds another layer of protection by analyzing ownership control, liquidity locks, and contract risks, then delivering a plain verdict.
The timing couldn’t be better. AI spending is projected to hit $1.5 trillion, and DeepSnitch AI sits right at that intersection of data, security, and trading intelligence.
With the presale wrapping up in January and Tier 1 listing rumors heating up, DeepSnitch AI could be one of those rare early entries that lead to a true 100x run.
Solana is regaining strength. Price was holding above $130 on January 7, sitting above key moving averages. Buyers now defend this zone, while sellers lose momentum.
The chart confirms the change. The Solana price prediction pushed through a long-term downtrend and now builds support between $130 and $134.
Higher lows above $125 show steady demand. The reclaim of the 50-day EMA and SMA adds weight, as this signal often marks trend turnarounds.
According to some Solana price predictions, if buyers stay active, focus shifts to $145–$150. A clean break there opens room toward $160 and possibly $180. A drop below $130 would pause the move and keep the price range-bound.
Tron was trading below $0.29 on January 7. Price reclaimed the 50-day EMA near $0.28 and keeps pressing higher. Buyers now control the short-term trend. A daily close above $0.29 would confirm a breakout.
Fundamentals add support. Tron expanded real-world use through a Wirex partnership with TRON DAO. The deal targets on-chain payments and strengthens Tron’s role as a settlement layer.
On-chain data backs the move. Stablecoin supply on Tron has climbed to nearly $82 billion, close to record levels. Traders are also leaning bullish, with the long-to-short ratio above 1.6.
If price holds above $0.29, TRX could push toward $0.32. A slip under $0.28 would stall momentum and keep the range intact.
Solana price predictions may still excite traders, but with a $75 billion market cap, the era of life-changing upside for SOL is largely over. The real opportunity in 2026 lies in undervalued, early-stage plays, and DeepSnitch AI fits that profile perfectly.
At just $0.03269, DSNT offers true asymmetry, backed by real, live tools that give retail traders an edge. With $1.1 million already raised and Tier 1 listing rumors swirling ahead of the January launch, the window is closing fast.
Visit the official DeepSnitch AI website, join Telegram, and follow on X (Twitter) for the latest updates.

While the Solana price forecast remains steady, DeepSnitch AI offers far greater upside with early-stage entry and live AI utility.
The SOL outlook favors gradual growth, but DeepSnitch AI stands out for traders seeking asymmetric, high-growth potential.
Solana market trends show maturity, while DeepSnitch AI leads as the smarter choice for early-stage investors chasing outsized returns.
Disclaimer: This is a Press Release provided by a third party who is responsible for the content. Please conduct your own research before taking any action based on the content.

BNB USD is trading at $909.82 as of January 8, 2026, down 0.81% in the last 24 hours. The Binance token faces a critical juncture where strong technical momentum collides with profit-taking pressure. Market data shows BNB USD has declined 13.5% over the past month, yet remains up 39.2% year-to-date. With a market cap of $130.7 billion and trading volume at 2.19 billion, BNB USD continues to command significant liquidity. Understanding the current BNB USD price action requires examining both the technical setup and broader market sentiment driving this cryptocurrency.
The technical picture for BNB USD reveals mixed signals that explain today’s modest decline. RSI sits at 56.24, indicating neutral momentum without overbought or oversold extremes. The MACD shows a bearish signal with the line at -6.28 below the signal line at -17.42, suggesting weakening upside momentum. ADX measures 32.63, confirming a strong trend is in place, though direction remains contested.
Bollinger Bands paint an interesting picture with price at $909.82 positioned near the upper band at 909.67. This suggests BNB USD has reached resistance territory where sellers typically emerge. Support levels sit at the lower band ($818.10) and the 50-day moving average ($871.83), providing downside anchors if selling accelerates.
Trading volume for BNB USD stands at 2.19 billion, representing 71.7% of the 30-day average volume. This below-average activity suggests reduced conviction among traders, which often precedes directional moves. The Stochastic indicator reads 88.48 on the %K line, signaling overbought conditions that typically attract profit-taking.
Liquidation data shows Money Flow Index at 81.73, also in overbought territory. When multiple momentum indicators cluster in overbought zones, reversals become more probable. However, the Awesome Oscillator remains positive at 13.71, indicating bulls retain some control despite the recent pullback.
Meyka AI forecasts reveal a range of outcomes depending on timeframe. For the monthly outlook, BNB USD targets $833.08, representing a 8.4% decline from current levels if selling pressure intensifies. This level aligns with the 50-day moving average, suggesting natural support.
The quarterly forecast points to $1,032.17, implying a 13.5% rally if technical resistance breaks. This would require sustained buying volume and positive catalyst events. For the full year 2026, the forecast stands at $810.39, suggesting consolidation near current support levels. Forecasts may change due to market conditions, regulations, or unexpected events.
BNB USD price action revolves around three critical levels. Immediate resistance sits at the $915.89 day high, where sellers emerged today. Breaking above this level would target the $1,000 psychological level, which historically attracts institutional interest.
Support clusters at $890 (today’s low) and $871.83 (50-day moving average). A breakdown below $871 would expose the $818.10 lower Bollinger Band, representing a 10% decline from current prices. The year-to-date high of $1,370.55 remains a longer-term target if the broader uptrend resumes.
The 0.81% decline reflects profit-taking after BNB USD rallied 2.53% over the past five days. Overbought momentum indicators suggest traders are locking in gains rather than holding for higher prices. Market data shows relative volume at 0.72, indicating lighter participation than average, which often accompanies consolidation phases.
Broader crypto market dynamics also matter. When Bitcoin or Ethereum face selling pressure, altcoins like BNB USD typically follow. The decline remains modest, suggesting the underlying uptrend remains intact despite today’s pullback.
The immediate outlook depends on whether BNB USD holds above $890 support. If buyers defend this level, a retest of $915.89 becomes likely within days. Conversely, a break below $890 would signal weakness and potentially trigger stops toward $871.83.
Technical strength measured by ADX at 32.63 confirms a strong trend exists, but the MACD crossover suggests momentum may be shifting. Traders should monitor volume closely—a surge in buying volume would confirm support holds, while declining volume on further weakness would suggest capitulation selling ahead.
BNB USD at $909.82 presents a textbook consolidation setup where technical strength meets profit-taking. The 0.81% daily decline masks a 39.2% year-to-date gain, indicating the broader uptrend remains intact. Technical indicators show mixed signals with RSI neutral, MACD bearish, and ADX confirming strong trend conditions. Support at $890 and $871.83 provides clear downside anchors, while resistance at $915.89 and $1,000 define upside targets. The quarterly forecast of $1,032.17 suggests meaningful upside potential if technical resistance breaks decisively. Market sentiment remains cautious with below-average volume, typical of consolidation phases before directional moves. BNB USD price action warrants close monitoring of volume patterns and support level holds to determine whether the next move favors buyers or sellers.
BNB USD declined due to profit-taking after a five-day rally. Overbought momentum indicators and lighter-than-average trading volume suggest traders are consolidating gains rather than pushing higher. The decline remains modest, indicating the underlying uptrend persists.
Meyka AI forecasts BNB USD at $833.08 monthly, $1,032.17 quarterly, and $810.39 for the full year. These targets depend on whether technical resistance breaks and market conditions remain favorable. Forecasts adjust based on regulatory changes and unexpected events.
Critical support sits at $890 (today’s low), $871.83 (50-day average), and $818.10 (lower Bollinger Band). Resistance appears at $915.89 (day high) and $1,000 psychological level. Breaking below $871 would expose deeper support near $818.
Yes, multiple indicators signal overbought conditions. RSI at 56.24 is neutral, but Stochastic at 88.48 and Money Flow Index at 81.73 both show overbought extremes. This typically attracts profit-taking, explaining today’s modest decline.
ADX at 32.63 confirms a strong trend, but MACD shows bearish crossover suggesting momentum is weakening. Bollinger Bands indicate price near resistance. Overall, the setup favors consolidation before the next directional move.
Disclaimer:
Cryptocurrency markets are highly volatile. This content is for informational purposes only.
The Forecast Prediction Model is provided for informational purposes only and should not be considered financial advice.
Meyka AI PTY LTD provides market data and sentiment analysis, not financial advice.
Always do your own research and consider consulting a licensed financial advisor before making investment decisions.
Ethereum USD (ETHUSD) is consolidating near $3,225.19 as of January 8, 2026, down 2.13% from the previous close. The cryptocurrency faces a critical juncture where technical strength indicators clash with profit-taking pressure. Market participants are watching whether ETHUSD can hold above the $3,130 support level or if selling pressure will intensify. With a market cap of $377.6 billion and trading volume at $27.2 billion, ETHUSD remains one of the most actively traded digital assets. Understanding the current technical setup and market dynamics is essential for tracking this major cryptocurrency’s next move.
ETHUSD’s consolidation reflects a tug-of-war between institutional buying and retail profit-taking. The cryptocurrency opened at $3,143.15 and reached an intraday high of $3,264.66 before retreating to $3,225.19. This range-bound behavior suggests neither bulls nor bears have decisive control at present. The 50-day moving average sits at $3,015.47, providing a cushion below current prices, while the 200-day average at $3,610.78 represents longer-term resistance overhead.
Volume metrics tell an interesting story about ETHUSD’s current state. Trading volume of $27.2 billion is below the 30-day average of $31.5 billion, indicating reduced conviction from market participants. This lower volume during consolidation typically precedes a directional breakout, though the direction remains uncertain. The year-to-date gain of 6.14% shows ETHUSD has recovered from earlier weakness, but the -15.75% three-month decline reminds traders of recent selling pressure.
The technical picture for ETHUSD reveals mixed signals that explain the current consolidation. The RSI at 53.65 sits in neutral territory, neither overbought above 70 nor oversold below 30, suggesting balanced momentum between buyers and sellers. The MACD shows a value of -51.36 with a signal line at -80.30, indicating bearish momentum, though the positive histogram of 28.94 suggests the bearish pressure may be easing.
The ADX reading of 30.02 confirms a strong trend is in place, meaning price moves tend to follow directional momentum once established. Bollinger Bands show ETHUSD trading between the lower band at $2,744.40 and upper band at $3,295.01, with the current price near the middle band at $3,019.71. This positioning suggests room for movement in either direction. Support levels cluster around $2,744 (lower Bollinger Band), while resistance emerges near $3,295 (upper Bollinger Band). The Stochastic indicator at 62.90 (%K) and 46.33 (%D) shows momentum is moderating from overbought conditions.
The price forecast for ETHUSD across multiple timeframes reveals a recovery trajectory from current consolidation levels. Monthly forecast targets $2,582.26, representing a -20% decline from current prices, suggesting near-term weakness before stabilization. Quarterly forecast improves to $3,472.03, a +7.6% gain that would break above current resistance and establish higher ground.
Yearly forecast points to $3,721.34, a +15.4% advance that would mark a significant recovery from the three-month decline. The three-year forecast of $4,389.93 and five-year forecast of $5,062.44 indicate long-term bullish expectations. These projections assume normal market conditions and no major regulatory disruptions. Forecasts may change due to market conditions, regulations, or unexpected events. The progression from monthly weakness to quarterly and yearly strength suggests a potential V-shaped recovery pattern if support holds.
Market sentiment around ETHUSD reflects cautious optimism tempered by recent weakness. The Money Flow Index at 47.21 indicates neutral sentiment, with neither strong buying nor selling pressure dominating. The On-Balance Volume at -503.3 billion shows cumulative selling pressure has accumulated, though this metric can lag price action during consolidation phases.
Trading activity metrics reveal institutional participation remains steady despite the recent decline. The average volume of $31.5 billion demonstrates consistent interest from large traders and exchanges. Liquidation data would typically show whether leveraged positions are being forced to close, but current consolidation suggests liquidation cascades are unlikely unless ETHUSD breaks decisively below $3,130. The Williams %R indicator at -6.60 suggests price is near recent highs within the consolidation range, potentially limiting upside until a breakout occurs.
Several catalysts could push ETHUSD out of its current consolidation range. Regulatory announcements regarding cryptocurrency frameworks in major markets like the US and EU could spark institutional buying or selling. The recent mention of BTCUSD strength in market reports suggests Bitcoin’s direction often influences Ethereum, as the two largest cryptocurrencies tend to move in correlation during risk-on or risk-off environments.
Macroeconomic factors including inflation data, interest rate expectations, and geopolitical developments will shape risk appetite for digital assets. Technical breakouts above $3,295 or below $2,744 would signal the end of consolidation and establish new directional momentum. Ethereum network activity metrics, including transaction volume and staking participation, could also influence sentiment if major changes occur. The upcoming quarterly earnings season and corporate guidance could affect broader risk sentiment that flows into cryptocurrency markets.
Understanding critical price levels helps traders anticipate ETHUSD’s next move from consolidation. The primary support level sits at $2,744.40, defined by the lower Bollinger Band, which has historically attracted buyers during selloffs. A secondary support level exists at $3,015.47, the 50-day moving average, which provides a psychological floor for medium-term traders. Breaking below $2,744 would signal a deeper correction toward $2,600 or lower.
Resistance emerges at $3,295.01, the upper Bollinger Band, which has capped recent rallies. A break above this level would target $3,472, the quarterly forecast level, and eventually $3,610.78, the 200-day moving average. The year-high of $4,953.73 remains a distant target that would require sustained bullish momentum over several months. Current consolidation between $3,130 and $3,264 represents a tight trading range where breakout direction will determine the next significant move.
ETHUSD consolidates at $3,225.19 with mixed technical signals and moderate trading volume as of January 8, 2026. The technical analysis reveals neutral momentum with RSI at 53.65 and strong trend confirmation from ADX at 30.02, while bearish MACD signals suggest selling pressure persists. Price forecasts indicate near-term weakness to $2,582 before recovery toward $3,721 yearly, reflecting a potential V-shaped recovery pattern. Support at $2,744 and resistance at $3,295 define the consolidation boundaries, with breakout direction determining the next major move. Market sentiment remains cautious, with neutral Money Flow Index readings and reduced volume below 30-day averages. Traders should monitor regulatory announcements, macroeconomic data, and Bitcoin correlation for catalysts that could trigger ETHUSD’s exit from consolidation. The quarterly forecast of $3,472 represents a realistic near-term target if bullish momentum resumes, while the yearly forecast of $3,721 suggests longer-term recovery potential despite current weakness.
ETHUSD declined 2.13% due to profit-taking after recent rallies and broader cryptocurrency market weakness. Lower trading volume below 30-day averages suggests reduced conviction from buyers, allowing sellers to push prices lower. Technical resistance near $3,295 capped upside momentum, triggering the pullback.
The yearly forecast for ETHUSD is $3,721.34, representing a 15.4% gain from current levels. Quarterly forecast targets $3,472.03, while monthly forecast suggests near-term weakness to $2,582.26. These projections assume normal market conditions and may change due to regulations or unexpected events.
ETHUSD is neither oversold nor overbought. The RSI at 53.65 sits in neutral territory between 30 and 70. The Stochastic indicator at 62.90 shows momentum moderating from overbought conditions, suggesting balanced supply and demand at current prices.
Primary support sits at $2,744.40 (lower Bollinger Band) and $3,015.47 (50-day moving average). Resistance emerges at $3,295.01 (upper Bollinger Band) and $3,610.78 (200-day moving average). Breaking these levels would signal consolidation has ended and a new trend is forming.
ETHUSD has declined 2.13% while broader cryptocurrency markets show mixed performance. Bitcoin correlation typically influences Ethereum, so tracking Bitcoin’s direction helps predict ETHUSD moves. Both assets respond to similar macroeconomic factors and regulatory developments affecting risk appetite.
Disclaimer:
Cryptocurrency markets are highly volatile. This content is for informational purposes only.
The Forecast Prediction Model is provided for informational purposes only and should not be considered financial advice.
Meyka AI PTY LTD provides market data and sentiment analysis, not financial advice.
Always do your own research and consider consulting a licensed financial advisor before making investment decisions.
Bitcoin USD (BTCUSD) is trading at $93,870.06 as of January 8, 2026, down 0.79% over the past 24 hours. The decline comes after a brief rally that pushed the asset near $95,000 earlier this week. Market data shows Bitcoin ETF outflows of $243 million on Tuesday, with liquidations exceeding $440 million across derivatives markets. This pullback reflects profit-taking pressure following Bitcoin’s 7% gain since the start of 2026. Analysts note that while the broader trend remains supportive, short-term consolidation is likely as traders reassess positions ahead of key regulatory developments.
Bitcoin’s technical setup shows mixed signals as of January 8, 2026. The RSI sits at 55.08, indicating neutral momentum with no overbought or oversold extremes. The MACD histogram stands at 1053.15, suggesting bullish momentum is present but weakening. The ADX reading of 31.66 confirms a strong trend remains in place, though the slope is flattening.
Price action reveals Bitcoin trading above its 50-day moving average of $89,243.98 but below the 200-day average of $106,601.45. The Bollinger Bands show the asset near the upper band at $93,350.12, with support at $84,187.70. Stochastic indicators (%K at 84.71) suggest overbought conditions in the short term, which aligns with recent profit-taking activity. The CCI reading of 189.44 confirms overbought territory, explaining why liquidations spiked to $440 million.
Bitcoin’s price targets vary across timeframes based on current momentum and technical levels. For the monthly forecast, analysts project Bitcoin reaching $95,858.57, representing a 2.12% gain from current levels. This move would require sustained buying pressure and a break above the $94,825.27 day high.
The quarterly forecast shows Bitcoin at $135,658.38, implying a 44.4% rally over three months. This ambitious target assumes resolution of regulatory uncertainty and renewed institutional inflows. The yearly forecast is more conservative at $93,717.01, suggesting Bitcoin may consolidate near current levels through 2026. Longer-term projections show $117,056.86 in three years and $140,315.28 in five years. Forecasts may change due to market conditions, regulations, or unexpected events.
Bitcoin’s market sentiment shifted on January 7-8, 2026, as profit-taking accelerated. BlackRock’s IBIT saw $228 million in inflows, but Fidelity’s FBTC led redemptions at $312 million. This mixed flow pattern suggests institutional investors are rotating positions rather than exiting entirely. The $243 million in net ETF outflows reflects cautious positioning ahead of potential regulatory announcements.
Liquidation data reveals $440 million in forced closures across derivatives exchanges, concentrated in leveraged long positions. This activity typically occurs when price momentum falters and stop-loss orders trigger. Trading volume stands at 53.4 billion USD, down from the 90-day average of 61.2 billion, indicating reduced conviction among traders. The relative volume of 0.018 shows below-average participation, suggesting many traders are sitting on the sidelines.
Several factors are influencing Bitcoin’s price action in early January 2026. Morgan Stanley’s recent filing for spot Bitcoin and Solana ETFs signals growing institutional interest, though approval timelines remain uncertain. The Clarity Act, which could provide regulatory clarity for crypto markets, is expected to face a Senate vote next week. Positive passage could reignite institutional demand and push Bitcoin toward $100,000.
Geopolitical tensions and macroeconomic data continue to shape sentiment. The recent payroll data and economic reports have influenced risk appetite across markets. Additionally, Bitcoin miner activity shows mixed signals—Riot Platforms sold 2,201 BTC in November and December, netting $200 million. This suggests miners are taking profits at current levels, which could create supply pressure if the trend continues.
Bitcoin has gained 11.39% year-to-date through January 8, 2026, recovering from 2025’s year-end weakness. The asset opened 2026 at $87,611 and has tested $94,825.27 as its intraday high. Over the past 12 months, Bitcoin is up 18.43%, significantly outperforming traditional assets. The three-year return stands at 517.94%, reflecting the asset’s long-term appreciation despite periodic volatility.
Market cap has expanded to $1.798 trillion, making Bitcoin the largest cryptocurrency by valuation. The 50-day moving average of $89,243.98 provides dynamic support, while the 200-day average at $106,601.45 represents a key resistance zone. Bitcoin’s year-to-date performance demonstrates resilience despite regulatory headwinds and macro uncertainty. The asset’s ability to hold above $91,479.28 (the day low) will be critical for maintaining bullish momentum.
Bitcoin USD is consolidating near $93,870.06 on January 8, 2026, after a brief rally that tested $95,000. The 0.79% daily decline reflects profit-taking pressure and ETF outflows of $243 million, with liquidations exceeding $440 million. Technical indicators show neutral momentum (RSI 55.08) and overbought conditions (CCI 189.44), suggesting a pullback is healthy before the next leg higher. Market data indicates institutional investors are rotating positions rather than exiting, as evidenced by mixed ETF flows. Key catalysts ahead include the Senate vote on the Clarity Act and Morgan Stanley’s ETF applications, both of which could reignite institutional demand. Bitcoin’s year-to-date gain of 11.39% and 12-month return of 18.43% demonstrate underlying strength despite near-term consolidation. Traders should monitor support at $91,479.28 and resistance at $94,825.27 for directional clues. The broader crypto market’s recovery, with altcoins gaining $250 billion in market cap, suggests risk appetite remains intact. Bitcoin’s ability to hold above the 50-day moving average of $89,243.98 will determine whether the current pullback is a healthy correction or the start of a deeper decline.
Bitcoin declined due to profit-taking after rallying near $95,000 earlier in the week. ETF outflows of $243 million and liquidations exceeding $440 million accelerated the pullback. Technical overbought conditions (CCI at 189.44) also triggered selling pressure as traders locked in gains.
Monthly forecast: $95,858.57 (2.12% upside). Quarterly: $135,658.38 (44.4% gain). Yearly: $93,717.01 (consolidation). Three-year: $117,056.86. Five-year: $140,315.28. Forecasts depend on regulatory clarity and institutional adoption.
Bitcoin shows mixed signals. RSI at 55.08 is neutral, but CCI at 189.44 and Stochastic %K at 84.71 indicate overbought conditions. This suggests short-term consolidation is likely before the next directional move.
Support: $91,479.28 (day low), $89,243.98 (50-day MA), $84,187.70 (Bollinger lower band). Resistance: $94,825.27 (day high), $96,541.14 (Keltner upper), $106,601.45 (200-day MA).
Mixed flows: BlackRock’s IBIT saw $228M inflows, but Fidelity’s FBTC led redemptions at $312M. Net outflows totaled $243M on Tuesday, reflecting profit-taking and position rotation among institutional investors.
Senate vote on the Clarity Act (expected next week), Morgan Stanley’s spot Bitcoin ETF approval, stable equity markets, and reduced regulatory uncertainty. Positive developments could drive Bitcoin toward $100,000 and beyond.
Disclaimer:
Cryptocurrency markets are highly volatile. This content is for informational purposes only.
The Forecast Prediction Model is provided for informational purposes only and should not be considered financial advice.
Meyka AI PTY LTD provides market data and sentiment analysis, not financial advice.
Always do your own research and consider consulting a licensed financial advisor before making investment decisions.
1. What is the current price range of Dogecoin in 2026?
Dogecoin trades near $0.14 to $0.15 at press time with daily volume near $1.4 billion.
2. Can Dogecoin really fall below one cent in 2026?
Yes, but it would need a severe crypto market crash and strong sell pressure across meme coins.
3. How does Dogecoin supply affect its price?
Dogecoin adds about 5 billion new coins each year, which increases pressure during weak markets.
4. Do ETF developments matter for Dogecoin?
Yes, ETF filings improve sentiment and keep institutional interest alive even without approval.
5. Does Dogecoin have real-world use?
Dogecoin sees limited utility but benefits from fast transfers, simplicity, and wide exchange support.


