The main category of Crypto News.
You can use the search box below to find what you need.
[wd_asp id=1]
The main category of Crypto News.
You can use the search box below to find what you need.
[wd_asp id=1]
Cardano has dropped 3.5% to $0.91, placing the cryptocurrency at a pivotal support level that traders are closely watching. The ADA token currently trades within a tight consolidation range of $0.90-$0.96 after several days of sideways movement.
Despite the price decline, trading activity has intensified dramatically. Cardano futures volume surged to $6.96 billion, representing the highest level recorded in five months since March 2025.
Daily spot trading volume also increased 12% from the previous session. This surge in market participation suggests heightened interest from both institutional and retail traders as ADA approaches critical price levels.
The current price action has placed Cardano at a make-or-break technical juncture. If ADA closes a daily candle below the $0.90 support zone, analysts predict a potential 6.5% decline to the $0.835 level.
 Price Prediction: Bulls Defend Critical Support Level as M Exits Exchanges")
However, bullish signals are emerging on shorter timeframes. The TD Sequential indicator has flashed a buy signal on the hourly chart, suggesting potential exhaustion in the current downtrend.
Cardano is also forming a symmetrical triangle pattern on daily charts. This formation typically resolves to the upside when it appears after a strong uptrend, with measured move targets pointing toward $1.08-$1.10.
The Supertrend indicator remains in bullish territory, hovering above the current price and indicating the broader uptrend structure remains intact.
On-chain data reveals strong accumulation activity among Cardano holders. Exchange outflows totaled $25.94 million worth of ADA tokens over the past 24 hours, suggesting investors are moving coins to cold storage.
This pattern typically indicates long-term holders are taking advantage of lower prices to increase their positions. The sustained outflows could help reduce selling pressure and provide underlying support for ADA’s price.
Liquidation maps show concentrated positions at $0.876 below and $0.928 above current levels, marking zones where over-leveraged traders face potential forced closures.
South Korean markets have become a dominant force in Cardano trading. The ADA/KRW pair now generates nearly twice the volume of Coinbase’s ADA/USD market, climbing to third place globally.
This geographic shift in trading activity often correlates with increased volatility and more dynamic price discovery. Korean retail interest has historically been a catalyst for sharp moves in cryptocurrency markets.
If Cardano successfully defends the $0.90 support zone, the next upside target sits at $0.969 resistance. A clean break above this level could trigger a more substantial rally toward $1.15-$1.20.
The convergence of record futures volume, technical buy signals, and exchange outflows creates multiple supportive factors for ADA’s price. However, the psychological $1.00 resistance level remains the key barrier that has previously capped rally attempts.
Traders are positioning for potential breakout scenarios while monitoring whether current support levels will hold under pressure.
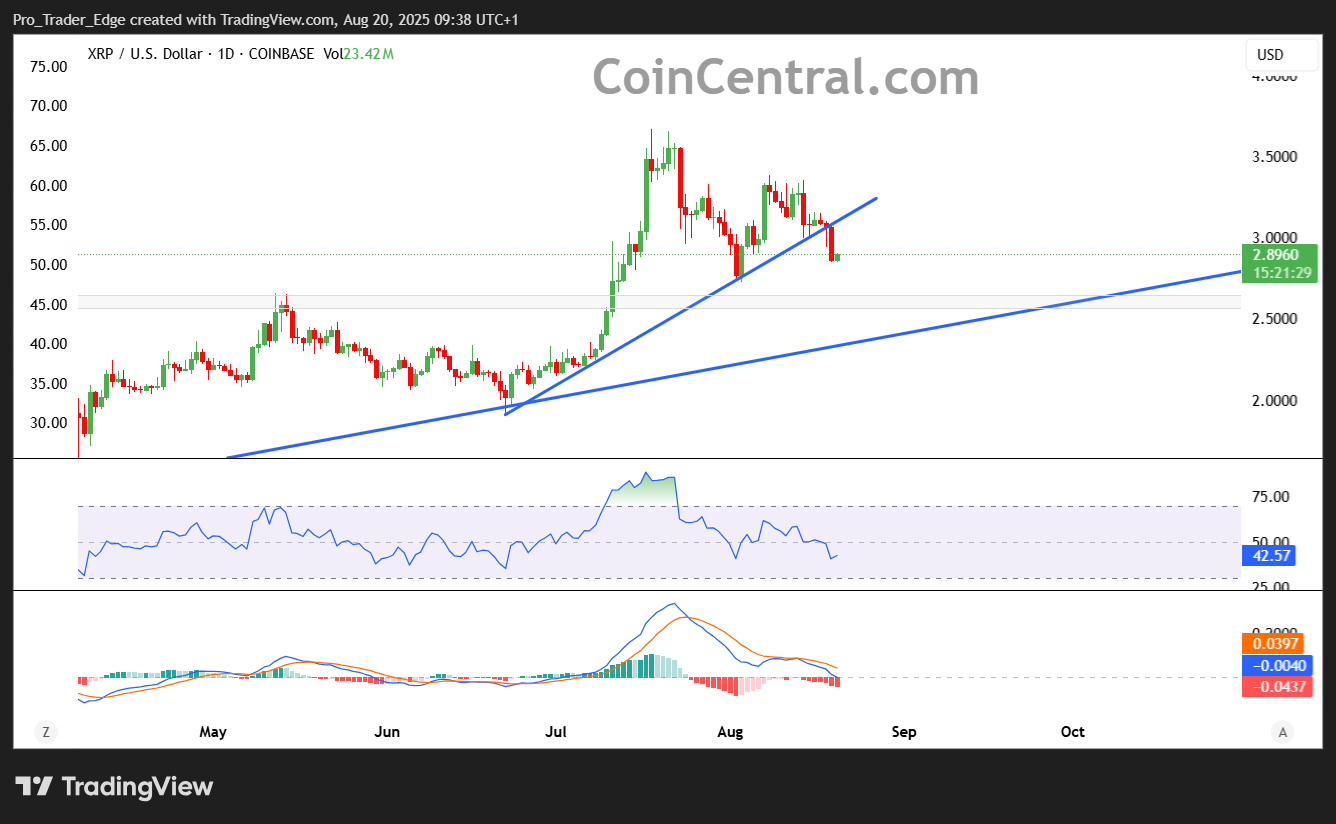
XRP price crashed below the critical $3 level today following news that SEC commissioners have pushed back decisions on spot cryptocurrency ETF applications until October 2025. The delay has created fresh uncertainty for XRP investors who have been waiting for regulatory clarity.
The XRP token declined 2% in the past 24 hours, testing support near $2.85. This price action comes despite positive developments in the token’s fundamentals and adoption metrics.
Data from Glassnode reveals XRP supply held on centralized exchanges has fallen to just 5.66%. This represents the lowest level in a month and marks a 3% decrease since August 9, 2025.
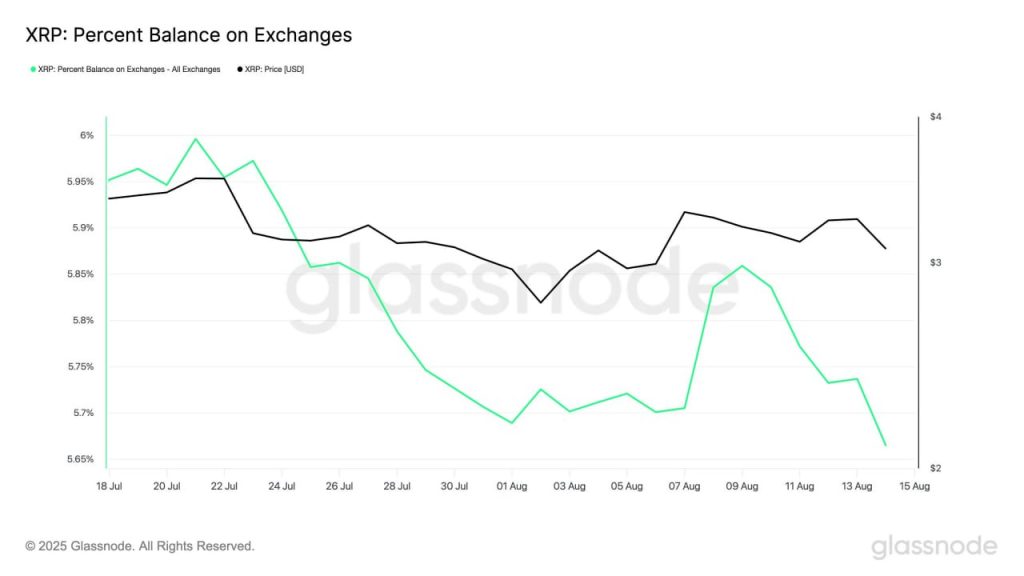
The reduction in exchange holdings typically signals reduced selling pressure. When investors move tokens to self-custody wallets, it often indicates confidence in holding rather than selling.
XRP price analysis shows the token trading below its 100-hourly Simple Moving Average. The cryptocurrency tested a low of $2.850 after breaking down from previous highs around $3.095.
The Relative Strength Index (RSI) currently reads 32, placing XRP in oversold territory. This technical metric suggests the token may be due for a bounce from current levels.
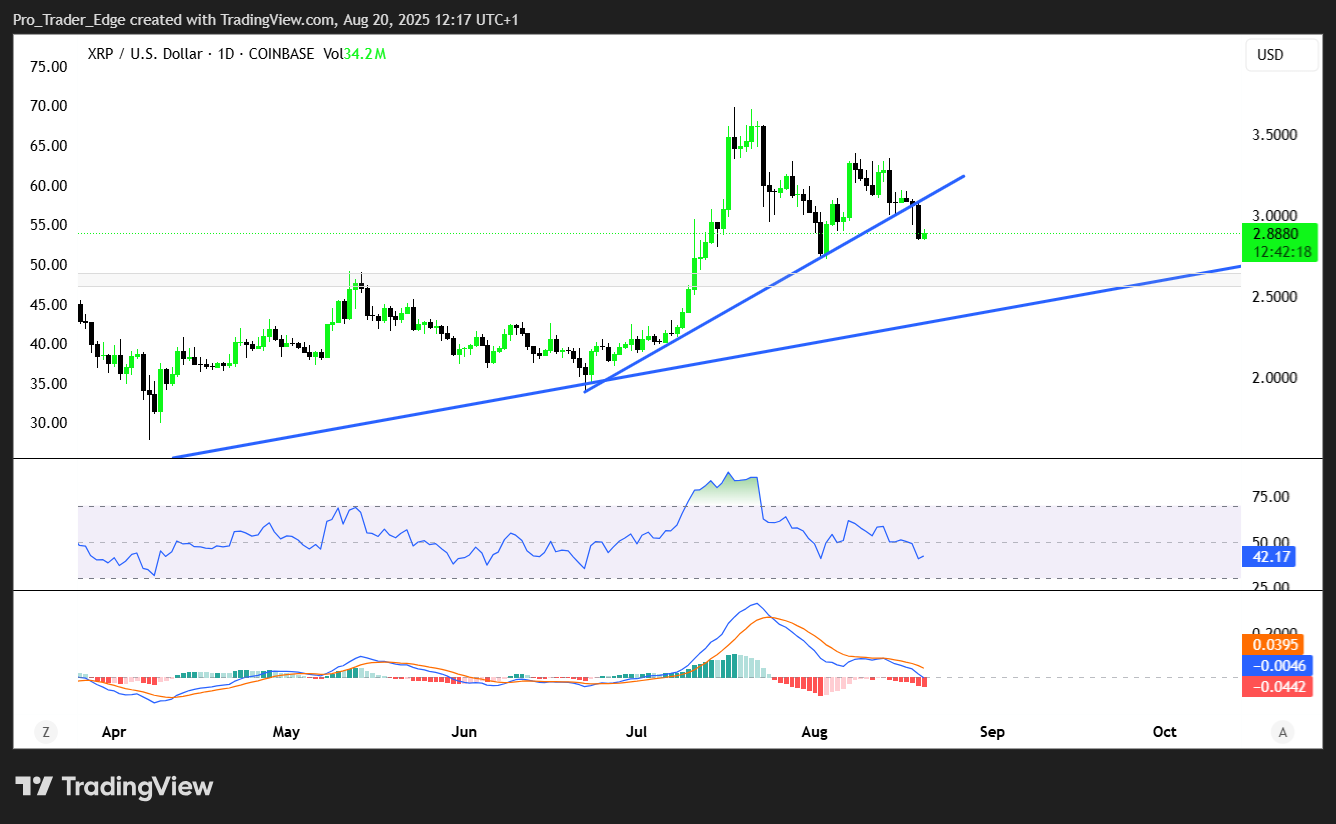
However, the MACD indicator shows bearish momentum continues to build. The hourly MACD is gaining pace in the bearish zone, indicating potential for further downside.
Key resistance levels include $2.920 and $3.00 for any recovery attempt. A clear break above $2.920 could open the path toward the psychological $3 level.
Support levels sit at $2.850 and $2.740. A breakdown below $2.80 could trigger additional selling toward the $2.720 zone.
While regulatory approval remains pending, XRP adoption continues expanding across multiple sectors. The token can now be used for booking flights, hotels, and various other services.
Ripple recently launched an XRP Rewards Event for community members. This initiative has generated enthusiasm despite the current price weakness.
The company continues pursuing its U.S. bank license application alongside waiting for ETF approval. These regulatory processes remain key catalysts for future XRP price movement.
Mass adoption metrics show growing utility for XRP in real-world payment applications. This fundamental strength contrasts with the current technical weakness in price action.
XRP faces immediate resistance at $2.92 with the next major hurdle at $3.050. The cryptocurrency needs to reclaim $3 support to avoid testing lower levels in coming sessions.
Solana price is testing a key support zone near $175, with traders watching closely to see if a breakout towards $200–$210 is on the horizon.
Market watchers are eyeing Solana price closely as the token hovers near a decisive support zone, suggesting a sharp move could be around the corner. Analysts argue that if momentum shifts here, the Solana price prediction could lean toward a renewed push into the $200–$210 range, setting the stage for its next big move.
Solana price has retraced into the golden pocket around the $178 to 172 range, aligning with the 0.618 Fibonacci level that often serves as a decisive support area in trending markets. This pullback comes after the price stalled near $200, with volume tapering down as buyers await confirmation of a base. If SOL holds within this pocket, it could set the stage for a reversal attempt, especially since prior consolidations at similar levels have sparked strong continuation moves.
Solana dips into the golden pocket, holding above $172 as price eyes a potential rebound. Source: MacroCRG via X
Structurally, MacroCRG’s daily chart shows a healthy correction rather than a breakdown, with the higher-low pattern still intact as long as $170 remains defended. A rebound from here would place $195 and $210 back in play as near-term targets, while failure to hold could expose SOL to deeper retracement toward the $160 demand zone.
Fresh data from CW8900 shows that Solana has cleared out the bulk of its highly leveraged long positions, leaving only a small pocket of exposure still active. This could potentially reduce the risk of cascading liquidations, helping the market establish a healthier footing.
With fewer aggressive longs in play, price action can stabilize more organically, allowing spot demand and moderate leverage to guide the next move.

Solana clears excess leveraged longs, resetting near $178 as market conditions stabilize. Source: CW8900 via X
SOL is beginning to base out around the $178 zone; however, it still has the space to take liquidations out till $175. Participants are watching closely to see if this reset creates breathing space for Solana to reclaim lost ground and reattempt higher levels once market conditions settle.
The latest analysis from CryptoFayZ shows Solana pressing against a descending trendline that has capped momentum throughout its recent pullback. Price action has coiled beneath this barrier, with $185 to $188 emerging as the immediate test zone. If rejected here, SOL Solana price could revisit support levels near $175 before attempting another rebound. This retest would align with the broader corrective structure.

Solana tests descending trendline resistance near $185–$188, with a breakout eyeing $200–$215 upside. Source: CryptoFayZ via X
However, a successful break above the trendline would shift momentum quickly in favor of buyers. The projection outlined suggests that once reclaimed, Solana could accelerate toward $200 and potentially extend into the $210 to $215 range, reclaiming its prior highs. With structure still favoring higher lows above $170, the battle at this resistance may determine whether SOL enters another leg of consolidation or sets the stage for a stronger bullish breakout.
On the back of the ongoing corrective wave, Solana has slipped into oversold territory on the RSI heatmap, with its relative strength index now sitting around the mid-30s. Historically, readings at this level have often signaled exhaustion of selling pressure, where downside momentum begins to fade and the market looks for equilibrium. For SOL, this aligns with its recent retest of the $178 to $175 range, suggesting that price may be nearing conditions suitable for a relief bounce if buyers step back in.
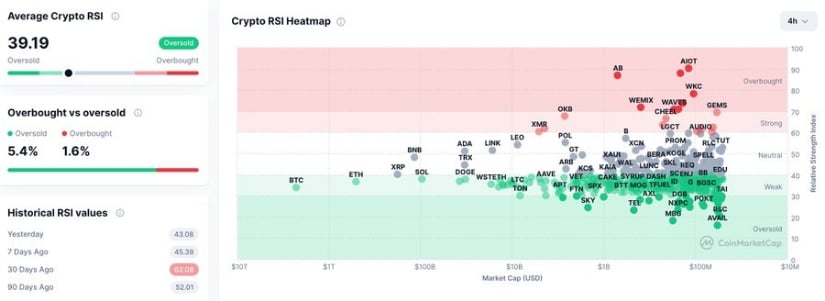
Solana slips into oversold RSI territory near $175, hinting at a potential relief bounce. Source: Rand via X
With SOL defending higher-timeframe support near $170, participants will be watching closely to see if momentum stabilizes and flips upward. If a rebound takes shape, reclaiming $190 to $195 becomes the first checkpoint to confirm strength before any push towards the $200 mark.
Unlike the bearish takes in the market, analyst Crypto King holds a bullish view on Solana’s trajectory. He highlights the uptrend support as the critical level to watch, where a potential bounce could confirm higher lows and keep the broader structure intact. With Solana price hovering near the $178 to $175 zone, this area becomes the battleground for bulls aiming to reassert momentum.
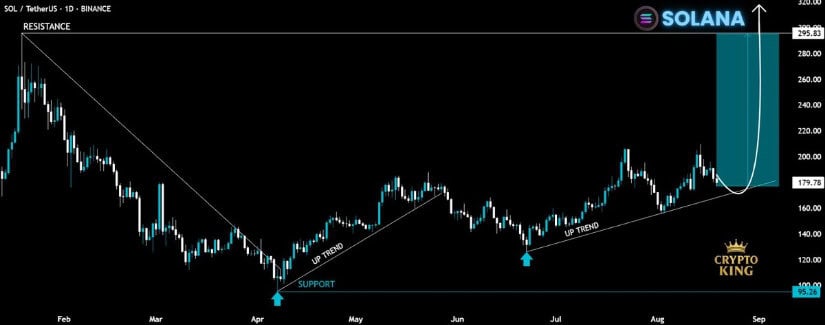
Analyst Crypto King outlines a bullish Solana outlook. Source: Crypto King via X
Crypto King suggests that if Solana reacts positively here, the path towards $195 to $200 may open in the near term, with a broader upside target extending to the $295 range highs. His outlook frames the current pullback as a constructive setup rather than weakness.
Solana price now stands at a true crossroads, with its next move likely to dictate the broader narrative. The golden pocket support near $175 to $178, coupled with oversold RSI readings, tilts the setup toward a potential rebound. If bulls can defend these levels and push through the $185 to $188 trendline, the Solana price prediction points toward a run into the $200 to $210 zone. Such a move would validate the higher-low structure and frame this correction as a healthy reset rather than a breakdown.
On the other hand, failure to hold above $170 could unravel this constructive outlook. A deeper slide toward $160 would not only test buyers’ conviction but also expose SOL Solana price to more downside liquidity.
XRP price has experienced a sharp decline, falling below the $3 mark as regulatory uncertainty continues to weigh on the cryptocurrency. The price drop came after the SEC announced another delay for spot ETF applications, including XRP, pushing decisions to October 2025.
The cryptocurrency fell 2% in the past 24 hours following the SEC announcement. XRP tested the $2.85 support level after declining from previous highs near $3.095.
Technical analysis shows XRP trading below the $3 resistance zone and the 100-hourly Simple Moving Average. The price has struggled to maintain support above $3 and remains vulnerable to further losses.
Exchange data reveals an interesting development despite the price decline. XRP supply held on centralized exchanges dropped to just 5.66%, marking the lowest level in a month. This represents a 3% decrease since August 9, according to Glassnode data.
The reduction in exchange holdings suggests investors are moving their XRP tokens into self-custody wallets. This trend typically indicates reduced selling pressure as tokens held on exchanges are more likely to be sold.
The Relative Strength Index (RSI) currently sits at 32, placing XRP in oversold territory. This technical indicator suggests the cryptocurrency may be due for a bounce from current levels.
However, the MACD indicator presents a different picture, showing bearish momentum. The conflicting signals indicate potential for continued downside before any recovery materializes.

Key resistance levels include $2.92 and $3.00, while support levels are positioned at $2.85 and $2.74. A break below the $2.80 support could trigger further declines toward $2.72.
The price action has formed what analysts describe as a potential double bottom pattern near the $2.90 support level. This technical formation could prove bullish if the support holds.
While waiting for U.S. regulatory approval, XRP adoption has continued expanding across various sectors. The cryptocurrency can now be used for flights, hotels, and other services.
Ripple recently launched an XRP Rewards Event for its community, generating enthusiasm despite the price decline. The company continues pursuing its U.S. bank license application alongside the pending ETF decision.
The SEC delay until October 2025 extends the regulatory uncertainty that has surrounded XRP for years. Market participants now await clarity on the ETF applications and broader regulatory framework.
XRP currently faces immediate resistance at $2.92, with a clear break above this level potentially opening the path toward $3.00. Failure to hold current support levels could result in further downside toward $2.74.
The hourly MACD indicator shows increasing bearish momentum, while the RSI below 50 confirms the current downward trend. These technical factors suggest caution for potential buyers at current levels.
Solana and Cardano both saw price declines over the weekend, causing some analysts to make bearish Solana price predictions. With both projects now stagnating, many investors are diversifying with Rollblock.
Having gained significant momentum over the past quarter, Rollblock has been hailed as the best crypto to buy now, with its price expected to soar once it hits exchanges later this year.
Rollblock (RBLK) has become a massive hit in the DeFi market. In less than a year it amassed an audience of over 50,000 players who have wagered over $15 million on its platform.
Rollblock’s GambleFi protocol overhauls the traditional online gaming system. It uses blockchain technology to secure transactions, removing the risk of scams and bid manipulation. The platform itself showcases over 12,000 games including a sportsbook covering soccer, golf, MMA, and more.

In addition to its wide range of gaming options, Rollblock also offers a unique revenue share mechanism. The platform uses up to 30% of its weekly revenue to buy RBLK, the project’s utility token, from the open market.
60% of these tokens are burned, making RBLK deflationary. The remaining tokens are then allocated to rewards, allowing investors to earn a passive income without even needing to play games.
Here are several standout features that have investors excited:
The Rollblock presale is quickly selling out. The project has raised over $11.4 million and tokens are now available for just $0.068. Many experts believe that Rollblock could hit $1 before the end of 2025 making now a great time to get involved before RBLK soars.
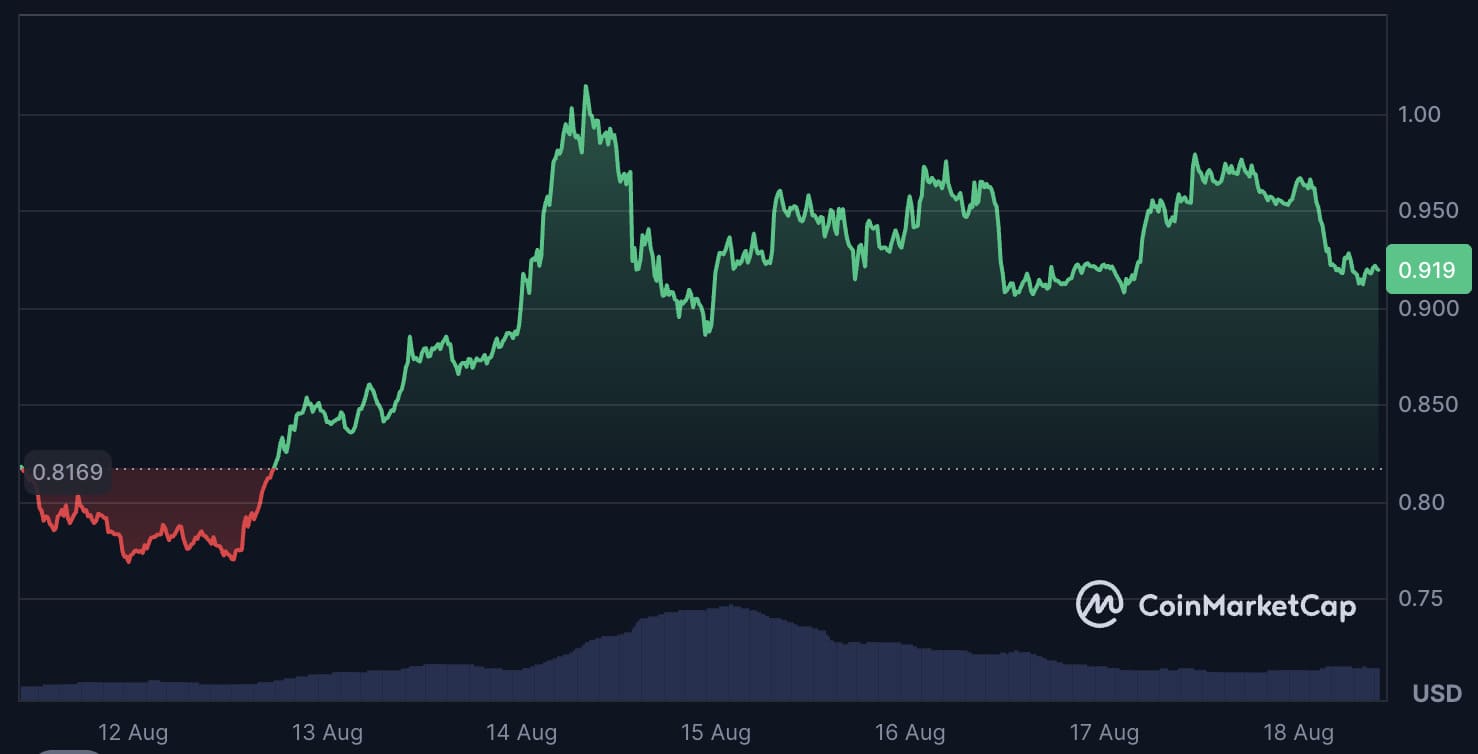
Over the past week, Cardano briefly hit $1 before crashing to $0.9163. This decline was heavily influenced by an increase in selling pressure, with many investors cashing out their Cardano tokens to buy other assets like Rollblock.
According to crypto analyst Ali Charts, Cardano could break out of a triangle formation this week to reach $1.10. Having already rallied by 11% in the last week, this would require significant momentum and bullish Cardano news.
As of August 18 Cardano was trading at $0.9163 following a 4% daily decline. Cardano’s daily trading volume has remained stable at $2.27 billion, suggesting that investors are waiting for more price activity before they take action.
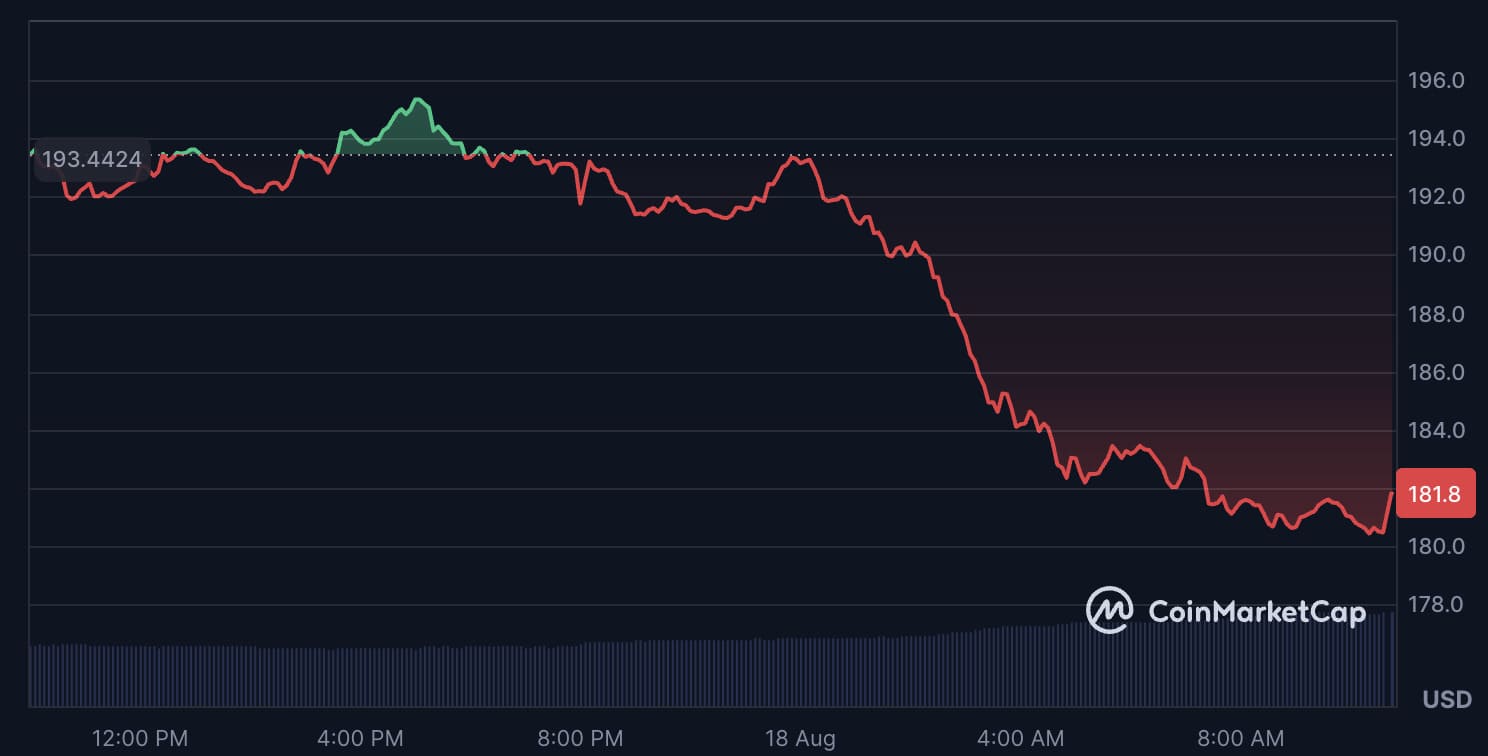
Following a weekend slump, the number of on-chain Solana (SOL) liquidations were 79% higher than centralized exchange activity. In total Solana had $37.4 million in on-chain liquidations with $20.9 million being recorded on-chain.
At the same time Solana’s price had taken a dip. In the last 24 hours alone Solana’s price has fallen by 5.31%, taking SOL to $181.76. Solana’s daily trading volume has increased by 50% to $5.76 billion, suggesting that investors are using this dip as an opportunity to buy low.
Solana price predictions are now mixed. Ali Charts believes that $171 is a key support for SOL. If SOL dips below this, it could fall to $150. That said, Solana could ride bullish market momentum to pass $200 before the end of August.
With Solana and Cardano facing dips over the weekend, many investors are choosing to double down on Rollblock. Though not as established as SOL or ADA, Rollblock offers fantastic utility and its low market cap means that 100x returns could be on the table this year!
Discover the Exciting Opportunities of the Rollblock (RBLK) Presale Today!
Website: https://presale.rollblock.io/
Socials: https://linktr.ee/rollblockcasino
This article contains information about a cryptocurrency presale. Crypto Economy is not associated with the project. As with any initiative within the crypto ecosystem, we encourage users to do their own research before participating, carefully considering both the potential and the risks involved. This content is for informational purposes only and does not constitute investment advice.
Ethereum’s price has faced a sharp correction after failing to hold above $4,700. The digital asset slipped to $4,335, marking a 4.35% daily decline. The shift in sentiment signals rising bearish outlook, as profit-taking among whales accelerates. Traders are now questioning whether Ethereum will retest the key $4,000 support level before any potential recovery.
Ethereum’s price has lost ground since its highs above $4,700. Currently, it sits around the $4,300 level, with a key trendline still offering some support. However, pressure is mounting near the critical $4,000 zone, with technical indicators pointing to further downside risk.
The Stochastic RSI is currently at 36, suggesting a reduction in buying strength. With this momentum shift, Ethereum price prediction leans toward a possible dip before any rebound. The $4,000 level remains a significant support area, which could act as a major test for buyers.
Resistance lies near $4,800, with any breach above this price likely to attract renewed bullish interest. However, given the current sell pressure, Ethereum may need to revisit lower levels before it can challenge these higher price points. A strong test of the $4,000 support may dictate Ethereum’s short-term direction.
Recent data from Lookonchain reveals notable whale activity, which has added to the selling pressure on Ethereum. One trader recently closed all 66,749 ETH long positions, realizing a profit of $6.86 million. Such large-scale profit-taking is intensifying market fears, as traders exit their positions.
This legendary trader has closed all 66,749 $ETH($303M) longs, locking in a profit of $6.86M(55x)!
Starting with only $125K, his total account equity peaked at over $43M(a 344x return), but now stands at $6.99M(a 55x return) after closing.https://t.co/E0iU5Pk3Q6 pic.twitter.com/NHMicKo6b3
— Lookonchain (@lookonchain) August 18, 2025
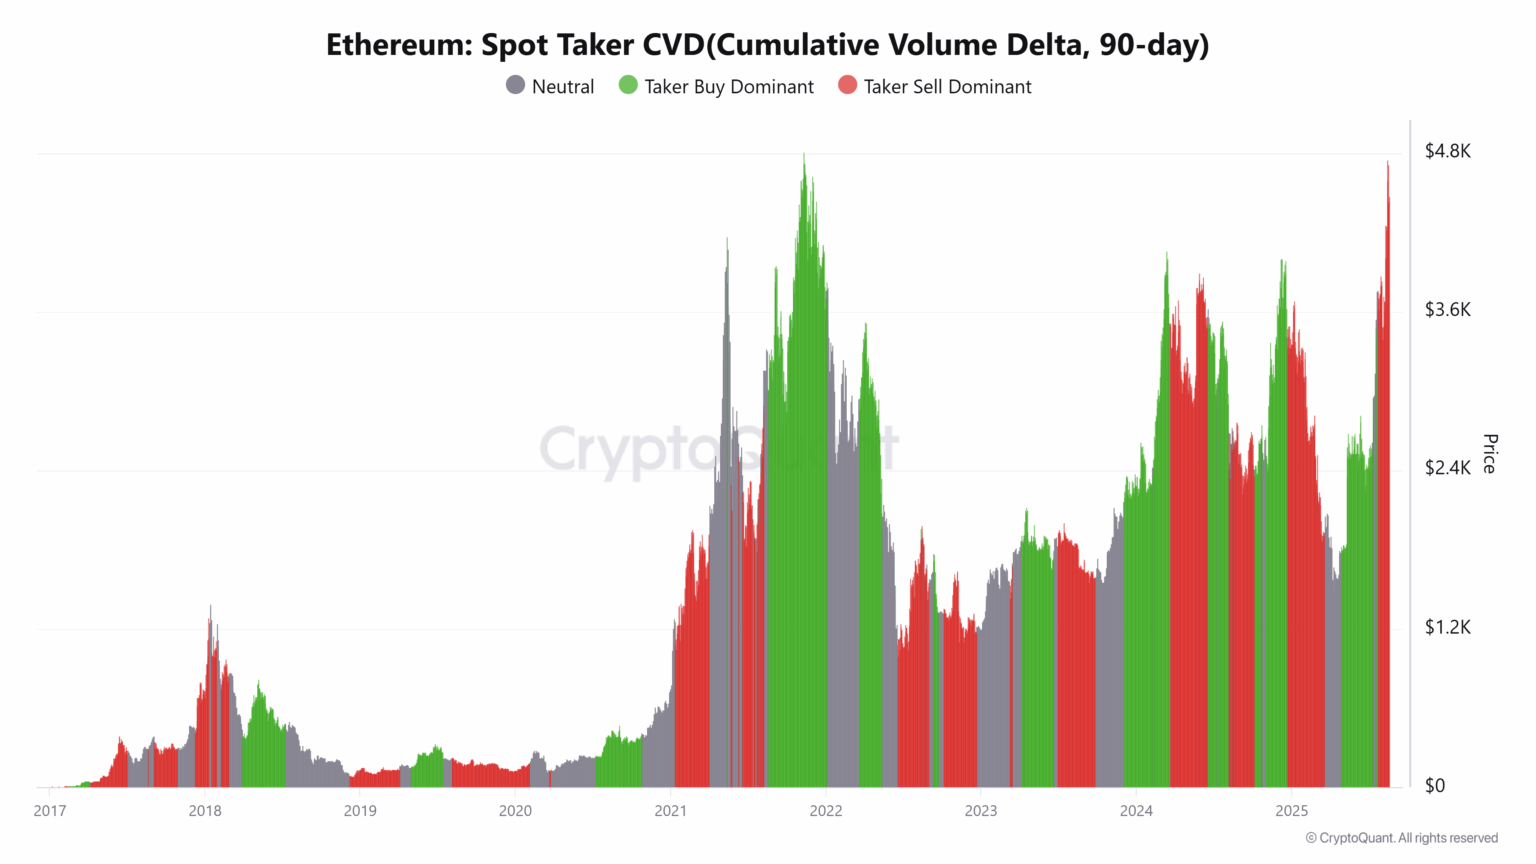
Additionally, another whale panic-sold 2,277 ETH worth $9.57 million at $4,203, locking in a profit of $4.04 million. These exits, coupled with rising sell-side pressure, have tipped the scales in favor of bears. According to CryptoQuant’s Spot Taker CVD, sellers have firmly controlled the market in recent sessions.
Ethereum’s price prediction reflects these dynamics, suggesting a continued struggle for buyers to regain control. Increased institutional buying could offer some support, but for now, the coordinated selling wave remains dominant. If this trend continues, Ethereum may revisit the $4,000 support level before any potential recovery attempt.
As profit-taking continues, Ethereum price remains under significant downward pressure. The $4,000 level will be key in determining the near-term market direction. If Ethereum fails to hold above this support, the bearish outlook could deepen, pushing the price lower.
The Ethereum price prediction remains cautious, with bearish sentiment growing stronger as whales dominate market movements. Ethereum’s ability to recover depends on whether the $4,000 support can withstand the selling pressure.
While XRP extended losses on spot XRP ETF disappointment, Bitcoin (BTC) closed below the key $115,000 support level for the first time since August 5. Recent inflation-linked US economic data has fueled uncertainty about the Fed’s policy stance ahead of the Jackson Hole Symposium.
Fed Chair Powell will speak on Friday, August 22. The Fed Chair may signal a delay to interest rate cuts to continue assessing the impact of tariffs on import prices and inflation.
Delays to Fed rate cuts would keep borrowing costs elevated and strengthen the US dollar, impacting BTC’s store of value position. On the other hand, support for multiple Fed rate cuts could soften the US dollar, reduce borrowing costs, and boost demand for BTC and other risk assets.
Market concerns about Chair Powell’s stance on monetary policy also impacted spot BTC ETF flows. According to Farside Investors, the US BTC-spot ETF market reported total net outflows of $121.7 million on August 18. Outflows accelerated on August 19. Key flows included:
With BlackRock (BLK) iShares Bitcoin Trust (IBIT) flow data pending, total US BTC-spot ETF outflows reached $523.3 million, potentially extending the outflow streak to three sessions. BTC flow trends remain crucial for the supply-demand balance and the token’s price trajectory.
Bitcoin slid 2.94% on Tuesday, August 19, following the previous day’s 1.03% loss, closing at $112,881.
Looking ahead, several key events will dictate the near-term price trajectory. These include:
Potential scenarios:
XRP has been on a wild ride in 2025, shooting past $3 and putting almost 94% of its circulating supply into profit. That’s a huge 500% jump from earlier this year when it was barely trading at $0.40.
But here’s the catch: every time XRP holders have hit this level of profit in the past, it’s been a warning sign. Back in 2018 and again in 2021, XRP saw the same kind of setup, and both times it ended with brutal crashes of 85-95%. Meanwhile, some traders are hedging bets on fresh presales like Layer Brett (LBRETT), which they see as a way to balance risk while chasing new upside.
XRP’s price action right now is walking a fine line. The token is trading inside a descending triangle, a bearish setup that often points to downside risk. Support sits around $3.00, but XRP has already flirted with breaking below that level once, sparking fears of a drop toward $2.39, about a 26% slide from where it stands.
Still, it’s not all doom and gloom. If fresh institutional inflows kick in and XRP can hold above $3.05, there’s a chance it could flip the script. Breaking above $3.25-$3.50 would put $5 back on the table, with some analysts even eyeing $6-$7.20 if momentum really takes off. The next few weeks will tell the story about the XRP price prediction.

XRP’s outlook for 2026-2027 looks a lot better than the short-term swings make it seem. Both the 50-day and 200-day moving averages are pointing upward. This usually signals a strong long-term trend.
Also, the RSI is in a neutral zone, so there’s no sign of the coin being overbought or oversold. With no big warning signals on the charts, XRP could keep consolidating for now before deciding on its next move.
By 2028-2030, the big question is whether XRP can finally hit $10. The coin has a habit of moving in sharp cycles, usually exploding during major bull runs or when new adoption news makes headlines.
The chart says it first needs to clear the $6-$8 wall before aiming for double digits. Sure, regulation and competition are still risks, but $10 isn’t off the table. And with newer players like Layer Brett (LBRETT) showing what fresh tech and hype can do, the race for dominance could get really interesting.
XRP’s future really comes down to a few big things: clear rules from regulators, how widely it gets used for cross-border payments, and whether Ripple keeps landing deals with banks and fintechs. On top of that, investor mood during each crypto cycle will matter a lot since XRP tends to run in sharp bursts.
While some are betting big on XRP’s steady utility, others are looking at newer projects like Layer Brett (LBRETT) in crypto presale, which blends meme token appeal with real tech. It’s built on Ethereum Layer 2, and this memecoin is already rocking in presale.

XRP’s long-term case still rests on adoption in payments and banking, with many investors eyeing that $10 target by 2030. But while Ripple builds slowly and steadily, some traders are diversifying into Layer Brett (LBRETT), a cheap presale coin with staking rewards that could mirror early-stage XRP growth.
Presale: LayerBrett | Fast & Rewarding Layer 2 Blockchain
Telegram: Telegram: View @layerbrett
X: (1) Layer Brett (@LayerBrett) / X
This article contains information about a cryptocurrency presale. Crypto Economy is not associated with the project. As with any initiative within the crypto ecosystem, we encourage users to do their own research before participating, carefully considering both the potential and the risks involved. This content is for informational purposes only and does not constitute investment advice.
The crypto market has been buzzing as investors eye Ripple’s next move. With XRP price prediction heating up and whales like JP Morgan quietly accumulating billions worth of tokens, the stage is set for high volatility ahead. Ripple’s recent dip hasn’t shaken big players; instead, it’s fueling speculation about a breakout.
But while XRP price prediction grabs headlines, Unilabs Finance is emerging as a strong alternative with its AI-backed asset management model and rapidly growing presale momentum. Continue reading this article to find out more about it.
Ripple fell roughly 6% in the last 24 hours, returning to the $2.95-$3.00 range after briefly reaching $3.14 earlier in the session. The dip coincided with the larger crypto sell-off, prompted by fears about US Federal Reserve policies and strong selling pressure in BTC and ETH.
In contrast, according to CoinMarketCap, Ripple’s trading volumes increased 115% during the fall, suggesting that smaller retail investors panicked while larger players secretly bought them. Blockchain trackers suggest that the Ripple whales have been exceptionally active despite market volatility.
Between August 12 and 15, more than 440 million XRP, or about $3.8 billion, flowed into whale-controlled accounts. On August 15, 120 million tokens were taken in despite Ripple’s market capitalization falling by over $10 billion.
These confusing movements have shaken up the XRP price predictions. However, as per the latest XRP price prediction, Ripple’s $3.00 to $3.10 support band has become the battlefield. If buyers hold that line, XRP might make another push for the $3.20-$3.35 resistance level. A break above it can translate to a 60% rise, with targets reaching $4.47 in the coming months.
However, the risks are also evident with this XRP price prediction. If $3.00 fails, XRP may fall below $2.70, or worse, to $2.50 levels last seen earlier this summer. A symmetrical triangle on the 4-hour chart indicates that a breakthrough is coming; however, the direction is undecided.
The XRP price predictions are giving mixed signals, as whales are accumulating the Ripple token at a crazy pace despite its recent drop to new lows. However, amidst this, there is this one project, Unilabs Finance, that is showing clear signs of upcoming gains only.
Unilabs Finance is the world’s first completely AI-backed asset manager that is here to transform the way investors invest, manage, and allocate our capital.
The best part about Unilabs is its multi-fund working model. It offers a wide range of investment funds that align with different investor categories. These funds include the AI Fund, BTC Fund, RWA Fund, and Mining Fund. There is another thing that sets these funds apart, which is their launchpad, which uses AI to update investors about each micro movement in the market.
Another leading feature of Unilabs is its AI-powered portfolio management model. It lets investors reduce risk exposure to a greater extent, as this tool automatically updates investors’ portfolios with the ongoing market trends and shifts.
While prominent crypto projects have limited transparency, Unilabs is the only asset management platform that operates on a fully transparent profit-sharing system. It provides various investment options, such as yield and arbitrage, which are pooled and given to investors. This provides a regular source of profit and open access to fund performance.
Despite being introduced not long ago, Unilabs Finance has over $32 million in assets under management (AUM). This massive demand appears to be due to its AI-powered features, which help investors to stay ahead of the overall market and capitalize on each emerging opportunity.
This AI protocol is currently trending for its viral presale that has collected over $13.7M. Each UNIL token is currently priced at $0.01 as of stage 7, which has just recently started. Top market analysts forecast that if Unilabs continues to offer such high-end utility alongside high profit potential, it could soon be the leading name in its niche.
Presale: https://www.unilabs.finance/
Buy Presale: https://buy.unilabs.finance/
Telegram: https://t.me/s/unilabsofficial
Twitter: https://twitter.com/unilabsofficial

As of August 2025, Solana (SOL) remains a focal point in the cryptocurrency market amid a broader period of volatility. Priced at approximately $178.17, Solana holds the sixth position in market capitalization with a valuation of $95.9 billion, down slightly by -3% in the last 24 hours [1]. Analysts remain divided on the asset’s trajectory, with some expressing cautious optimism and others offering more bullish projections. Technical indicators such as the RSI at 57.85 and the 200-day SMA at $157.41 suggest a potential support floor, while key resistance levels sit near $179.34 and $188.53 [1].
If the current momentum continues, Solana could target a price range of $245 to $270 in the coming months, according to analysts [1]. A breakout above $200 is seen as a pivotal moment, particularly if institutional inflows and on-chain growth continue to accelerate [2]. More bullish forecasts suggest that Solana could reach $400 in 2025 and potentially surge to $1,351 by 2030 [3]. However, conservative estimates from Bitget project a significantly lower price point of $0.0007610 in 2025, raising questions about the reliability and methodology of such predictions [4].
The uncertainty surrounding Solana’s future is further compounded by the SEC’s delayed decision on spot ETF approvals, which has led to a pause in the asset’s recent rally [5]. Over the past 30 days, Solana has exhibited significant volatility, with a 71% price range and a maximum drawdown of -67.54% [1]. Despite this, Solana has outperformed major peers like Bitcoin and Ethereum, posting a 12-month return of +24.64% compared to Bitcoin’s -34.05% [1].
Beyond Solana, the broader market is keeping a close eye on emerging projects. Unich, a project built on similar infrastructure to Solana, is seen as a potential breakout candidate in Q3–Q4 2025, drawing comparisons to Chainlink’s recent 50% price surge [6]. GateToken (GT) is also preparing for cross-chain expansion into Solana and Cosmos by the end of 2025, signaling growing interest in interoperability within the DeFi space [7].
Solana’s ecosystem continues to gain traction, with key events such as Coinfest Asia reinforcing its growing influence. As the asset approaches critical technical levels and regulatory clarity, market participants will closely monitor institutional adoption and on-chain activity for further direction [1].
Source:
[1] https://partner.cryptopolitan.com/solana-sol-price-analysis-prediction-and-rising-crypto-to-watch-in-q3-q4-2025/
[2] https://bravenewcoin.com/insights/solana-price-prediction-bulls-hold-momentum-as-breakout-above-200-approaches
[3] https://coinpedia.org/price-prediction/solana-sol-price-prediction/
[4] https://www.bitget.com/price/homer-simpson(solana)/price-prediction
[5] https://coincentral.com/solana-rally-paused-pending-etf-approval-here-are-the-better-near-term-altcoin-plays-to-buy-right-now/
[6] https://thecryptobasic.com/2025/08/18/link-soars-50-in-just-two-weeks-whats-driving-the-surge-and-whos-next/
[7] https://coinmarketcap.com/cmc-ai/gatetoken/latest-updates/


