The main category of Crypto News.
You can use the search box below to find what you need.
[wd_asp id=1]
The main category of Crypto News.
You can use the search box below to find what you need.
[wd_asp id=1]
Terrill Dicki
Aug 16, 2025 06:22
Solana technical analysis points to potential $210-$218 targets within 2 weeks, though immediate support at $172-$176 remains critical for bullish continuation.
• SOL short-term target (1 week): $195-$205 (+4% to +10%)
• Solana medium-term forecast (1 month): $210-$225 range (+12% to +20%)
• Key level to break for bullish continuation: $200 resistance
• Critical support if bearish: $172-$176 zone
The latest SOL price prediction landscape reveals a fascinating divergence among analysts. CoinEdition maintains the most bullish Solana forecast, targeting $210-$213.26 in the short term, citing strong spot inflows and bullish momentum within a rising channel pattern. This optimistic view stands in stark contrast to FinanceFeeds’ more cautious $172 SOL price target, based on a bearish engulfing pattern formation at the $200 resistance level.
AI-powered models show mixed signals, with WalletInvestor’s algorithm suggesting a modest climb to $190.19, while CaptainAltcoin’s model predicts a pullback to $175.78. The consensus among these predictions indicates significant uncertainty around the critical $200 level, which has emerged as the key battleground for Solana’s near-term direction.
Most analysts agree that the $200-$220 range represents a crucial resistance zone that will determine whether SOL can sustain its bullish momentum or face a deeper correction toward the $170s.
Current Solana technical analysis reveals a cryptocurrency caught between competing forces. Trading at $186.81, SOL sits comfortably above all major moving averages, with the price positioned 71% up within the Bollinger Bands – indicating strong momentum but approaching overbought territory.
The MACD histogram reading of 1.2329 confirms bullish momentum remains intact, while the RSI at 55.27 sits in neutral territory, suggesting room for further upside movement without reaching overbought conditions. This technical setup supports the case for a continued rally toward the $200 resistance level.
Volume analysis shows robust participation with $765 million in 24-hour trading volume on Binance spot markets alone. The Average True Range of $11.10 indicates healthy volatility that could facilitate a breakout move in either direction.
The key pattern to watch is the potential cup-and-handle formation that CoinEdition identified, which historically suggests continuation patterns when confirmed with volume expansion above the $200 handle resistance.
The optimistic Solana forecast scenario targets $210-$218 within the next two weeks, representing a 12-17% upside from current levels. This SOL price target aligns with the technical resistance cluster identified by multiple analysts and represents the measured move from the cup-and-handle pattern.
For this bullish scenario to materialize, SOL needs to decisively break above $200 with strong volume confirmation. The next resistance levels sit at $209.86 (immediate) and $218-$220 (major), which coincides with previous swing highs and represents logical profit-taking zones.
A successful break above $220 could open the door for a test of the $240-$250 zone, bringing SOL within striking distance of its 52-week high at $261.97.
The bearish scenario for this SOL price prediction centers around a failure to break the $200 resistance, potentially triggering a pullback toward $172-$176 support levels. This downside target represents a 8-12% decline from current prices and aligns with the lower end of recent analyst predictions.
Key risk factors include broader cryptocurrency market weakness, profit-taking pressure near resistance, and the formation of bearish reversal patterns like the engulfing candle noted by FinanceFeeds. A break below $172 could accelerate selling toward the $155 strong support level, representing the lower Bollinger Band and a more significant 17% correction.
Based on current Solana technical analysis, a layered entry approach appears most prudent. For aggressive traders, buying near current levels around $185-$190 offers favorable risk-reward, with stops placed below $175 to limit downside exposure.
Conservative investors should wait for either a successful break above $200 with volume confirmation before entering, or alternatively, look for buying opportunities on any pullback toward the $175-$180 support zone.
Position sizing should reflect the medium confidence level of this SOL price prediction, with risk management paramount given the competing technical signals. A stop-loss below $172 represents logical risk management, as a break of this level would invalidate the bullish case and potentially trigger deeper selling.
This comprehensive Solana forecast suggests a cautiously optimistic outlook with a medium confidence level. The technical indicators support a potential move toward $210-$218 targets within the next 2-4 weeks, provided SOL can break decisively above the $200 resistance level.
Key indicators to monitor include volume expansion on any breakout attempt, RSI behavior near resistance levels, and broader cryptocurrency market sentiment. A failure to break $200 within the next week could signal the need to reassess this bullish SOL price prediction.
The timeline for this prediction to materialize spans the next 2-4 weeks, with the critical $200 level serving as the ultimate determinant of whether Solana can achieve these upside targets or face a correction toward $172-$176 support levels.
Image source: Shutterstock
Peter Brandt recently cosigned a new Bitcoin BTCUSD cycle chart that, in his opinion, shows the most likely scenarios as to where BTC could be headed next. The chart lines up all four major Bitcoin cycles since 2011, marking the time from bear market lows to peaks and from halving events to peaks. The first three cycles peaked 24, 28 and 33 months after their lows, and the current one is now about 29 months in from the 2022 low.
From the April 2024 halving, we are 17 months in. In the last two cycles, that is right around when prices reached their highs. If history repeats itself, the red “peak zone” on the chart will land somewhere between September and December of 2025.
Speaking about possible price ranges of the peak, the attention is on a mid-channel run that could land closer to $150,000–$180,000.
IMO this chart most captures the most likely scenarios for price of Bitcoin https://t.co/pB4HTXzVAD
However, hitting the upper red line, which past cycles have occasionally touched, would mean reaching a price of about $250,000-$280,000.
The chart also highlights the trend of decreasing returns — each cycle gains less than the previous one, and peaks take longer to form. Early cycles saw gains of 10,000%, 2,000% and 700%, but this run from $15,500 is at about +480%, so the climb may be smaller this time, though of smaller scale.
Bottom line
Brandt’s endorsement of the chart, of course, lends credibility to this idea, given his 50-years experience of market projecting. If Bitcoin continues to move in line with these patterns, the next 12-15 months could bring a new all-time high, even if the percentage gain is not as big as in previous years.
The only question is whether new factors, such as ETF flows, interest rates and global liquidity, will change that timeline.
Disclaimer: This is a Press Release provided by a third party who is responsible for the content. Please conduct your own research before taking any action based on the content.
Let’s be honest: when ADA was trading above $3, it felt like “when” not “if.”
Now, everyone’s wondering: Can Cardano get back to that level?
Well, some Cardano enthusiasts are optimistic. They point to a handful of catalysts like the Plomin hard fork, which rolled out decentralized governance in January, bigger DeFi TVL via platforms like Liqwid, MinSwap, and Indigo, and rising institutional interest. They argue those factors could reignite a rally toward the three-dollar zone.
Yet, most forecasters are more cautious as they see ADA hovering between $0.80 and $1.40 in 2025, with a stretch ceiling in the $2 range if market conditions turn bullish.
Now for the curveball most Cardano analysts are whispering about: Remittix (RTX), an emerging Ethereum-based DeFi project that’s already breaking new ground. They’re saying, “If you’re watching beyond ADA, pay attention here.”
There is this Golden Cross pattern, when the 50-day moving average crosses above the 200-day. Reddit traders who follow the Cardano price predictions closely spotted that setup, and they’re talking about a possible 230% jump, potentially pushing ADA near the $3 mark in roughly a month, if history repeats itself.
A lot is backing up the bullish case, but let’s not gloss over the hurdles:
Remittix is building a PayFi system that lets people send crypto-to-fiat payments across the globe, without the usual network of SWIFT or banks. It just works. That real-world use is grabbing just as much chatter as presales and tech specs.
Some analysts are calling Remittix a better growth play than Cardano for those looking for massive upside, a fast path to listing, and a defined remittance use case baked in from day one; they are even optimistic that the ongoing $250,000 could add to the hype.

In essence, Cardano price predictions show the coin might revisit $3 (especially if the Golden Cross plays out and investor sentiment returns). But for nimble traders, Remittix might offer bigger upside, right now, and that’s the smarter bet for explosive growth.
Discover the future of PayFi with Remittix by checking out the project here:
Website: https://remittix.io/
Socials: https://linktr.ee/remittix
$250,000 Giveaway: https://gleam.io/competitions/nz84L-250000-remittix-giveaway
Disclaimer: This media platform provides the content of this article on an “as-is” basis, without any warranties or representations of any kind, express or implied. We assume no responsibility for any inaccuracies, errors, or omissions. We do not assume any responsibility or liability for the accuracy, content, images, videos, licenses, completeness, legality, or reliability of the information presented herein. Any concerns, complaints, or copyright issues related to this article should be directed to the content provider mentioned above.
/div>
XRP remains in a consolidation phase on August 16, 2025, with the price currently hovering around $3.0785. The asset has failed to break past the $3.50–$3.66 resistance zone and continues to trade within a defined range above $3.00. Buyers have managed to hold the price above this critical level, while sellers consistently reappear whenever XRP approaches previous highs. The daily 24-hour trading range is between $3.001 and $3.1414, with trading volume slowing compared to earlier in the month [1].
Yesterday’s prediction correctly anticipated a sideways movement, as XRP has remained above $3.00 without significant upward movement beyond $3.15. This aligns with the expectation of a consolidation pattern following a strong price run from $1.61 to $3.66 earlier in August. Open interest and volume have both cooled, reinforcing the view that the market is entering a period of indecision [1].
Technical indicators reflect a mixed outlook. The Moving Average Convergence Divergence (MACD) shows a slightly bullish signal at 0.088, while the ADX(14) at 24.36 indicates a weak trend. The RSI is at 50.13, signaling neutrality, and the Ultimate Oscillator at 4.14 suggests bearish pressure. The Bull/Bear Power metric is at -0.1643, indicating a slight bearish control in the short term [1].
Analysts have outlined several potential price scenarios for XRP. A bullish case would require a break above $3.33 with strong volume, which could propel the price toward $3.50 and $3.66, with some forecasts eyeing a potential target of $3.90–$4.00. A neutral scenario projects continued sideways trading between $2.90 and $3.30 until a catalyst emerges. On the bearish side, a drop below $3.00 could see XRP fall to $2.85–$2.80, with $2.50 as a larger support area [1].
The broader market environment is also influencing XRP’s performance. A 1% decline on August 16 brought the price to around $3.05, with investors reacting to macroeconomic data such as the U.S. Producer Price Index (PPI) and concerns over delayed Federal Reserve rate cuts [3]. Open interest in XRP futures has declined below $8 billion, down from a peak of $9 billion earlier in the week, reflecting waning bullish momentum and cautious positioning among traders [4].
Market sentiment remains mixed. Retail activity is neutral, with no signs of overheating, but also lacking strong long-positioning. Institutional interest, however, is showing tentative support, with some analysts noting that XRP’s underlying fundamentals remain intact and could benefit from increased adoption in cross-border transactions [7]. A bullish flag pattern has also been identified, with forecasts suggesting a potential price target of $5 if sentiment and institutional adoption shift positively [6].
XRP’s immediate direction will depend on its ability to break out of the current range. A sustained move above $3.12 could reignite bullish momentum, while a break below $3.00 may lead to further consolidation or a deeper correction in the coming days [3].
Source:
[1] CoinAnk – [https://coinmarketcap.com/community/articles/689fd90d78799209467a4b46/](https://coinmarketcap.com/community/articles/689fd90d78799209467a4b46/)
[3] AInvest – [https://www.ainvest.com/news/xrp-news-today-xrp-price-stabilizes-3-12-technical-support-ema-cluster-resistance-2508/](https://www.ainvest.com/news/xrp-news-today-xrp-price-stabilizes-3-12-technical-support-ema-cluster-resistance-2508/)
[4] FXStreet – [https://www.fxstreet.com/cryptocurrencies/news/ripple-price-forecast-xrp-consolidates-amid-neutral-retail-activity-declining-open-interest-202508151545](https://www.fxstreet.com/cryptocurrencies/news/ripple-price-forecast-xrp-consolidates-amid-neutral-retail-activity-declining-open-interest-202508151545)
[6] Crypto News – [https://crypto.news/xrp-price-prediction-analyst-predicts-5-as-markets-weather-liquidation-storm/](https://crypto.news/xrp-price-prediction-analyst-predicts-5-as-markets-weather-liquidation-storm/)
[7] CoinCentral – [https://coincentral.com/xrp-price-prediction-ripple-struggles-to-hit-4-while-remittix-builds-momentum-toward-a-30x-target/](https://coincentral.com/xrp-price-prediction-ripple-struggles-to-hit-4-while-remittix-builds-momentum-toward-a-30x-target/)
Solana holds firm above key support as large holders accumulate, with ETF delays doing little to shake its long-term bullish structure.
After weeks of steady climbs, Solana is now holding firm around the $190 mark, a level that has flipped from stubborn resistance into solid support. The move comes as the SEC delays its decision on the Bitwise Spot Solana ETF, extending the wait but not dropping long-term optimism.
The SEC has officially extended its review period for the Bitwise Spot Solana ETF application, meaning a final decision will take a little longer than initially expected. While this delay may pause immediate market reactions, it does not indicate a rejection; regulatory processes often involve additional review periods before an approval or denial is issued.
Solana’s spot ETF decision faces an SEC delay. Source: SolanaFloor via X
For Solana, the extended timeline simply pushes the potential milestone slightly further out, but expectations for a spot ETF remain intact. Historical trends with Bitcoin and Ethereum ETFs show that delays are a normal part of the process, often preceding eventual approvals. Investors and market watchers will now be watching closely for the new decision date, as it could still serve as a key catalyst for SOL’s next major move.
The latest chart from analyst Ali Martinez shows Solana respecting a long-term ascending trendline that has been in place since early 2025. Price is currently consolidating just above the $195 to $200 zone, which also aligns with a key horizontal resistance-turned-support level. This structure is supported by a series of higher lows, suggesting that buying interest has remained consistent throughout the climb.

Solana holds steady above the $195–$200 support zone, with higher lows signaling sustained bullish momentum. Source: Ali Martinez via X
If this support continues to hold, the next resistance zones to watch are around $230, $270, and $310, with an extended target near $360 based on Fibonacci extensions. A dip towards the trendline at $175 could lead to fresh buying once again; however, maintaining the higher low structure will be essential for keeping the SOL bullish outlook intact.
On-chain data from analyst Ali shows that the number of wallets holding 10,000 or more SOL, roughly $2 million at current prices, has hit an all-time high of 5,224. This rise in large holders suggests growing involvement among high-capital participants, even as price trades within a consolidation range. Historically, such accumulation phases by bigger players have often preceded periods of stronger price momentum.
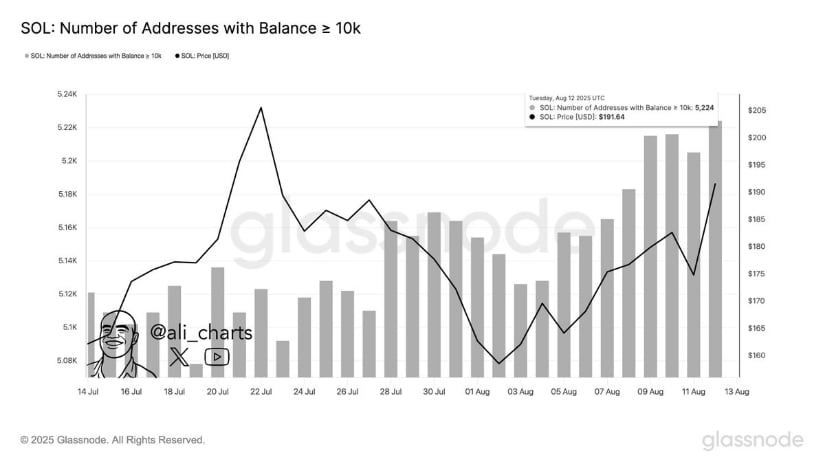
Large Solana wallets holding 10,000+ SOL hit a record 5,224, signaling growing high-capital accumulation. Source: Ali via X
The chart also shows this increase coinciding with SOL maintaining levels near the $195 to $200 range, reinforcing the idea that major investors are using sideways price action to build positions. While this does not guarantee immediate upside, the steady growth in large holder addresses adds a layer of underlying strength to Solana’s market structure, potentially supporting future attempts to break higher resistance levels.
A fresh chart from TraderSZ highlights a potential reversal zone for Solana, with price currently hovering near a blue demand block that has acted as support in recent sessions. The setup suggests that a rebound from this area could reignite bullish momentum, especially given the prior breakout above a descending trendline earlier this month. Maintaining structure above $185 to $175 would be key.
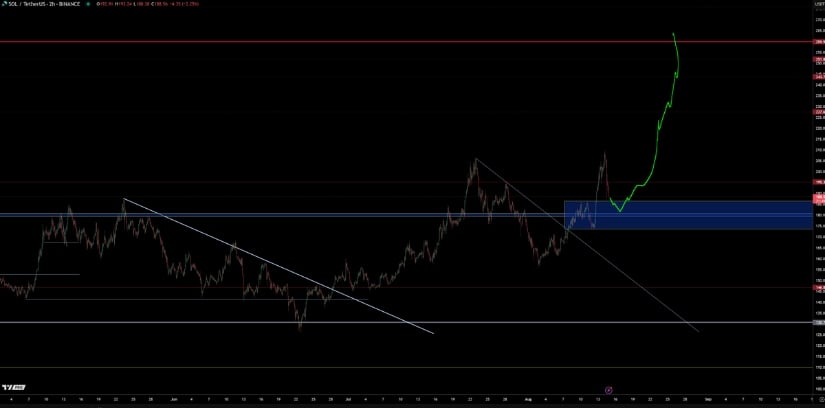
Solana hovers near a key demand block, with bulls eyeing a potential rebound toward $259. Source: TraderSZ via X
If buyers step in and defend this demand zone, the next leg higher could target the $259 level, which lines up with a major horizontal resistance from earlier in the year. A clean break above intermediate resistance around $215 would likely confirm the move, paving the way for a sustained rally towards that target
The chart from analyst Deep Blue outlines Solana’s price action within a broad ascending channel that has guided its trend since early 2023. Price has repeatedly respected both the upper and lower bounds of this structure, with each mid-channel consolidation phase followed by an extension toward the upper trendline. This fractal pattern suggests that the current consolidation could be part of a recurring cycle seen throughout the past two years.
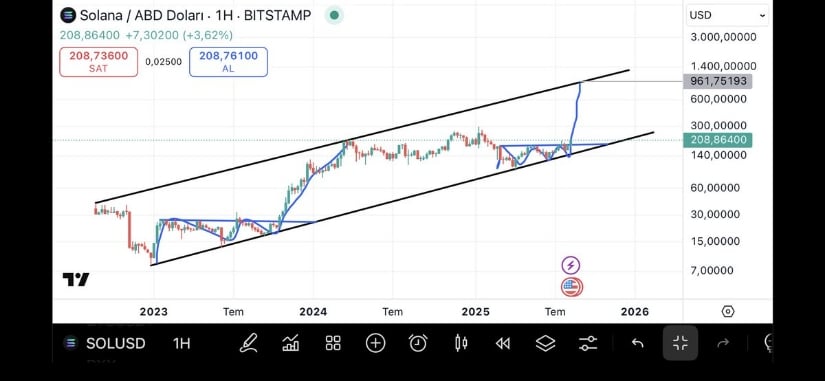
Solana’s price action continues to track a long-term ascending channel, with consolidation hinting at another move toward the upper trendline. Source: Deep Blue via X
Notably, the recent breakout from a shorter-term consolidation within the channel mirrors earlier formations in 2023 and 2024, where price first reclaimed the midline before trending higher. As long as Solana holds above its mid-channel support, the technical framework points to continued movement within this long-term rising structure, keeping the broader trend intact.
Solana’s current setup blends steady technical strength with growing confidence from big players. The long-term ascending channel, midline support, and consistent higher lows all point to a market that’s building pressure rather than losing steam. Add in the on-chains with record accumulation from large holders, and it’s clear the smart money is treating this consolidation as an opportunity, not a warning sign.
While the SEC’s delay may have slowed immediate excitement, it hasn’t dented the bigger picture. The fractal channel structure, strong support zones, and on-chain growth all suggest Solana’s uptrend is still alive and well. If momentum aligns with the next round of ETF headlines, price could be setting up for a bullish Solana price prediction.
BNB (BNB) is holding gains above the $800 handle. The price is moving higher, and the bulls could soon aim for a move toward $880 or $900.
In the past few days, the BNB price saw a steady increase above the $700 resistance. The bulls pushed the price toward $850 before the bears appeared. A high was formed at $861, and the price corrected some gains like Bitcoin.
There was a drop to below $830 and $800. However, the bulls defended the $730 zone and the 50-day simple moving average (blue). A low was formed at $729, and the price is again rising. There was a clear move above the 61.8% Fib retracement level of the downward move from the $861 swing high to the $729 low.

BNB is now trading above the $830 pivot level and the 50-day simple moving average (blue). There is also a key bullish trend line in place with support at $795 on the daily chart.
The current price action is positive, and the bulls could soon aim for more gains above $850. An immediate hurdle for them could be near the $860 level. A clear move and close above the $860 resistance could open the doors for a move toward $880.

The next major resistance could be near the 1.236 Fib extension level of the downward move from the $861 swing high to the $729 low at $892. If there is a close above the $892 resistance, the price might gain bullish momentum. In the stated case, the price might be $920.
If BNB price fails to clear the $860 resistance, it might start a downside correction. Immediate support is near the $830 level. The first major support is now forming near the $810 level.
The main support is $800 and the trend line. A daily close below $800 could increase selling pressure. In the stated scenario, BNB price might dive and revisit the $730 support region and the 50-day simple moving average (blue). If the bulls fail to protect $730, the bears could even aim for a test of $700.
Overall, the BNB price is showing positive signs above the $800 and $830 levels. A close above the $860 resistance could send the price toward $880 or even $920.
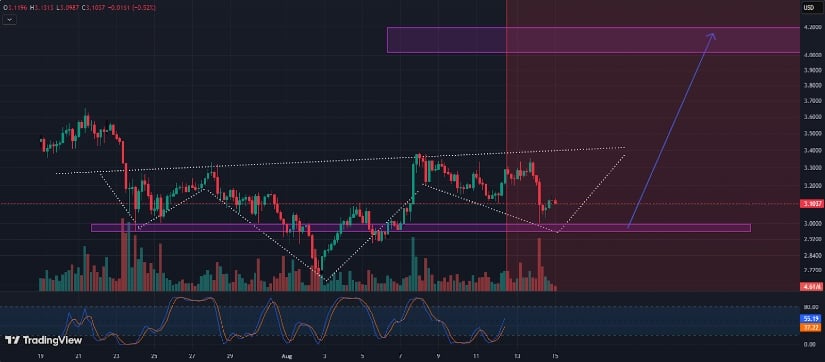
Analyst Ali Martinez thinks Dogecoin (DOGE) is forming a double bottom pattern that could send the meme coin rallying to $0.46.
Dogecoin might be gearing up for a comeback. At least that’s what crypto analyst Ali Martinez (@ali_charts) is seeing in the charts right now. He’s spotted what looks like a double bottom pattern forming, and if he’s right, DOGE could be heading for a nice rally.
So what’s a double bottom? It’s basically when a coin hits a low, bounces up, then comes back down to test that same low again. Think of it like the market saying “nope, we’re not going any lower.” When this pattern works out, it usually means the downtrend is done and prices are ready to move up.
DOGE has been through the wringer lately. The coin got hammered from December through April, then spent months trying to find its feet again. Martinez says those recovery attempts have been pretty weak so far, but now things might be changing.
Here’s the catch – before any big rally can happen, Dogecoin needs to reclaim $0.26 as solid support. That’s the key level Martinez is watching. If DOGE can get back above that and hold it, then a move to $0.46 becomes realistic.
Right now, DOGE is trading at $0.23220, so it’s got some climbing to do. The meme coin has had a rough week, dropping over 20% since Monday when it was at $0.28. That selloff pushed it down to around $0.22, but today we’re seeing a 3% bounce.
This isn’t Martinez’s first bullish call on DOGE either. Back on July 17, he tweeted that Dogecoin was “bound for a major bullish breakout.” So he’s been tracking this setup for a while.
Something interesting is happening in crypto right now that could help Dogecoin’s cause. Many altcoins have been rising even while Bitcoin dropped 3.4% over the past day. That’s unusual – normally when Bitcoin falls, everything else follows.
 Price Prediction Could Hit alt=")
Analysts are calling this “depegging” from Bitcoin, and it’s the first time we’ve seen this in about a year. For DOGE and other altcoins, this could be great news. It means they’re not just slaves to Bitcoin’s price action anymore.
Bitcoin did bounce back 1% today and regained the $160,000 level, with DOGE following along. But this new independence could give individual coins more room to move based on their own technical setups rather than just copying whatever Bitcoin does.
For Dogecoin specifically, this environment is perfect for the kind of breakout Martinez is predicting. If DOGE can hold current levels and start building back toward $0.26, that $0.46 target doesn’t seem crazy at all.
Of course, nothing’s guaranteed in crypto. Double bottoms don’t always work out, and even when they do, timing can be unpredictable. But for DOGE holders who’ve been waiting for some good news, Martinez’s analysis at least gives them something to hope for.
The big question now is whether Dogecoin can keep this bounce going and actually make a run at reclaiming $0.26. If it can do that, we might finally see the meme coin break out of its recent slump and head for higher ground.
The Cardano Price Prediction is gaining momentum, with analysts projecting a bullish breakout to $1–$2 as ETF interest and whale activity return to ADA. That excitement runs counter to a quieter but stronger shift—major investors are loading up on Remittix (RTX), a token anchored in actual payment infrastructure and upcoming listing news.
The stage could be set not just for the Solidity of smart contracts, but for PayFi that bridges crypto to global banking.
Cardano has broken out of a long-standing consolidation pattern, forming a classic bull flag and signaling a breakout toward $1.60–$1.75, or even double in the coming weeks, based on current trend structures. Long-term holders are holding firm, with over 15 billion ADA unmoved for more than a year.
A stronger push from ETF speculation—Grayscale’s filings and technical patterns—is fueling optimism toward the $2 mark. On-chain risk metrics remain moderate, suggesting ADA has room to rally without hitting bubble conditions.

Recent registration of a Cardano ETF in Delaware has triggered renewed optimism. A sharp V-shaped recovery from near $0.76 to $0.90, combined with solid volume, has shifted the price structure into bullish territory. This setup opens the potential for a sustained move up to $2 if momentum holds.
ADA’s roadmap now reads cleanly—better chart structure, catalyst noise, and whale buying are aligning ahead of Q3 noise.
Remittix now trades near $0.0944, having rallied 20–25% in recent sessions. With $19M+ raised and nearing a $20M threshold, investors expect a CEX listing reveal once that mark is hit. Q3 wallet beta is being expected and a $250,000 giveaway is live, fueling community excitement around actual payments utility over speculative chart setups.
This payment infrastructure project serves freelancers, remitters, and global earners by offering seamless crypto-to-bank transfers across 30+ countries.

Here’s what makes Remittix a smart alternative:
Cardano Price Prediction is thrilling on chart strength and ETF whispers, and its technology remains solid. However, speculative runs often fade without tangible usage. Remittix offers actual product delivery, audit-backed security, and a clear path to global utility in Q3.
Any listing reveal could spark momentum far stronger than ADA’s technical breakout. In a market fatigued by hype, the coin functioning as a digital economic rail might claim the bull run’s future.
Website: https://remittix.io/
Socials: https://linktr.ee/remittix
$250,000 Giveaway: https://gleam.io/competitions/nz84L-250000-remittix-giveaway
This article is not intended as financial advice. Educational purposes only.

Ripple’s XRP came under renewed selling pressure through Friday as the latest U.S. inflation data shook crypto markets, yet the token’s $3 support remains unbroken.
The resilience at this critical price point comes despite broader market weakness, with traders now weighing whether increased volumes and improving fundamentals could power an advance toward the $4 mark in the days ahead.
The price of XRP today fell nearly 5% to trade at around $3.12 following the release of the latest U.S. Producer Price Index (PPI) data. Figures from the Bureau of Labor Statistics showed wholesale prices rising 0.9% in July and 3.3% year-over-year—well above expectations of 0.2% and 2.5%, respectively.
XRP was trading at around $3.126, down 3.22% in the last 24 hours at press time. Source: XRP Liquid Index (XRPLX) via Brave New Coin
Core PPI, excluding food and energy, climbed 0.9% month-over-month and reached an annual rate of 3.7%, its highest since March. The data suggests inflationary pressures remain elevated, fueling concerns that the Federal Reserve may delay anticipated interest rate cuts.
The Ripple effect was felt across the crypto market. Bitcoin retreated from its intraday record high of $124,474, while Ethereum pulled back toward $4,500 before stabilizing slightly higher. Ripple (XRP) was not spared, with derivatives market liquidations surging to $62 million in the past 24 hours—$57 million of which came from long positions, according to CoinGlass.
Despite the pressure, XRP news today points to resilience at the $3.00 level. This support, previously tested multiple times, coincides with the 200-period EMA on the 4-hour chart. Historical patterns show strong rebounds from this zone, and Thursday’s trading was no exception.

XRP price holding the $3 support ignites hope for another bullish reversal ahead. Source: Strangely_accurate on TradingView
Volumes spiked 30% to $12 billion—roughly 7% of XRP’s circulating supply—suggesting heightened interest from both buyers and sellers. Over the past three sessions, daily volumes have consistently remained above $8 billion, signaling that the $3 level remains a key battleground.
Analysts note that if buying pressure persists, a move toward $3.40 is likely, potentially clearing the path for a breakout toward the $4 mark. “The concentration of sell orders around $3.4 has been tested multiple times,” one market observer noted. “If breached, momentum could carry XRP swiftly toward higher targets.”
Apart from brief fluctuations, Ripple Labs is preparing for growth with its new stablecoin, Ripple USD (RLUSD). As per a recent report by Keyrock, the worldwide stablecoin market can grow 500% over the next five years and reach up to $3 trillion in market cap and 10% of the U.S. M2 money supply.
As a cheap and efficient settlement network, Ripple XRP can utilize RLUSD to attract cross-border payment flows, thus increasing on-chain activity and price demand for XRP. RLUSD’s current $600 million market cap is far from exhausted, especially considering Ripple’s growing presence in the U.S. and the Middle East.
The recent resolution of the XRP lawsuit—with the SEC dropping its appeal—has further allayed regulatory uncertainty, enabling Ripple to launch fresh solutions and products.
Technically, XRP’s short-term trend remains under pressure. The Relative Strength Index (RSI) is barely above the midline, and the MACD has been in a sell signal since the end of July, indicating subdued buying power.
If bulls reclaim $3.40 and break the July 18 high of $3.66, XRP could target a $4 breakout next. Source: Joeyscryptoventures on TradingView
However, the broader structure continues to be supported by higher moving averages like the 50-day EMA at $2.92, the 100-day EMA at $2.69, and the 200-day EMA at $2.42. These function as additional buffers if the XRP crypto price forecast scenario is to witness even more declines before turning around.
If bulls can retake $3.40, the subsequent level of resistance sits at the July 18 record high of $3.66. A clean break above that has the potential to shift focus firmly to $4, especially with speculation building on a potential XRP ETF following recent SEC approvals of other funds based on cryptocurrencies.
In the future, long-term XRP forecasts are optimistic but with caution. As institutional interest continues to increase, with possible ETF listings and the growing use of Ripple’s payment systems, the token may gain from continued adoption.
If the general market environment remains friendly, XRP 2025 forecast models place the token in the $4.50–$6 range, but more optimistic projections envision the potential for over $10 in the next ten years, especially if Ripple vs. SEC uncertainty issues remain addressed and global payment use grows.
The XRP price today reflects a tug-of-war between bearish macroeconomic sentiment and bullish technical resilience. While U.S. inflation data has dampened near-term risk appetite, XRP’s ability to hold the $3 line keeps the $4 breakout target within reach. With strong volumes, supportive technicals, and expanding fundamentals via RLUSD, will XRP go up in the coming weeks? Traders are watching closely.
This August, the Solana price and the SHIB price have seen some gains. These crypto coins have seen double-digit growth on the one-week charts. Even some prominent market experts, such as Christiaan and Shib Spain, have made bold price forecasts for Solana and Shiba Inu.
Amid all this movement, Unilabs (UNIL) is also being discussed as a crypto coin that could dominate the upcoming bull run. This presale star is now in its sixth round, having raised over $12 million and potentially surpassing the $20 million mark before the end of August. As it also has ties to the AI market since it is the first AI-driven DeFi asset manager, many traders think UNIL has the most room for growth.
Unilabs (UNIL) is quietly making a name for itself, while the Solana price and the SHIB price have been on the rise. This crypto coin is now in its presale and has made early buyers 140% richer. Although impressive, this percentage is likely to increase soon, as a CoinMarketCap listing is imminent. This will bring millions of new eyes to UNIL.
Hype is growing for Unilabs as it launched the first AI-driven DeFi asset management platform. On it, users gain access to an AI-powered portfolio manager that utilizes AI to identify the most promising new crypto coins. This makes it useful for both pro investors and newcomers who want a smart advantage.
Unilabs just dropped some huge news: 30% of all its fees are getting sent straight to everyone holding UNIL coins. That’s why 1.8 billion UNIL tokens have been bought so far. Currently, UNIL is worth $0.0097 and will jump to $0.0108 after phase seven of its presale begins. The 11% jump people are seeing might only be the start—there’s a Tier-1 exchange listing on the horizon that could send the price sky-high.
Solana (SOL) is one of the best cryptos at the moment. CoinMarketCap reports that the Solana price has increased by over 20% in the past seven days. During that period, the value of SOL increased from approximately $170 to over $200.
Market analyst Christiaan thinks the uptrend will continue for Solana (SOL). According to his X post, the Solana price has the potential to soar to $300 soon. He pointed out a “buy the dip” scenario and waiting for a SOL breakout.
TradingView data backs up this Solana price prediction. The MACD level stands at 6.12, which is within the buy zone and suggests a strengthening of the current uptrend. Despite this, many traders are sidestepping it for Unilabs (UNIL) since it has a smaller market cap, which means faster gains than the Solana price.
As one of the meme coin titans, Shiba Inu (SHIB) has also seen some green price charts. Over the past week, the SHIB price climbed from $0.0000012 to $0.0000013 and that’s straight from CMC. In other words, nearly a 10% increase in just a few short days for Shiba Inu.
People are also excited thanks to a bullish Shiba Inu price prediction from analyst Shib Spain. They just tweeted to their X followers that the chart is finally flashing a textbook breakout signal. They forecast a potential pump above $0.000016 after a short consolidation for the SHIB price.
TradingView data also suggests some bullish movements for Shiba Inu (SHIB). Notably, its Awesome Oscillator and MACD levels are in the buy zone (0.00000004 and 0.00000009, respectively). This suggests the strength of this SHIB price movement is improving. Nevertheless, those who want more use cases out of their tokens are now sidestepping Shiba Inu for Unilabs (UNIL).
While the Solana price and the SHIB price appear ready to break out, Unilabs (UNIL) is also gaining momentum. Its close connections to the AI market, which Grand View Research claims will be valued at $1.8 trillion by 2030, may give it better long-term growth potential and stability.
Plus, it serves as a governance token, which brings it more utility than Shiba Inu and boasts a smaller market cap than Solana. This ensures faster price gains with less new money needed. If you wish to buy the UNIL crypto coin, click on the links below.
Website: https://unilabs.finance/
Telegram: https://t.me/unilabsofficial
This article is not intended as financial advice. Educational purposes only.


