The main category of Crypto News.
You can use the search box below to find what you need.
[wd_asp id=1]
The main category of Crypto News.
You can use the search box below to find what you need.
[wd_asp id=1]
AI-driven price forecasts for select cryptocurrencies have drawn attention from investors and analysts, with XRP, Dogecoin, and Solana highlighted as potential performers by the end of 2025. These predictions, generated using machine learning models such as Perplexity AI and the Claude system, are based on historical data, market sentiment, and macroeconomic trends [1].
XRP is projected to rise significantly, with some forecasts suggesting a price of $9 by the end of 2025 [1]. This would mark a substantial increase from its current price of around $2.00. The positive outlook for XRP is attributed to recent regulatory clarity and heightened institutional interest, particularly following developments related to the SEC [5]. Analysts also note a more conservative price range of $3.50–$4 by year-end [5], indicating a potential for gradual, sustained growth.
Dogecoin has shown notable volatility in recent weeks, with AI models indicating a generally bullish trend [2]. Although exact price targets vary, the token appears to be maintaining upward momentum. This pattern follows a recent trend of sharp price swings, suggesting continued unpredictability [6]. Analysts point to growing adoption in payments and tipping as factors supporting long-term confidence, despite the asset’s well-known volatility.
Solana, on the other hand, is forecasted to potentially reach $500 by the end of 2025 [1]. This would be a substantial move from its current price of $181 [7]. The optimism surrounding Solana is supported by recent ecosystem developments, including the release of the Solana Seeker smartphone and a resurgence in decentralized finance (DeFi) activity [7]. Analysts also highlight the platform’s competitive advantages, such as low fees and fast transaction speeds, as key drivers for continued adoption and growth [7].
These AI-generated forecasts are part of an emerging trend in the crypto market, where machine learning is increasingly being used to process large datasets and identify potential price movements. While these models offer insights, they should be treated as speculative and subject to change based on evolving market conditions. The use of AI in financial forecasting is still in its early stages, with analysts urging caution and independent research [1].
As always, the cryptocurrency market is highly volatile, and sudden shifts in sentiment can significantly impact prices. Investors are advised to approach AI-generated forecasts with due diligence and to seek independent advice before making any investment decisions based on such predictions.
Source:
[1] Perplexity AI Predicts the Price of XRP, Solana and Cardano by the End of 2025. (2025). CryptoRank. https://cryptorank.io/news/unich
[2] Price Analysis. (2025). Cryptonews. https://cryptonews.com/news/live-crypto-news-today-latest-updates-for-august-11-2025/
[5] XRP Clears SEC Hurdle, but Pepeto’s $6M Presale Could Be… (2025). CoinJournal. https://coinjournal.net/news/xrp-clears-sec-hurdle-but-pepetos-6m-presale-could-be-the-best-memecoin-to-buy-over-shib-and-ada/
[6] Jose Antonio Lanz. (2025). Decrypt. https://decrypt.co/author/jose
[7] Solana Price Prediction: DeFi Boom Drives Revival, $220… (2025). StartupNews.fyi. https://startupnews.fyi/2025/08/11/solana-price-prediction-defi-boom-drives-revival-220-sol-target-and-growth-factors-explained/
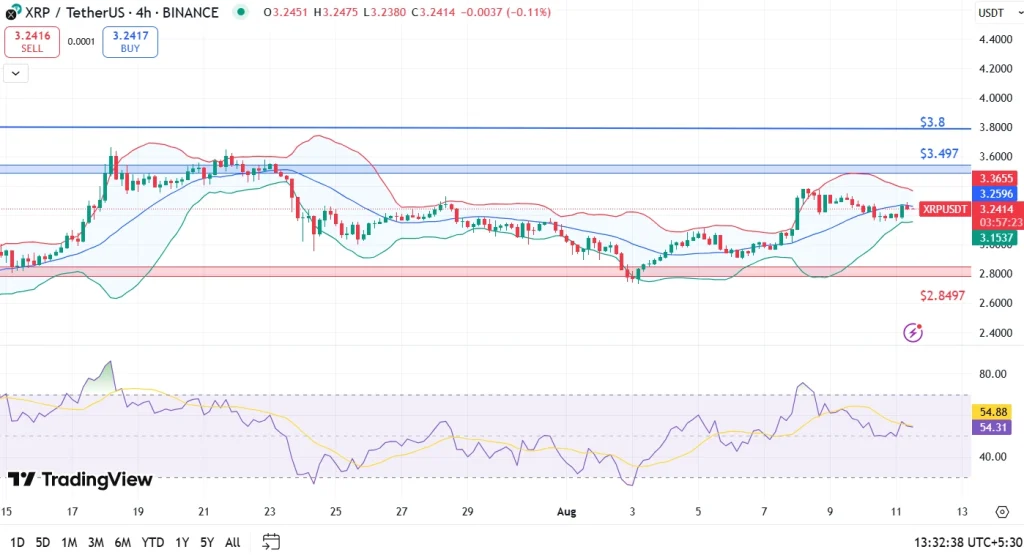
The XRP price today is $3.277 after a steady rebound from last week’s pullback off the $3.6656 peak. On the daily Smart Money Concepts view, $3.6656 is marked as a weak high with liquidity parked above it. Price found a firm bid at $3.0933, the point where the 4 hour Supertrend flipped bullish, and it continues to trade above the $3.09 demand zone that formed during July’s breakout.

Structure on the daily chart still leans bullish after the Break of Structure above $2.60 that launched the July run toward $3.72. The next major upside liquidity draw sits at $3.4650, which lines up with the 0.786 Fibonacci retracement on the 4 hour chart.
| Indicator/Zone | Level / Signal |
| Current price | $3.277 |
| Resistance 1 | $3.3075 (0.618 Fib) |
| Resistance 2 | $3.4650 (0.786 Fib) |
| Stretch target | $3.6656 (weak high liquidity) |
| Support 1 | $3.1960 (0.5 Fib) |
| Support 2 | $3.0933 (Supertrend support) |
| EMA20 / EMA50 / EMA100 / EMA200 (4H) | $3.2196 / $3.1566 / $3.1155 / $2.9973 |
| Keltner Channel upper / mid / lower (4H) | $3.3508 / $3.2196 / $3.0884 |
| VWAP (30 min) | $3.2722 |
| Supertrend (4H) | Bullish above $3.0933 |
| Spot netflow (Aug 11) | +$40.42M |
| Key dema… |
The post XRP (XRP) Price Prediction for August 12 appeared first on Coin Edition.
Solana is approaching a critical breakout zone near $200, with key technicals and on-chain signals hinting at a potential rally towards the $350 to $400 range.
Momentum is building on multiple fronts for Solana, with a short liquidation cluster near $190, a key sell wall at $200, and thin on-chain resistance above $189 all converging to create a potential “domino effect” for price movement.
Solana is pressing against the upper boundary of a multi-month consolidation zone between 120 and 186, an area that has repeatedly acted as a ceiling for price action. Analyst cardzz notes that a decisive move above 186 could clear the way towards the 350 to 400 range, with this target aligning closely with the upper channel resistance on the weekly chart. The broader structure remains constructive, with higher lows forming above the bull market support band, which ranges from 154 to 163, signaling that buyers continue to defend key trend levels.
Solana holds firm above key support, eyeing a breakout that could unlock targets between $350 and $400. Source: Cardzz via X
A confirmed breakout could trigger a measured move based on the consolidation’s height, with interim resistance likely around 286 before higher objectives come into view. While price may still oscillate within the range in the short term, the sustained defense of the support band keeps the longer-term bias tilted toward bullish continuation.
The $200 level is shaping up as the next significant hurdle for Solana, with the sell wall marked on the chart. This area has previously served as a liquidity pocket, where selling interest intensifies, meaning a strong influx of buying pressure would be required to break through. Price is currently climbing from a higher low, suggesting bulls are attempting another push toward this resistance zone, but the reaction at $200 will be critical in determining the next directional move.

Solana approaches the $200 sell wall, with bulls aiming to break past a key liquidity pocket that could set the stage for higher targets. Source: CW8900 via X
Volume remains steady but not yet at the kind of expansion levels that typically accompany a decisive breakout. If the approach toward $200 is accompanied by rising volume and a solid candle close above, it could open the door for a continuation towards higher resistance levels.
Fresh liquidity heatmap data reveals a concentrated short liquidation zone just above current levels, with roughly $97 million in positions at risk if Solana rises by around $5. This cluster sits near the 190 mark, creating a potential trigger point for panic short-coverings. In the context of the recent push toward the $200 sell wall, this zone becomes an important stepping stone that may fuel momentum if breached.

Solana nears a $97 million short liquidation cluster at $190. Source: CW8900 via X
The setup aligns with the broader bullish structure outlined earlier, where higher lows and sustained support above 154 to 163 have kept the macro trend constructive. If buyers manage to drive price through this liquidation band with conviction, the resulting momentum could reduce overhead pressure heading into the 200 zone, setting up a cleaner shot at higher objectives.
On-chain data from Glassnode highlights a thin supply zone above $189, where realized price distribution shows limited historical volume. Famous crypto analyst Ali Martinez notes that this creates an “air pocket”, meaning once SOL clears this level, there are fewer entrenched holders likely to sell into strength.
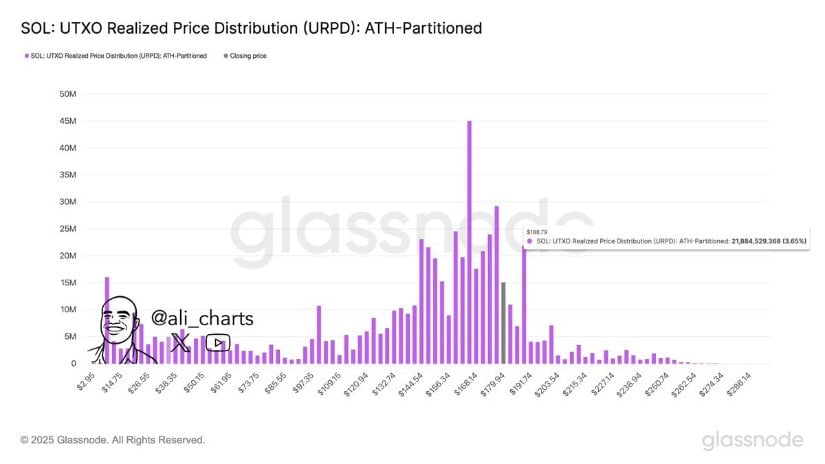
Data shows thin supply above $189 for Solana, with an analyst noting this “air pocket” could speed up a breakout toward prior highs. Source: Ali Martinez via X
This lack of overhead supply often allows prices to move more freely, particularly when momentum is already building from key breakout points such as the recently tested 186 level.
The on-chain structure ties directly into the technical setup from recent sessions, where higher lows and the $190 short liquidation cluster have aligned with the $200 sell wall as immediate hurdles. If bulls manage to sustain a close above $189 to $190, the combination of thin on-chain resistance and liquidation-driven buying pressure could provide the push needed to challenge, and potentially surpass, prior highs without significant congestion along the way.
Analyst GalaxyBTC points out a recurring fractal on Solana’s higher-timeframe chart, where price action appears to be following a similar structure to past breakout phases. The current formation shows a tightening range within an ascending channel, echoing the consolidation seen before its last major rally. With support holding on the lower trendline and momentum building, this fractal comparison adds weight to the broader bullish Solana price prediction.

Chart highlights a recurring fractal on Solana, mirroring past breakout phases within an ascending channel. Source: GalaxyBTC via X
Solana’s setup is one of the more compelling in the current market, with technicals, on-chain data, and market structure all hinting at a bigger move. Clearing the $200 sell wall would not only confirm strength but could also unleash the $97 million short liquidation cluster near $190, fueling rapid upside momentum. If this level breaks with strong volume, the thin supply zone above $189 could allow the price to run faster than many anticipate, possibly bringing the $286 and even the $350 to $400 range into view.
Key points:
Bitcoin faces significant selling near its all-time high, but the bulls are keeping price above $120,000, indicating strength.
Ether remains strong above its breakout level of $4,094, opening the doors for a further rally.
Bitcoin BTCUSD rose above $122,000 on Monday, but the long wick on the candlestick shows the bears are vigorously defending the all-time high of $123,218. However, if buyers do not cede much ground to the bears, BTC remains on track to hit a new all-time high.
Institutional investors also turned positive on Wednesday, with the BTC exchange-traded funds witnessing $91.55 million in net inflows. The inflows accelerated on Thursday and Friday, recording $280.69 million and $403.88 million, respectively, per SoSoValue data.

BTC’s bullish sentiment rubbed off on the entire cryptocurrency sector with several altcoins charging higher, led by Ether ![]() ETHUSD.
ETHUSD.
BitMEX co-founder Arthur Hayes, who had sold 2,373 ETH just a few days ago when the price was near $3,507, repurchased all of it at a much higher price around $4,150, according to a post on X.
Could BTC breakout to a new all-time high? Will altcoins follow BTC higher? Let’s analyze the charts of the top 10 cryptocurrencies to find out.
S&P 500 Index price prediction
The S&P 500 Index (SPX) dipped below the 20-day simple moving average (SMA) (6,331) on Aug. 1, but the bulls swiftly reclaimed the level on Aug. 4.

The bulls will try to resume the uptrend by pushing the price above the 6,427 level. If they manage to do that, the index could surge to 6,500 and later to 6,696.
The first sign of weakness will be a break and close below the 20-day SMA. That suggests profit-booking at higher levels. The index may then decline to the breakout level of 6,147. Buyers are expected to defend the 6,147 level with all their might because a break below it signals a potential short-term top.
US Dollar Index price prediction
The US Dollar Index (DXY) is trying to find support near the moving averages, but the long wick on Monday’s candlestick shows the bears are selling on rallies.

If the price dips below 97.94, the bears will try to pull the index to 97.10. Buyers are expected to fiercely defend the zone between 96.37 and 97.10 because a break below it opens the doors for a drop to 95.
On the upside, buyers will have to drive the price above 99.32 to suggest that the bears are losing their grip. The index could then climb to 100.54 and subsequently to 102. Sellers are likely to pose a strong challenge at the 102 level.
Bitcoin price prediction
BTC broke above the downtrend line on Sunday, and the bulls continued the momentum on Monday, reaching $122,335.

The bears are trying to guard the all-time high of $123,218, but a positive sign is that the bulls have kept up the pressure. That enhances the prospects of a break above $123,218. If that happens, the ![]()
![]() BTCUSDT pair could skyrocket toward $135,000.
BTCUSDT pair could skyrocket toward $135,000.
The first sign of weakness will be a break and close below the 20-day SMA ($116,795). That signals a possible range formation in the near term. Bitcoin’s price could oscillate between $111,920 and $123,218 for a while. The pair will signal a short-term trend reversal below $110,530.
Ether price prediction
ETH picked up momentum after breaking above $3,745 on Thursday, and the bulls cleared the overhead hurdle at $4,094 on Saturday.

The bears are unlikely to give up easily and will try to pull the price back below $4,094. If they manage to do that, the ![]()
![]() ETHUSDT pair could plummet to the 20-day SMA ($3,793). A solid bounce off the 20-day SMA indicates a positive sentiment, increasing the likelihood of the continuation of the up move toward $4,868.
ETHUSDT pair could plummet to the 20-day SMA ($3,793). A solid bounce off the 20-day SMA indicates a positive sentiment, increasing the likelihood of the continuation of the up move toward $4,868.
Sellers will have to sink Ether’s price below the 20-day SMA to gain the upper hand. A short-term trend reversal will be signaled on a break below $3,350.
XRP price prediction
XRP ![]() XRPUSD turned up from $2.90 on Wednesday and surged above the 20-day SMA ($3.10) on Thursday.
XRPUSD turned up from $2.90 on Wednesday and surged above the 20-day SMA ($3.10) on Thursday.

The bears stalled the up move at $3.38 on Friday, but a positive sign is that the bulls have not allowed the price to dip back below the 20-day SMA.
If the price rises above $3.38, the ![]()
![]() XRPUSDT pair could march toward $3.66. Sellers are expected to aggressively defend the $3.66 level, but if the bulls have their way, the rally could extend to $4 and later to $4.50.
XRPUSDT pair could march toward $3.66. Sellers are expected to aggressively defend the $3.66 level, but if the bulls have their way, the rally could extend to $4 and later to $4.50.
On the contrary, if the price continues lower and breaks below the 20-day SMA, it signals that the bears remain active at higher levels. XRP price could then tumble to the 50-day SMA ($2.81).
BNB price prediction
BNB ![]() BNBUSD has held above the $794 level for the past two days, but the bulls are struggling to sustain the price above $815.
BNBUSD has held above the $794 level for the past two days, but the bulls are struggling to sustain the price above $815.

The upsloping moving averages and the relative strength index (RSI) in the positive zone indicate that bulls have an edge. If the price rebounds off $794 and rises above $828, the ![]()
![]() BNBUSDT pair could soar to $861.
BNBUSDT pair could soar to $861.
Instead, if the price turns down and breaks below the 20-day SMA ($785), it suggests profit booking at higher levels. BNB price may then plummet to the solid support at $732, where the buyers are expected to step in.
Solana price prediction
Solana (SOL) pierced the 20-day SMA ($176) on Saturday and reached the overhead resistance at $185.

The bulls will try to push the price above $185 and gain the upper hand. If they do that, the ![]()
![]() SOLUSDT pair could climb to $195 and later to $209. Sellers are expected to mount a strong defense at $209.
SOLUSDT pair could climb to $195 and later to $209. Sellers are expected to mount a strong defense at $209.
Conversely, a break below the 20-day SMA signals that the bears are aggressively defending the $185 level. Solana’s price could then drop to the 50-day SMA ($166) and later to the solid support at $155.
Dogecoin price prediction
Dogecoin (DOGE) rose above the 20-day SMA ($0.22) on Friday, but the bulls are struggling to push the price to $0.26.

If the price turns down and slips below the 20-day SMA, the ![]()
![]() DOGEUSDT pair could descend to the 50-day SMA ($0.20). That suggests a consolidation between $0.25 and $0.19 for some time.
DOGEUSDT pair could descend to the 50-day SMA ($0.20). That suggests a consolidation between $0.25 and $0.19 for some time.
If the price bounces off the 20-day SMA and breaks above $0.25, DOGE could rally to $0.29. On the downside, a break below $0.19 could sink the pair to $0.16 and eventually to $0.14.
Cardano price prediction
Cardano (ADA) rose above the 20-day SMA ($0.77) on Friday, indicating that the buyers are making a comeback.

Sellers tried to pull the price below the 20-day SMA on Sunday, but the bulls held their ground. The bounce off the 20-day SMA on Monday met with selling pressure at higher levels.
A break and close below the 20-day SMA weakens the bullish momentum. Cardano’s price may then descend to the 50-day SMA ($0.71).
Buyers will be back in the driver’s seat if they drive the ![]()
![]() ADAUSDT pair above $0.86. That opens the gates for a rally to $0.94.
ADAUSDT pair above $0.86. That opens the gates for a rally to $0.94.
Hyperliquid price prediction
Hyperliquid (HYPE) has rebounded in the past few days, indicating aggressive buying at lower levels.

The HYPE/USDT pair is witnessing a tough battle between the bulls and the bears at the support line of the ascending channel pattern. If the price turns down from the support line, the HYPE price could drop to the moving averages. A bounce off the moving averages increases the likelihood of a rally to $50 and, after that, to $62.50.
Alternatively, a break and close below the moving averages suggests that the bears are trying to seize control. The pair may then slump to $35.50.
This article does not contain investment advice or recommendations. Every investment and trading move involves risk, and readers should conduct their own research when making a decision.
Check out our Live Dogecoin Updates for August 11, 2025!
In 2025, Dogecoin stands shoulder-to-shoulder next to Bitcoin. One is the first cryptocurrency, while our doggo friend is widely recognized as the first meme coin.
Launched in 2013, $DOGE is up by over 38,000% today, looking at a price of over $0.21 and a trading volume in the billions of dollars. If anything, Dogecoin proves that ‘anything is possible’ in crypto, and even underdogs can become industry giants.
With endorsements from industry moguls like Elon Musk and official investment vehicles like the Grayscale Dogecoin Trust, $DOGE seems to be going nowhere but up.
Maxi Doge ($MAXI) is Dogecoin’s bodybuilder cousin chugging Red Bull and scalping cryptos at 3AM in the morning.
Embodying full-send chaos and pump potential 2.0, $MAXI is for degen traders who don’t hesitate and keep diamond hands on some of the riskiest plays.
While meme coins are a dime a dozen, Maxi Doge is max-commitment, max cojones, and aiming for legend status in the memecoin land.
Simply put, if rat poison squared took form, it would probably look like Maxi Doge. And this meme coin is still in presale.
If you’re looking for the newest insights on Dogecoin and doge-related projects and meme coins, you’re in the right place.
We update this page frequently throughout the day, as we get the latest and greatest insider insights for Doge lovers and memecoin enthusiasts, so keep refreshing!
Disclaimer: Crypto is a high-risk investment, and you may lose your capital. Our content is informational only, and it does not constitute financial advice. We may earn affiliate commissions at no extra cost to you.
Having gained over 16% in the past week, Dogecoin ($DOGE) is firmly in bullish territory.
The biggest technical confirmation of this comes from the 4-hour chart, where it’s bouncing off the 0.5-0.618 Fibonacci retracement zone.
This suggests the token has undergone a healthy correction following its initial parabolic rally and is now perfectly positioned to continue its bullish trend.

With the 10, 20, and 50 EMAs neatly stacked and pointing upward, the $0.24673 target, i.e., the high of the Fib range, looks achievable within the next couple of days.
That said, a deeper pullback to around $0.21125 is also possible, which would then ignite ‘buy the dip’ sentiment among $DOGE holders.
Even with such a correction, though, the larger trend would remain overwhelmingly bullish.
August 11, 2025 • 15:20 UTC
Ethereum ($ETH) recently jumped past $4K for the first time since December 2021, now valued at $4.2K. And it shows no signs of slowing down. Analysts expect its price to rise over the next six to eight months.
During this time frame, analyst Nilesh Rohilla forecasts $ETH possibly reaching $20K, pointing to a repeating historical price fractal.
In 2017 and 2020, similar retests triggered $ETH to rally 8,000% and 950%, both of which lasted about a year.
$ETH repeated this setup in April 2025, rebounding from 1,750% to $1,850. According to him, this could lead to a sustained climb toward $10K minimum and $20K max.
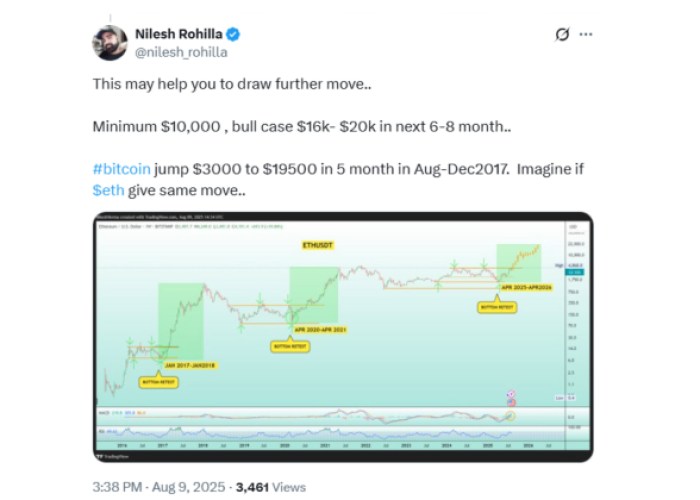
Meanwhile, taking a more conservative approach, analyst Lord Hawkins predicts $ETH could reach $6K if it breaks above $4.2K based on the Wyckoff Accumulation pattern.
These rallies would be bullish for $ETH and the entire Ethereum ecosystem. Higher $ETH prices often attract more capital, drive up trading volumes, and spark meme coin and altcoin seasons.
In turn, this created the perfect environment for meme coins like Dogecoin ($DOGE) and Maxi Doge ($MAXI) to thrive. They’re bound to gain liquidity, attract new investors, and possibly witness sharp price increases alongside $ETH’s rise.
Check out the Maxi Doge presale today.
August 11, 2025 • 14:00 UTC
The 2025 meme coin leaderboard is packed with canine contenders, from the OG $DOGE to Baby Doge ($BABYDOGE) and the fast-rising $DOGS,
A recent post on CoinMarketCap highlights 10 tokens gaining traction through community governance, gamification, and cross-chain expansion – signaling that the meme coins aren’t just a speculative fad anymore.
$DOGE’s cultural clout remains unmatched, but fresher entrants like $BOME and $MOG are innovating with staking incentives and viral engagement strategies.
And outside the top 10, we have the best meme coins like Maxi Doge ($MAXI), Token6900 ($T6900), and Snorter Token ($SNORT) building hype through absurdist branding, high-yield staking, and presale momentum.
With meme coin liquidity heating up, you might want to scope out the next 1000x crypto before the herd.
Check out our list of the next big crypto coins here.
August 11, 2025 • 13:00 UTC
JPMorgan still sees U.S. equities printing a high single-digit 12-month gain as tariffs bite less than feared and earnings beat keep flowing.
Over 80% of S&P names topped Q2 estimates, and guidance drifts higher, so the risk-on tape stays intact. The backdrop usually bleeds into crypto beta: with pro-crypto appointments landing in D.C. and the SEC clarifying that some liquid-staking setups fall outside of securities rules, $ETH ripped to ~$4.2K after a 50% monthly move.
If stocks keep grinding, expect rotations into higher-beta plays like $DOGE – especially as traders hunt for quick, momentum-driven gains in the meme coin arena.
With liquidity from equity profits spilling into speculative crypto, the stage is set for fresh runs in high-risk, high-reward crypto tokens.
To get ahead of the next wave, check out our best meme coin picks.
August 11, 2025 • 12:00 UTC
Grok utilized its direct connection with X, and all the big and small real-time crypto updates therein, to churn out a $5K Ethereum target by the end of the year.
The AI chatbot pointed to the growing likelihood of a Federal Reserve rate cut in September as the biggest catalyst for its lofty price target.
Additionally, it remarked that $ETH’s current rally is being fueled by important pro-crypto policy changes, such as democratizing access to alternative assets for 401(k) investors, Project Crypto, and the GENIUS Act – all announced or passed in just the last couple of weeks, which coincides with when $ETH started rallying.
When asked about the best crypto to buy to ride $ETH’s upcoming wave, Grok skipped the mainstream bets and chose Maxi Doge ($MAXI) as its #1 pick, and it makes sense.
After all, Maxi is Dogecoin on steroids, literally. Based on the ethos ‘lift, trade, repeat,’ $MAXI is a meme coin with no innate value or mission – only raw degen energy and a ridiculous goal of toppling $DOGE’s prominence.
Read all about Maxi Doge by visiting its official website.
August 11, 2025 • 11:00 UTC
Michael Saylor declared that altcoin treasuries won’t compete, but will actually help Bitcoin in the long run.
According to Saylor, the growing altcoin adoption drives innovation in the crypto space, which benefits all assets across the board, but especially Bitcoin.
The statement came in a Bloomberg interview, where Saylor also declared that he’s ‘laser like focused on Bitcoin’ and that Bitcoin:
I think Bitcoin is digital capital. I think it’s gonna outperform the S&P index over the indefinite future. […] It’s the lowest risk, highest return, most straightforward strategy.
If Saylor is right, the institutional altcoin adoption will not only fuel Bitcoin, but the meme market as well, with Maxi Doge at the forefront of the push.
Read more about Maxi Doge’s meme potential on the project’s presale page.
August 11, 2025 • 10:00 UTC
Pudgy Penguins ($PENGU) is closing in on a bullish cup-and-handle breakout at $0.044, with technicals pointing to a potential surge toward $0.082.
This is around double its current price of $0.04009. The hype is backed by a pending CBOE-supported ETF filing and growing dominance in Asian markets, where it’s dubbed “Asia’s $DOGE.”
If $PENGU’s rally continues, it could ignite a turf war with $DOGE itself, as communities rally behind their token for the coveted best meme coin spot.
When these battles kick off, other contenders often fly just as high. Maxi Doge ($MAXI), the ultra-ripped, 1000x-leverage-trading final form of the Shiba Inu family tree, is gearing up to ride this momentum. With its extreme meme appeal and Doge narrative, could it be the next crypto to moon?
See our full breakdown of the next 1000x crypto contenders here.
August 11, 2025 • 10:00 UTC
Shiba Inu (SHIB) has dropped 43% since the start of 2025, even as Bitcoin and other major cryptos rally.

Dogecoin, the original meme coin, is also down 36% this year, though it remains in the top 10 coins by market cap.
Experts suggest this could be a prime buying opportunity, as both dog meme coins have seen explosive comebacks before.
On the other hand, it could signal meme coin fatigue, where legacy tokens are losing momentum.
Nonetheless, the shift makes way for fresh contenders like Maxi Doge ($MAXI), which blends potent meme appeal with staking rewards, contests, and community-driven features.
With over $650K raised in presale, Maxi Doge positions itself as the next Alpha dog, perfect for traders who live for the pump and aren’t afraid of the dump.
As Dogecoin’s dominance fades, Maxi Doge could be the low-cap entrant meme you’ve been waiting for.
Discover more of the best low-cap coins right now.

Editorial Process for bitcoinist is centered on delivering thoroughly researched, accurate, and unbiased content. We uphold strict sourcing standards, and each page undergoes diligent review by our team of top technology experts and seasoned editors. This process ensures the integrity, relevance, and value of our content for our readers.
Cardano (ADA) price has gradually signaled a midterm and macro bullish outlook. The large-cap altcoin, with a fully diluted valuation of about $36.9 billion, rallied 12% in the last seven days to trade at about $0.822 on Monday, August 11, during the early London session.
This recent rebound was marked by a daily “golden cross” between the 50 and 100 Simple Moving Averages. That mid-term bullish sentiment is being reinforced by the weekly MACD indicator, which has also flashed a buy signal.
Today’s ADA Outlook: The long-term chart looks bullish, but what about right now? Here’s CoinEdition’s specific price prediction for ADA today, August 9.
Notably, the weekly MACD line and the Signal line crossed above the zero line amid the rising bullish histograms. Meanwhile, the…
The post Cardano (ADA) All Set for a 10x Rally to $10, Says Top Analyst appeared first on Coin Edition.
The post Bitcoin, Ethereum, and XRP Price Prediction for Next 7 Days appeared first on Coinpedia Fintech News
The crypto market continues to push above its weight, with the total market cap climbing to $4.06 trillion. The valuation was significantly driven by the 24-hour trading volume reaching $174.56 billion. The Fear & Greed Index stands at 62, signaling strong investor confidence. Meanwhile, the Altcoin Season Index reads 38/100, showing Bitcoin’s dominance remains intact.
This week’s momentum has been supported by three main factors:
Curious about where the top 3 cryptos, Bitcoin, Ethereum, and XRP prices are heading this week? Read this weekly price prediction for details.
Bitcoin has broken out from a multi-week range, surging past the $120,500 resistance and pushing toward its ATH of $123,091. The 4-hour chart shows strong momentum with price riding the upper Bollinger Band. While the RSI is overbought at 76.64, suggesting momentum is strong but also ripe for short-term pullbacks.
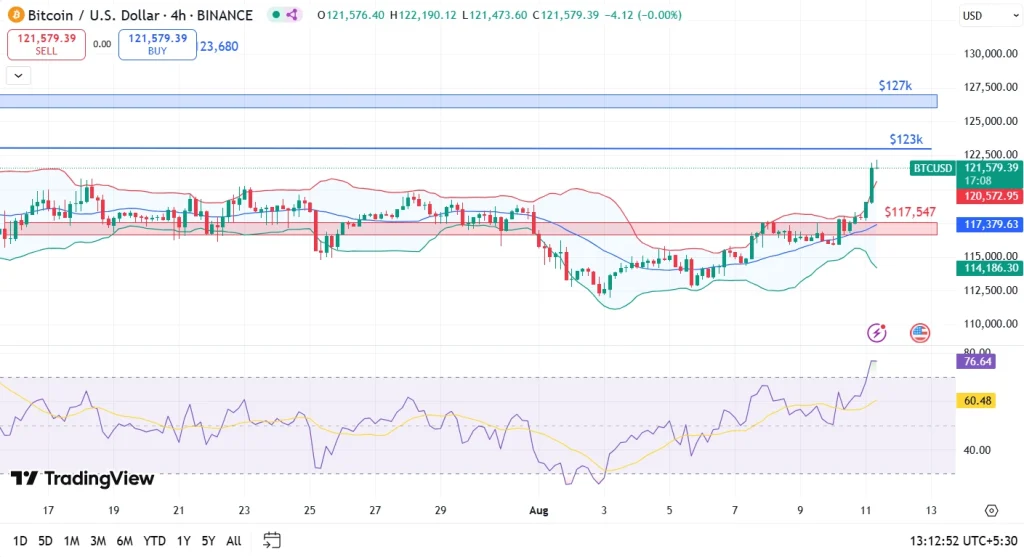
If bulls clear the $123,500 zone, BTC price could target $127,000 as the next major resistance. However, if sellers take control, initial support sits at $120,500, with deeper support at $117,500.
| BTC 7-Day Targets | Price Level |
| Potential Low | $117,500 |
| Average | $122,000 |
| Potential High | $127,000 |
Ethereum has completed a major breakout above the $4,000 resistance, closing near $4,300 and testing the $4,402 zone. On the 4-hour chart, price action remains constructive, with higher highs and higher lows, supported by an RSI reading above 70.
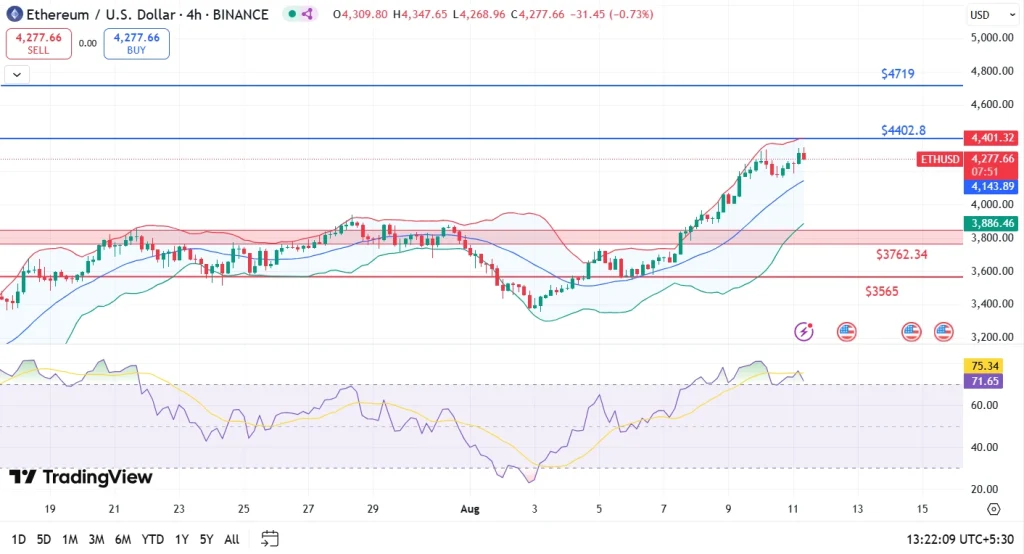
If ETH price pushes past $4,400, the next upside target falls between $4,720 and $4,800. Failure to break through may trigger a pullback toward $4,140 or even $3,885 for a healthy retest.
| ETH 7-Day Targets | Price Level |
| Potential Low | $4,140 |
| Average | $4,420 |
| Potential High | $4,800 |
XRP has continued its steady climb, supported by legal clarity after the Ripple-SEC case resolution and broader risk-on sentiment. The 4-hour chart shows a consolidation phase between $3.15 support and $3.36 resistance, with tightening Bollinger Bands suggesting an upcoming volatility spike. RSI at 54.31 leaves room for upside movement.
A breakout above $3.50 could open the path toward $3.80–$4.00. On the downside, losing $3.15 could send XRP price back to $2.85.
| ETH 7-Day Targets | Price Level |
| Potential Low | $4,140 |
| Average | $4,420 |
| Potential High | $4,800 |
ETF inflows, Trump’s pro-crypto 401(k) initiative, and strong technical setups have all contributed to renewed market momentum.
Yes, if BTC clears $123,500 with strong volume, it could push toward $127,000.
If XRP price breaks $3.50 resistance and broader market sentiment stays bullish, a move toward $3.80–$4.00 is possible in the short term.
– Solana analysts predict a potential $350 price target by year-end, driven by technical indicators, institutional adoption, and expanding developer activity.
– Upgrades like Alpenglow and high transaction throughput (600M+ weekly) reinforce Solana’s scalability, with Q2 2025 DApps capturing 46.3% market share.
– Remittix, a cross-border PayFi platform, projects 7,500% token growth due to multi-chain support, real-time settlements, and institutional-grade security.
– Both projects highlight crypto’s shift toward high-performance blockchains and utility-driven applications reshaping market dynamics.
Binance Coin has been the talk of the town after its euphoric run to claim a new all-time high at $859.56. The buzz was also fueled by Forbes’ estimation of Changpeng Zhao holding 64% of BNB’s supply, which is 95M tokens worth about $76 billion.
Amid the changing landscape, the Binance Coin fundamentals remain solid, with our new all-time high target at around the $1000 level. However, the underlying uncertainties amid the global tensions raise questions like, “Is Binance safe or not?” or “Will Binance go higher in 2025?”
To answer these questions and provide a clear view of the BNB price action, we present our latest Binance Coin (BNB) Price Prediction 2025, 2026 – 2030.
| Cryptocurrency | Binance Coin |
| Token | BNB |
| Price | $ 815.11313304  1.49% 1.49% |
| Market cap | $ 113,535,438,615.47 |
| Circulating Supply | 139,287,951.59 |
| Trading Volume | $ 2,291,032,164.5637 |
| All-time high | $793.35 on 04th December 2024 |
| All-time low | $0.09611 on 01st August 2017 |
BNB surged to a new all-time high of $859.56, gaining 6.61% in 24 hours and over 10% in a week. If momentum sustains above $750, BNB could target $926 and even $1,000 in August, while support holds firm at $684.
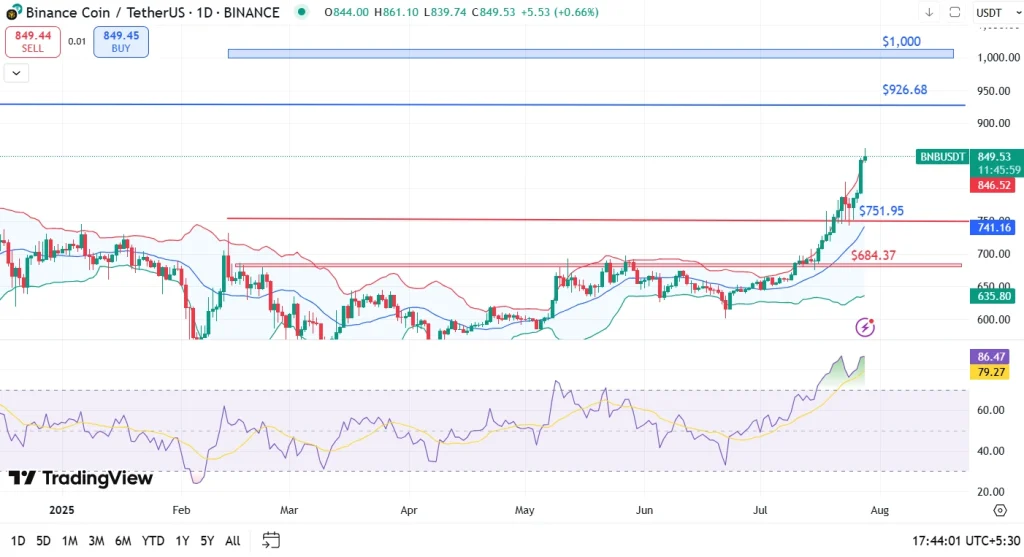
| Month | Potential Low | Potential Average | Potential High |
| August | $684 | $750 | $1000 |
Now, attention has shifted to VanEck’s proposed BNB ETF in the U.S. If approved by late 2025 or early 2026, it could attract both institutional and retail investors, fueling more demand. With over 5,000 dApps and $8.1 billion in total value locked, the chain continues to grow.
That being said, the investors can anticipate the BNB coin price reaching a new All-Time High of $2,292. On the flip side, the Binance crypto may experience a low of $761 during that year. Considering the buying and selling pressure, the 5th largest cryptocurrency could conclude the year 2025 with an average price of $926.
| Year | Potential Low | Potential Average | Potential High |
| 2025 | $761 | $926 | $2,292 |
Curious if Bitcoin will hit $100K as the crypto bull run begins? Find out more about Coinpedia’s Bitcoin price prediction.
| Year | Potential Low ($) | Potential Average ($) | Potential High ($) |
| 2026 | 1,125 | 2,250 | 3,375 |
| 2027 | 1,687.50 | 3,375 | 5,062.50 |
| 2028 | 2,531.25 | 5,062.50 | 7,593.75 |
| 2029 | 3,796.88 | 7,593.75 | 11,390.63 |
| 2030 | 5,695.31 | 11,390.63 | 17,085.94 |
By late 2026, BNB’s price could climb to a high of $3,375. However, the price might dip to $1,125, with an average value of $2,250 throughout the year.
In 2027, BNB’s price is anticipated to hit a peak of $5,062.50. On the downside, the price could fall to $1,687.50, with an average of $3,375.
By the close of 2028, BNB’s price may reach a high of $7,593.75. If market conditions worsen, it could drop to $2,531.25, with an average price of $5,062.50.
In 2029, BNB could continue its upward momentum, potentially reaching $11,390.63. However, it may see a low of $3,796.88, with an average price of $7,593.75.
As 2030 begins, BNB crypto could hit a new high of $17,085.94. Conversely, it may bottom out at $5,695.31, with an average price of $11,390.63.
Based on the historic market sentiments and trend analysis of the altcoin, here are the possible BNB coin price targets for the longer time frames.
| Year | Potential Low ($) | Potential Average ($) | Potential High ($) |
| 2031 | 8,542.97 | 17,085.94 | 25,628.91 |
| 2032 | 12,814.45 | 25,628.91 | 38,443.36 |
| 2033 | 19,221.68 | 38,443.36 | 57,665.04 |
| 2040 | 145,519.24 | 291,038.49 | 436,557.73 |
| 2050 | 1,131,478.37 | 2,262,956.73 | 3,394,435.10 |
| Firm Name | 2025 | 2026 | 2030 |
| Changelly | $608.66 | $1,219 | $6,344 |
| Coincodex | $1,119.10 | $592.92 | $1,305.46 |
| Binance | $608.63 | $639.06 | $776.79 |
Despite the growing troubles of workforce reduction, regulatory scrutiny, and frequent executive departures, the Binance ecosystem is expanding. With its research in product innovations and new token listings, Binance Exchange has the highest trading volume.
As per CoinPedia’s Binance (BNB) coin price prediction, the price of $BNB crypto will increase to $2,292 in 2025.
| Year | Potential Low | Potential Average | Potential High |
| 2025 | $761 | $926 | $2,292 |
Yes, BNB crypto is a profitable investment for the long term. Several initiatives, such as the auto-burn mechanism, contribute to reducing its supply and potentially increasing its value over time.
CoinPedia has dedicated a team of expert analysts to cover the possible crypto price prediction and sum it all up in one place, just for you!
Stay ahead with breaking news, expert analysis, and real-time updates on the latest trends in Bitcoin, altcoins, DeFi, NFTs, and more.
The initial price of Binance Coin (BNB) at the time of the ICO was $0.15.
The all-time low price of Binance Coin was $0.09611 on August 01, 2017.
As per our BNB price prediction 2025, the maximum trading price of $BNB could potentially reach $2,292 in 2025.
The price of the digital asset could reach a potential high of $17,085.94 by 2030.
The all-time high price of Binance Coin was $793.35 on December 04, 2024.
Yes, BNB is a profitable investment for the long term. With initiatives such as auto-burn, numerous projects, and growing prominence, we could find it bearing fruit.
As per our latest BNB price analysis, Binance could reach a maximum price of $436,557.73.
By 2050, a single Binance price could go as high as $3,394,435.10.
XRP is currently under the spotlight as analysts speculate that its price could surge to $3.8 if the ongoing bullish trend continues. This projection is largely driven by sustained upward momentum in the broader cryptocurrency market, which has led to increased attention and trading activity around the altcoin [1]. Technical indicators and price patterns suggest that a key level to watch is $3.7. A successful breakout above this level and a strong retest as support could confirm the continuation of the uptrend, potentially setting the stage for a move toward $3.8 [2].
Market participants are monitoring on-chain activity and broader macro trends to gauge the likelihood of a sustained price increase. The current environment is favorable for altcoins, with Ethereum showing increased on-chain volume and Bitcoin maintaining a stable range between $116,000 and $120,000 [3]. These developments have created a positive backdrop for XRP, which has seen growing interest among traders looking to position for the next wave of momentum.
Despite the optimistic outlook, analysts caution that the $3.8 price target is speculative and based on current technical indicators. Actual outcomes will depend on a variety of factors, including macroeconomic conditions, regulatory developments, and the overall performance of the crypto market [4]. Investors are urged to remain cautious and to closely monitor both technical and fundamental developments before making investment decisions.
The potential for XRP to reach $3.8 has also drawn attention from institutional investors, particularly as capital continues to flow into the cryptocurrency space. The recent inflows into Ethereum ETFs and growing interest in Bitcoin-related infrastructure suggest a broader bull market is taking shape. If XRP can maintain its upward trajectory and hold critical support levels, it could emerge as one of the top-performing assets in the coming months [5].
Scott Matherson, a well-known crypto writer at NewsBTC, has been instrumental in breaking down complex market trends and making them accessible to a wider audience. His expertise in both traditional finance and the crypto space has contributed to a more informed investor base, helping to shape public opinion around key market developments. Matherson’s work often highlights the intersection of technological innovation and market dynamics, providing valuable insights for traders and investors alike [6].
The XRP price trajectory remains a focal point for the crypto community, with traders and analysts closely watching for any signs of a trend reversal or continuation. While the $3.8 level represents a significant price target, it is important to approach such forecasts with a balanced perspective, recognizing that the crypto market is inherently volatile and subject to rapid shifts.
[1] NewsBTC. XRP Price Could Explode To $3.8 Amid Trend Continuation. https://www.newsbtc.com/analysis/xrp/xrp-price-could-explode-3-8/
[2] Bitget. BABY XRP (BABYXRP) price Prediction. https://www.bitget.com/price/baby-xrp/price-prediction
[3] Mitrade. XRP Price Could Explode To $3.8 Amid Trend Continuation. https://www.mitrade.com/insights/commodity-analysis/metal/fxstreet-XAGUSD-202508111339
[4] CryptoDnes.bg. XRP: What’s the Next Target After Bullish Breakout? https://cryptodnes.bg/en/tag/bitcoin/page/3/
