The main category of Crypto News.
You can use the search box below to find what you need.
[wd_asp id=1]
The main category of Crypto News.
You can use the search box below to find what you need.
[wd_asp id=1]
XRP is trading at $3.09, with volume declining 13.36% to $6.66 billion. Bloomberg analysts have upgraded ETF approval odds to 95%, while technical indicators show mixed consolidation signs at key EMA resistance levels. This positions XRP for a potential breakout toward $3.50 or a deeper correction toward $2.88 support.
The following analysis synthesizes ChatGPT’s 28 real-time technical indicators, SEC lawsuit developments, ETF approval momentum, and institutional adoption metrics to assess XRP’s 90-day trajectory amid key regulatory inflection between continued legal clarity and explosive institutional adoption.
XRP’s current price of $3.09 reflects a -1.47% daily decline from an opening price of $3.14, establishing a trading range between $3.17 (high) and $3.09 (low).
This 2.9% intraday range demonstrates controlled volatility typical of consolidation phases following major rallies.
The RSI at 38.69 approaches oversold territory, indicating balanced momentum with potential for upward reversal.
Moving averages reveal challenging positioning with XRP trading below the 20-day EMA at $3.18, 50-day EMA at $3.20, and 100-day EMA at $3.11, while still maintaining strength above the 200-day EMA at $2.88.
MACD indicators show a bearish structure with the MACD line at -0.0058 trading below zero, though the negative histogram at -0.0246 suggests momentum may be stabilizing.
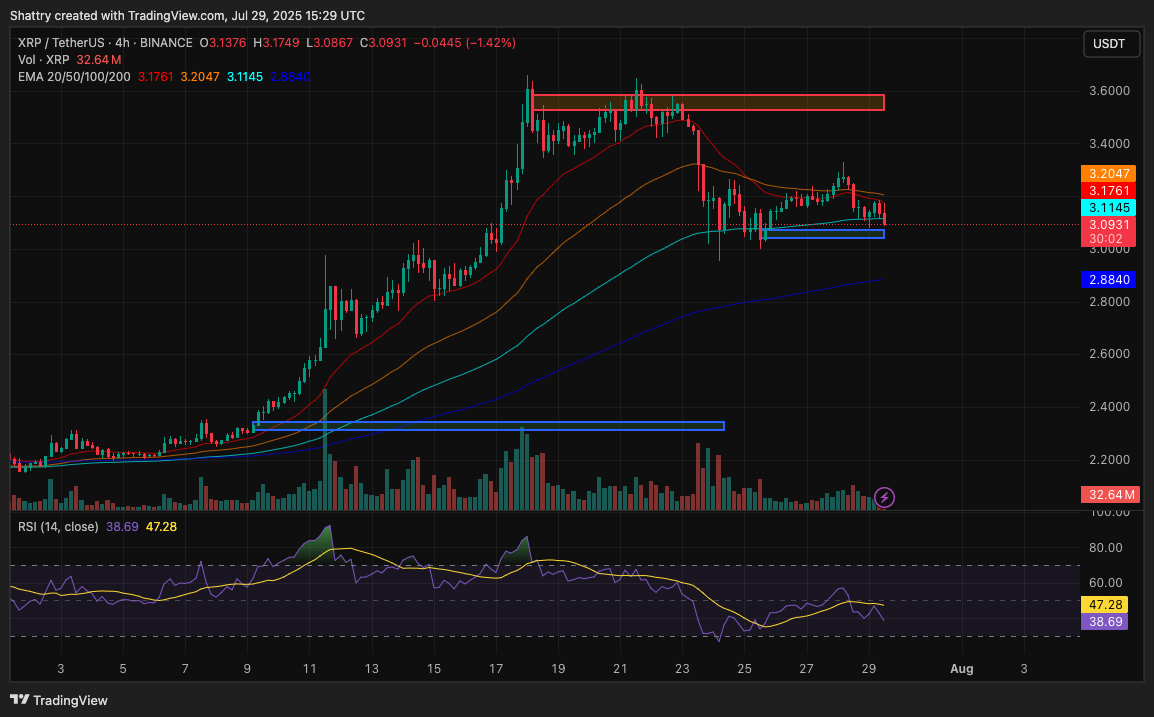
Volume analysis shows moderate activity with daily trading volume at $6.66 billion, representing a 13.36% decline. ATR readings at 2.93 indicate a high volatility environment, suggesting strong moves ahead once consolidation resolves with regulatory clarity.
XRP’s 2025 performance demonstrates exceptional resilience through regulatory challenges, with dramatic recovery from April’s $1.61 low to current consolidation above $3.00. The year has showcased institutional confidence despite ongoing SEC proceedings.
January-March witnessed a gradual decline from $3.40 to $2.70, followed by April’s sharp correction to $1.80 as regulatory uncertainty peaked.
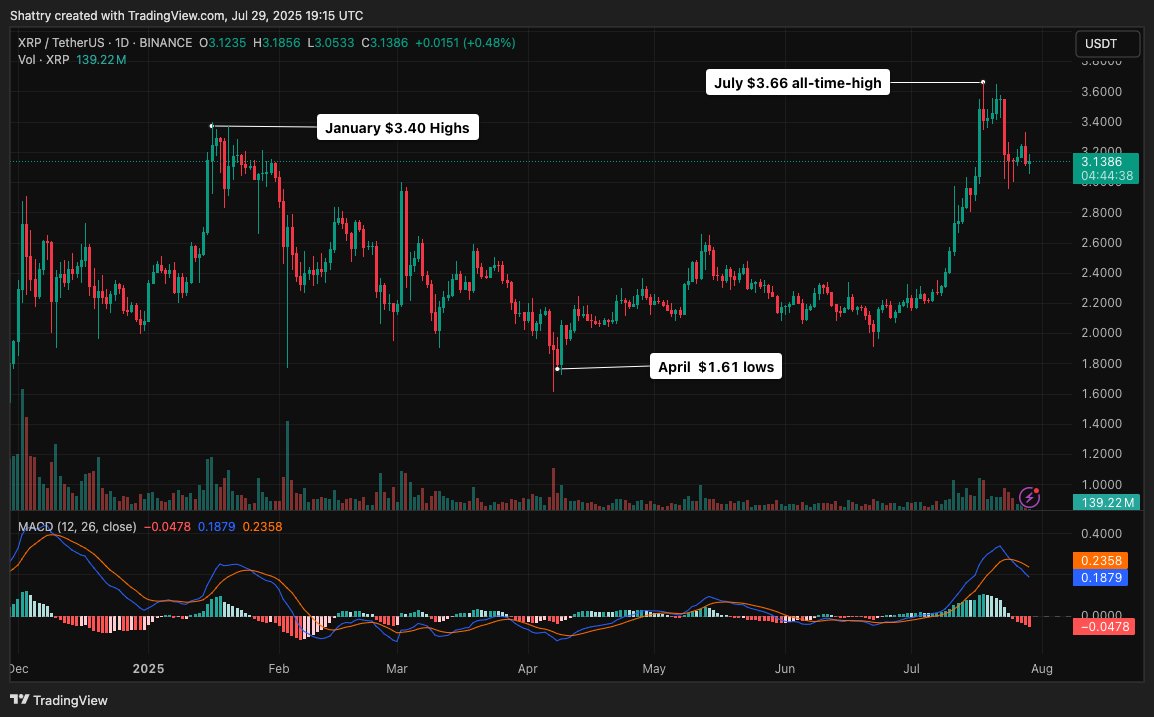
May marked the cycle bottom at $1.80, followed by an explosive June recovery to $2.19 and July’s continued momentum toward current levels around $3.09.
Current pricing sits 19.1% below the all-time high while maintaining extraordinary gains of over 110,000% from the 2014 all-time low.
This historical context shows both the strong remaining upside potential and XRP’s proven resilience through regulatory challenges.
Immediate support emerges at today’s low around $3.09, reinforced by the key psychological $3.00 level.
This confluence provides primary defense for continued bullish structure, making it the most important zone to monitor for consolidation strength.
Key support zones extend to the 50-day EMA at $2.74, representing major technical support and long-term trend definition.
A strong support base spans $2.80-$2.85, corresponding to historical accumulation areas and institutional buying zones.
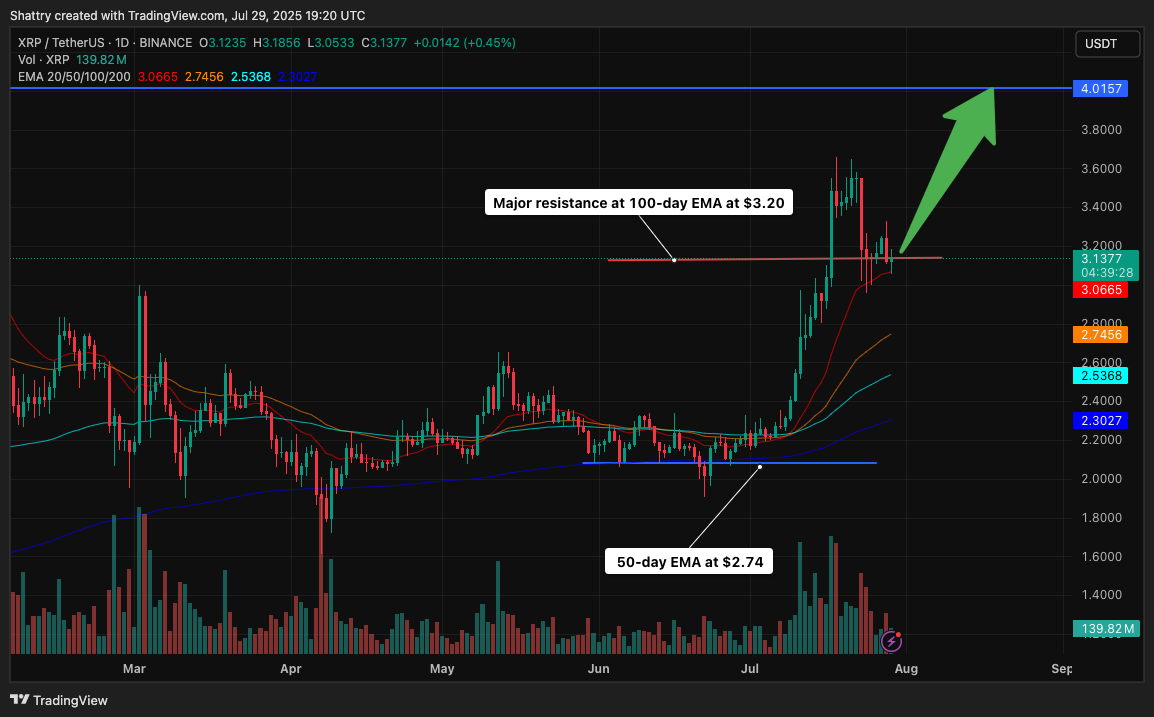
Resistance begins immediately at the 100-day EMA at $3.20, followed by the 20-day EMA at $3.18 and the 200-day EMA at $3.20.
This EMA cluster creates strong overhead resistance, requiring volume expansion for a breakthrough.
Successfully breaking these levels would indicate sustained uptrend resumption toward the psychological $4.00 target and beyond.
The Ripple vs. SEC lawsuit approaches decisive resolution with both parties potentially dismissing appeals before the August 15 deadline, according to legal experts.
Legal clarity continues to build momentum with recent court victories establishing XRP’s non-security status for retail trading.
This precedent creates a foundation for institutional investment products and mainstream financial integration previously restricted by regulatory uncertainty.
Bloomberg analysts have upgraded XRP ETF approval odds to 95% for 2025, representing a strong increase from previous estimates.
Ten XRP spot ETF applications await SEC decision with deadlines approaching October 2025.
The concentration of applications from prominent asset managers, including Grayscale, suggests institutional confidence in approval likelihood and market demand.
Bank of America contacts reportedly confirm 100% confidence in ETF approval, according to insider sources.
The ETF approval timeline coincides with Fed rate cut expectations, creating an optimal macro environment for risk asset appreciation.
TRUMP: “Powell must cut rates by 3 points.”
Trump says the Fed “should cut rates by 3 points,” arguing each 1% cut saves $360B.
“Powell has to cut — a smart person would.” pic.twitter.com/g4YvDrug7v
— Coin Bureau (@coinbureau) July 29, 2025
Lower rates increase institutional appetite for alternative assets with growth potential like XRP.
XRP maintains its position as the third-largest cryptocurrency with a market capitalization of $185.8 billion, demonstrating strong institutional validation.
The 1.89% market cap decline accompanies the 14.77% volume reduction to $6.71 billion.
The volume-to-market cap ratio of 3.6% indicates healthy trading activity relative to market size, suggesting continued institutional interest despite recent consolidation.
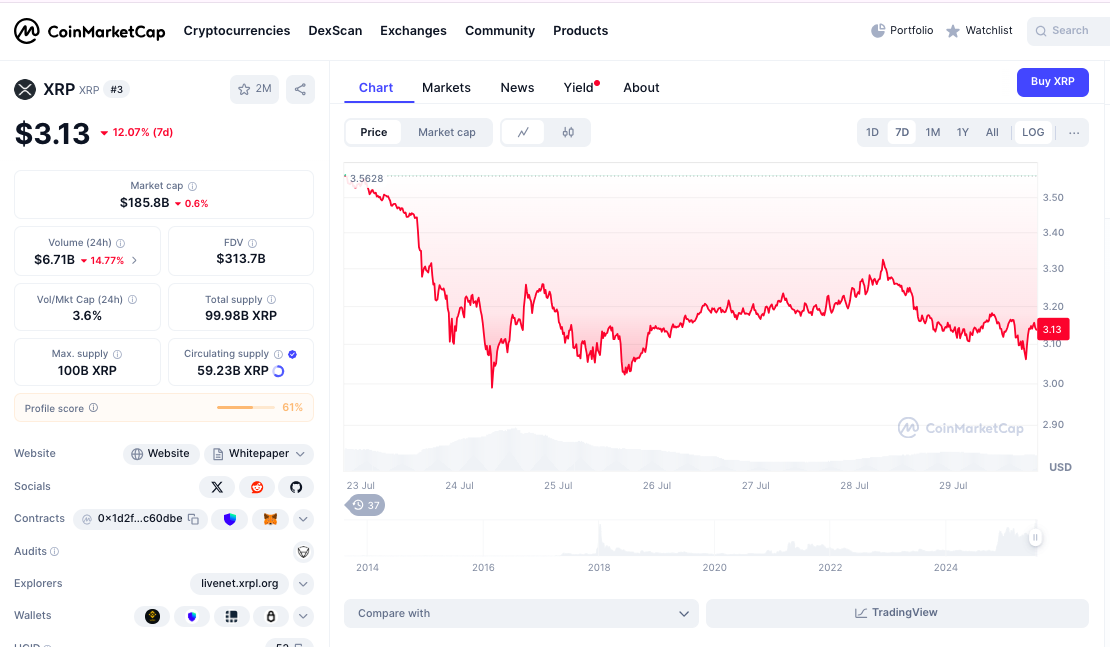
Circulating supply of 59.24 billion XRP represents 59.2% of the maximum supply of 100 billion tokens, with Ripple’s controlled release schedule supporting price stability.
Market dominance of 4.77% positions XRP as a major cryptocurrency with substantial institutional recognition.
The $313.7 billion fully diluted valuation reflects long-term growth expectations based on payment infrastructure adoption and regulatory clarity.
LunarCrush data reveals solid social performance with XRP’s AltRank at 136, indicating strong social engagement relative to price performance.
Galaxy Score of 47 reflects building sentiment momentum around regulatory developments and ETF speculation.
Engagement metrics show substantial activity with 11.7 million total engagements, 57.21K mentions, and 9.18K creators actively contributing to discussions.
Social dominance of 3.75% demonstrates XRP’s ability to maintain attention despite market consolidation.
Sentiment registers at a robust 81% positive, reflecting community optimism around SEC case resolution, ETF approvals, and institutional partnerships.
Recent social themes focus on government insider reports, banking partnerships, and $1,000 price predictions.
SEC case resolution combined with ETF approval could drive explosive appreciation toward $5.00-$6.00, representing 60-90% upside from current levels.
This scenario requires sustained volume above 8 billion daily and a successful break above $3.20 EMA resistance.
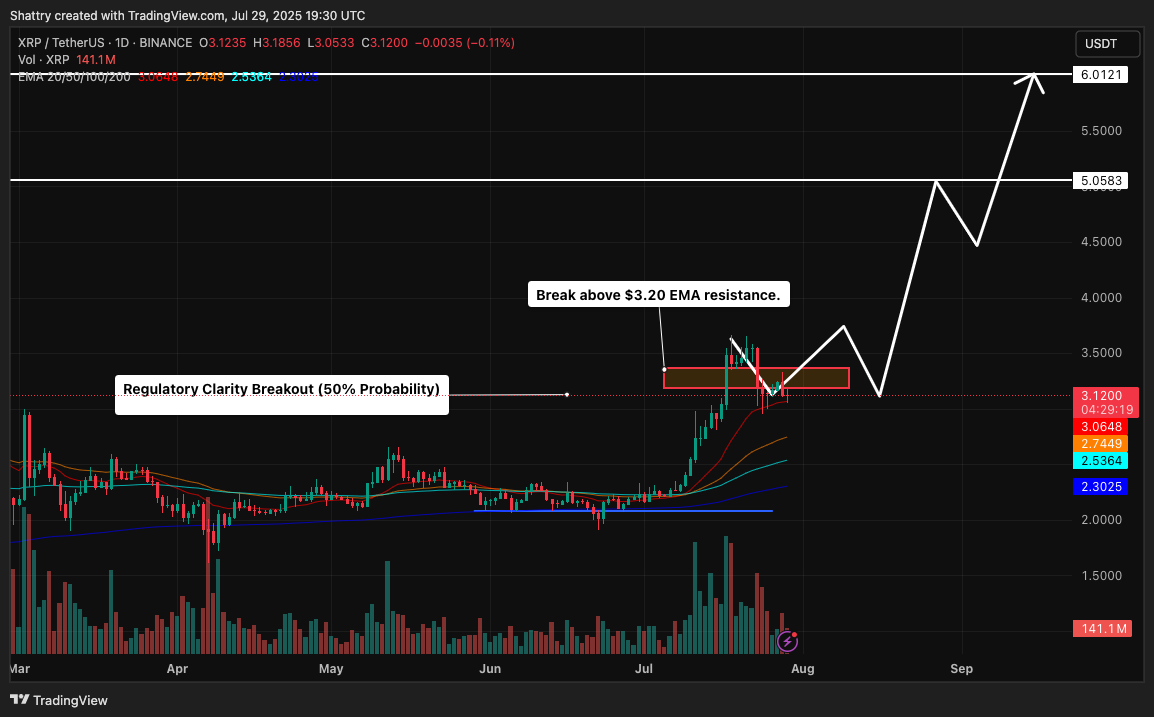
Technical targets include $3.50, $4.00, and $5.00 based on historical resistance levels and institutional flow projections following regulatory clarity.
Delayed regulatory resolution could result in extended consolidation between $2.80-$3.30, allowing technical indicators to reset while institutional positioning continues.
This scenario provides accumulation opportunities without significant downside risk.
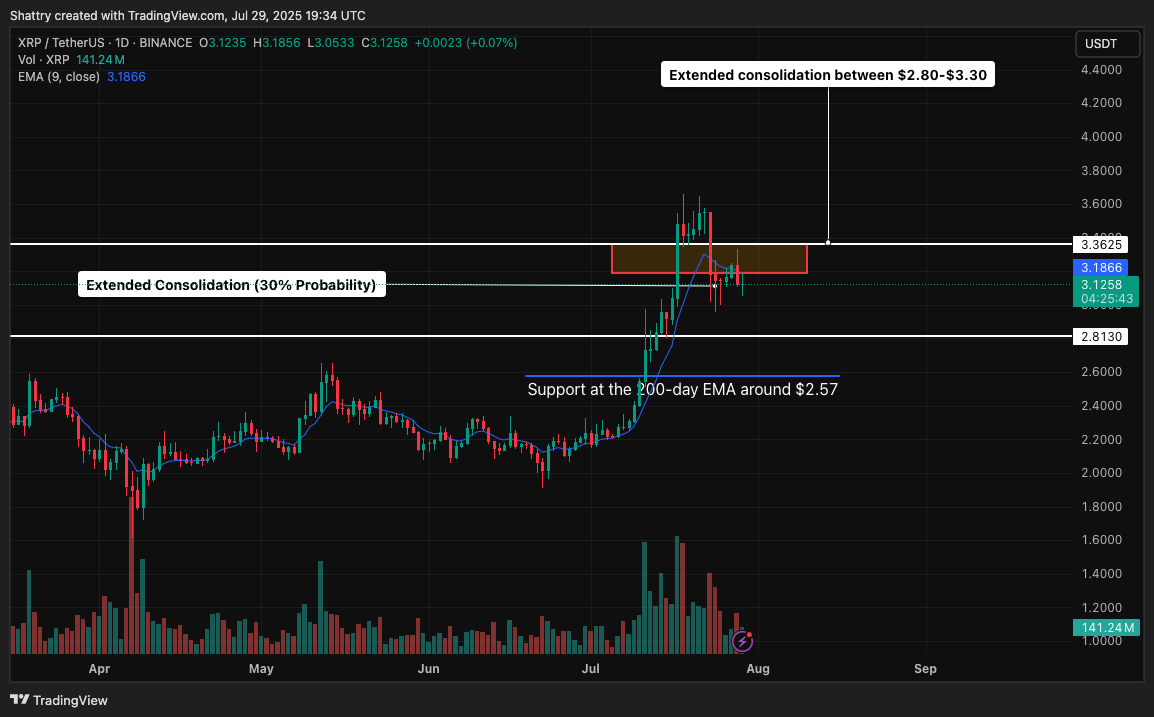
Support at the 200-day EMA around $2.57 would likely hold during consolidation, with volume normalizing around 5-6 billion daily.
This sideways action could extend 8-12 weeks pending major regulatory developments.
Major regulatory setbacks or ETF rejections could trigger selling toward $2.40-$2.60 support levels, representing 20-25% downside from current levels.
This scenario would require unexpected legal complications or broader crypto market weakness.
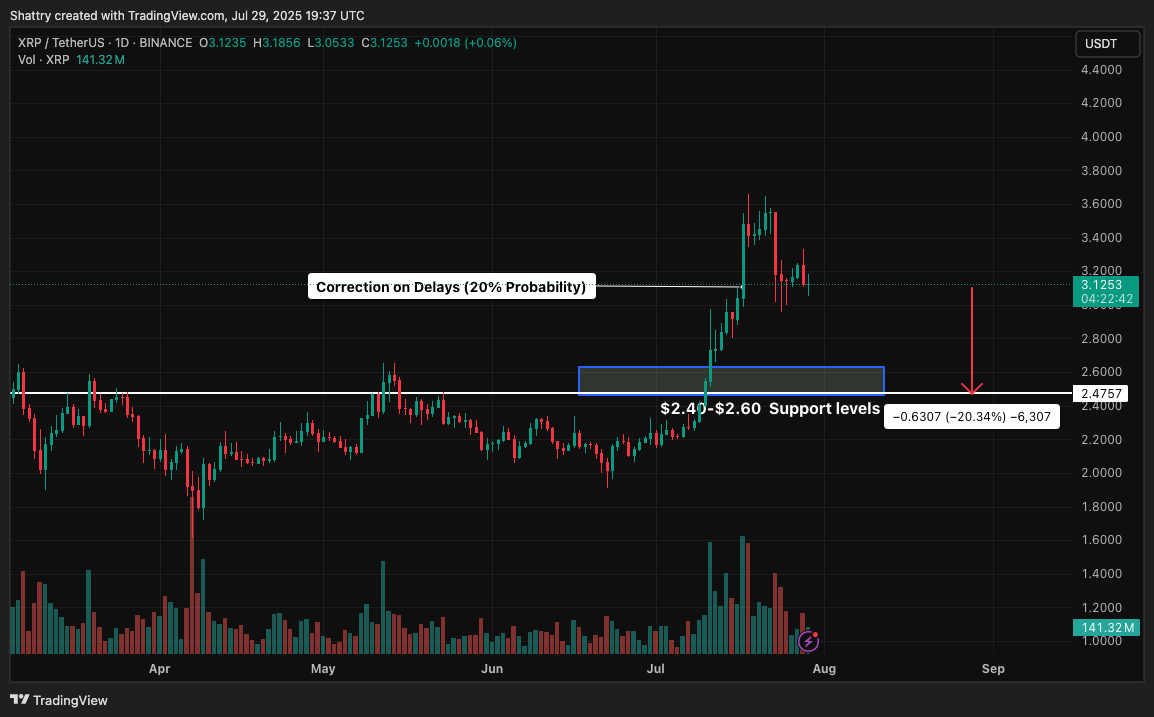
Recovery would depend on institutional buying at lower levels and the eventual resolution of the regulatory framework through alternative pathways or timeline extensions.
XRP’s current positioning reflects a key regulatory juncture coinciding with unprecedented institutional interest and ETF momentum.
The consolidation below EMA resistance requires monitoring for directional confirmation as legal catalysts accelerate.
Next Price Target: $5.00-$6.00 Within 90 Days
The immediate trajectory requires a decisive breakout above $3.20 EMA resistance to validate continued institutional momentum over technical consolidation.
From there, regulatory clarity acceleration could propel XRP toward the $5.00 psychological milestone, with sustained institutional adoption driving toward $6.00+, representing new cycle highs.
However, failure to break $3.20 resistance would indicate extended consolidation into the $2.80-$3.00 range as the regulatory timeline extends, creating an optimal institutional accumulation opportunity before the next legal victory wave drives XRP toward $10+ targets, validating the global payment infrastructure thesis.
The post ChatGPT’s 28-Indicator XRP Analysis: 95% ETF Odds Ignite Battle Over $3.11 Support Line appeared first on Cryptonews.
More and more coins are coming back to the red zone, according to CoinStats.
The rate of Binance Coin (BNB) has declined by 3.11% since yesterday.
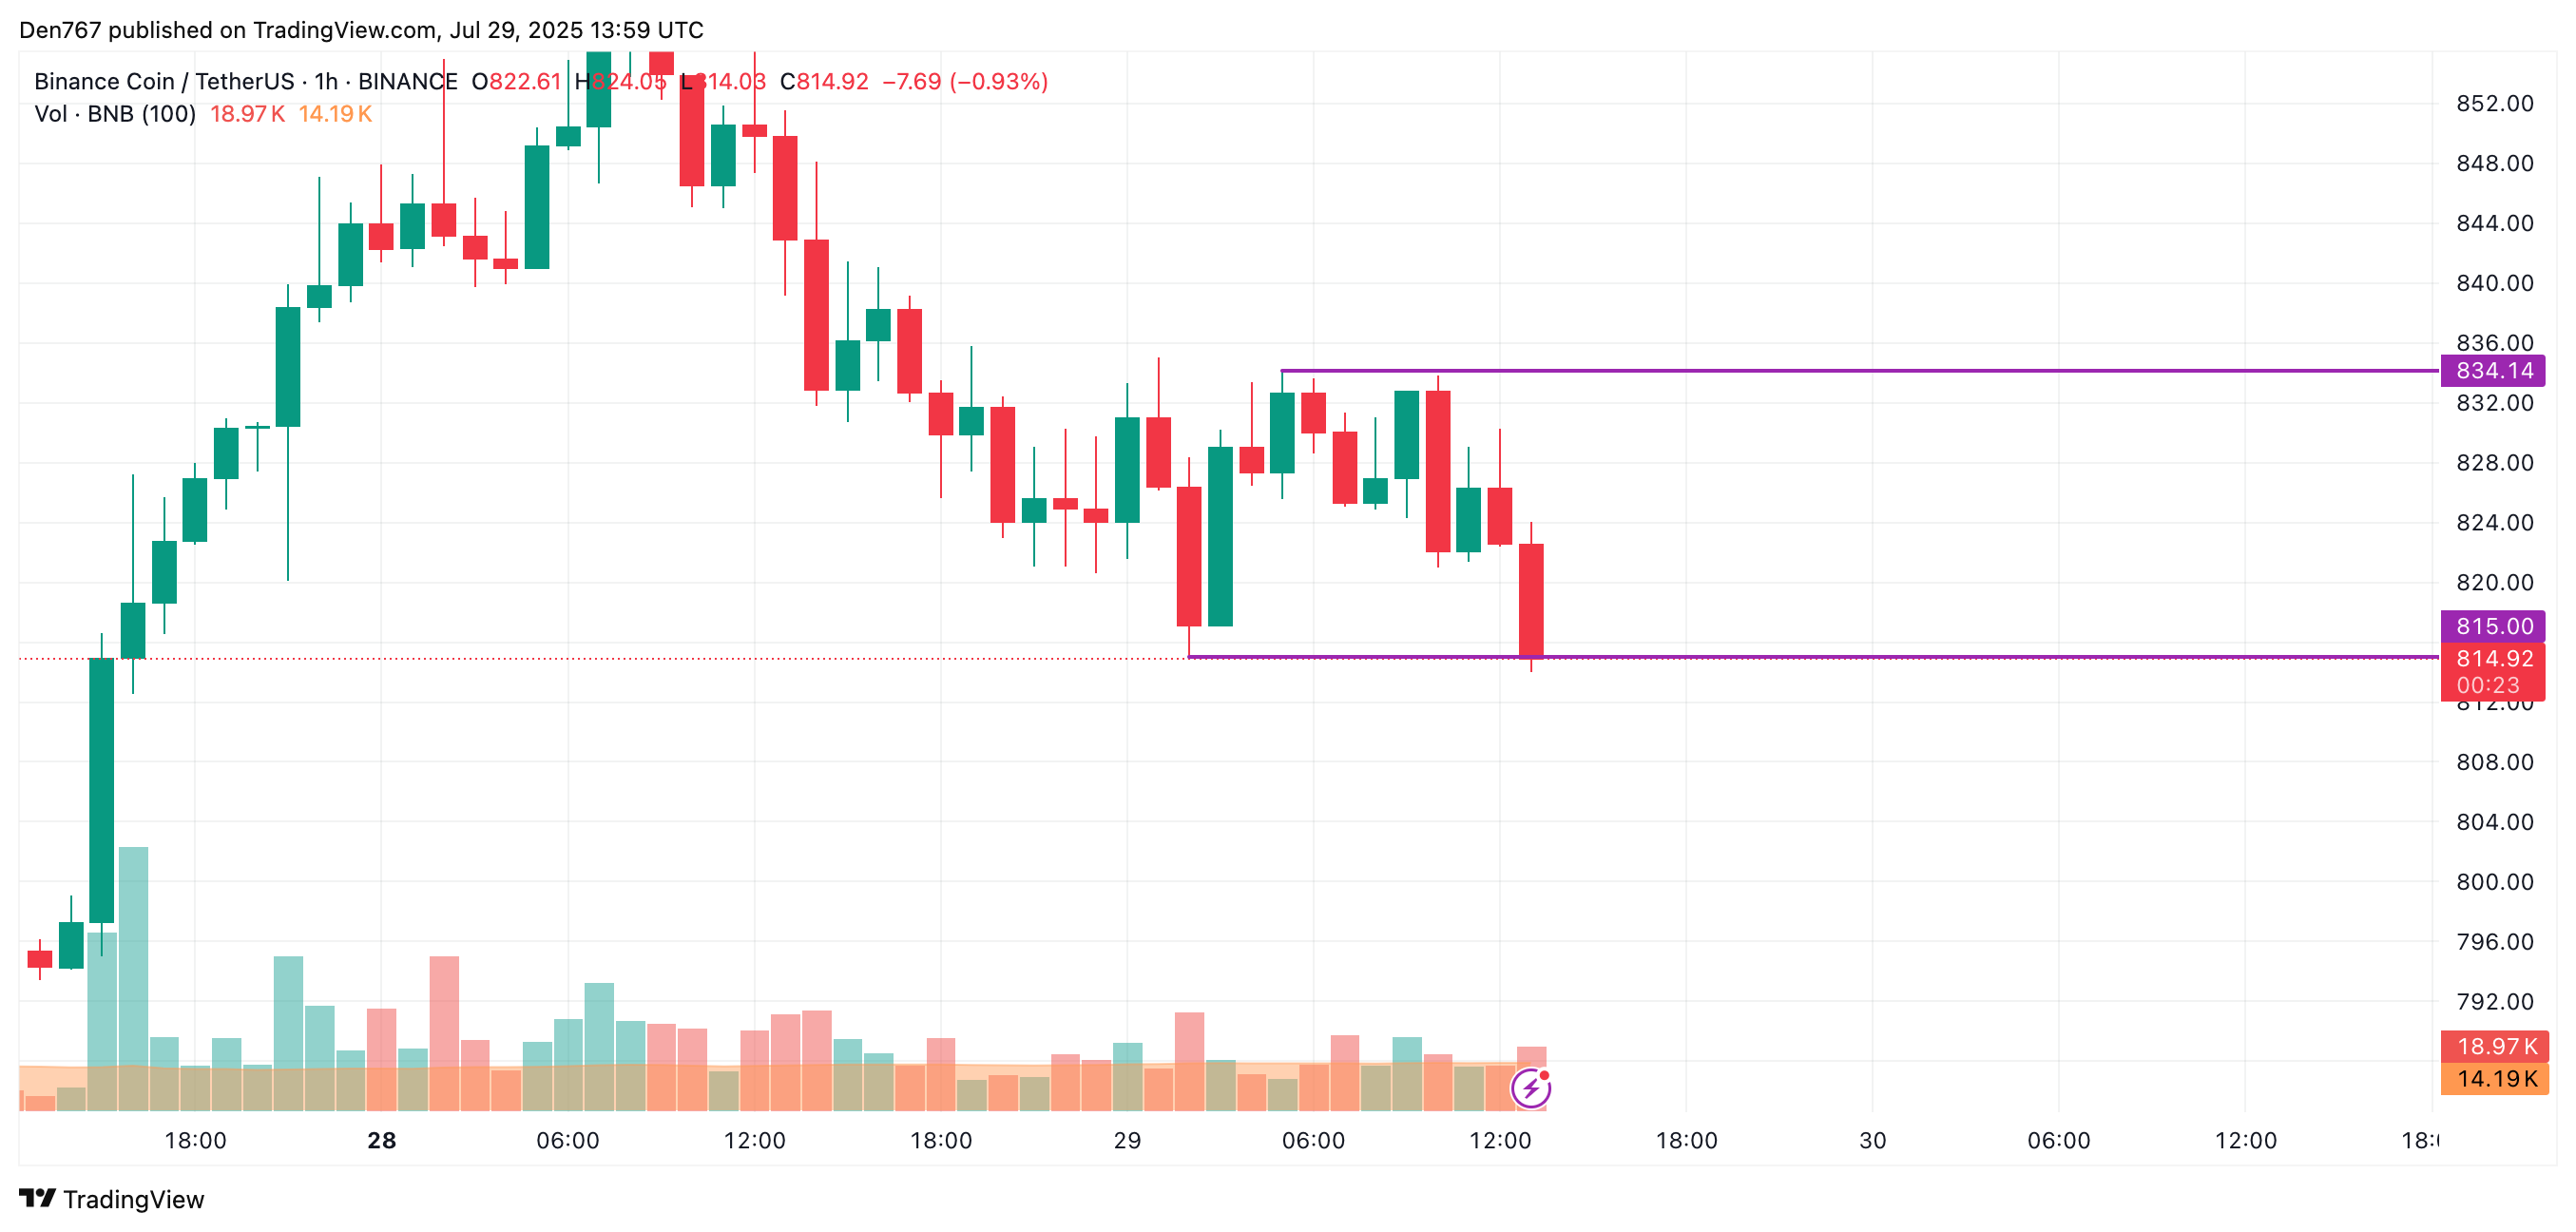
On the hourly chart, the price of BNB is about to break the local support of $815. If it happens, the correction is likely to continue to the $800 area.
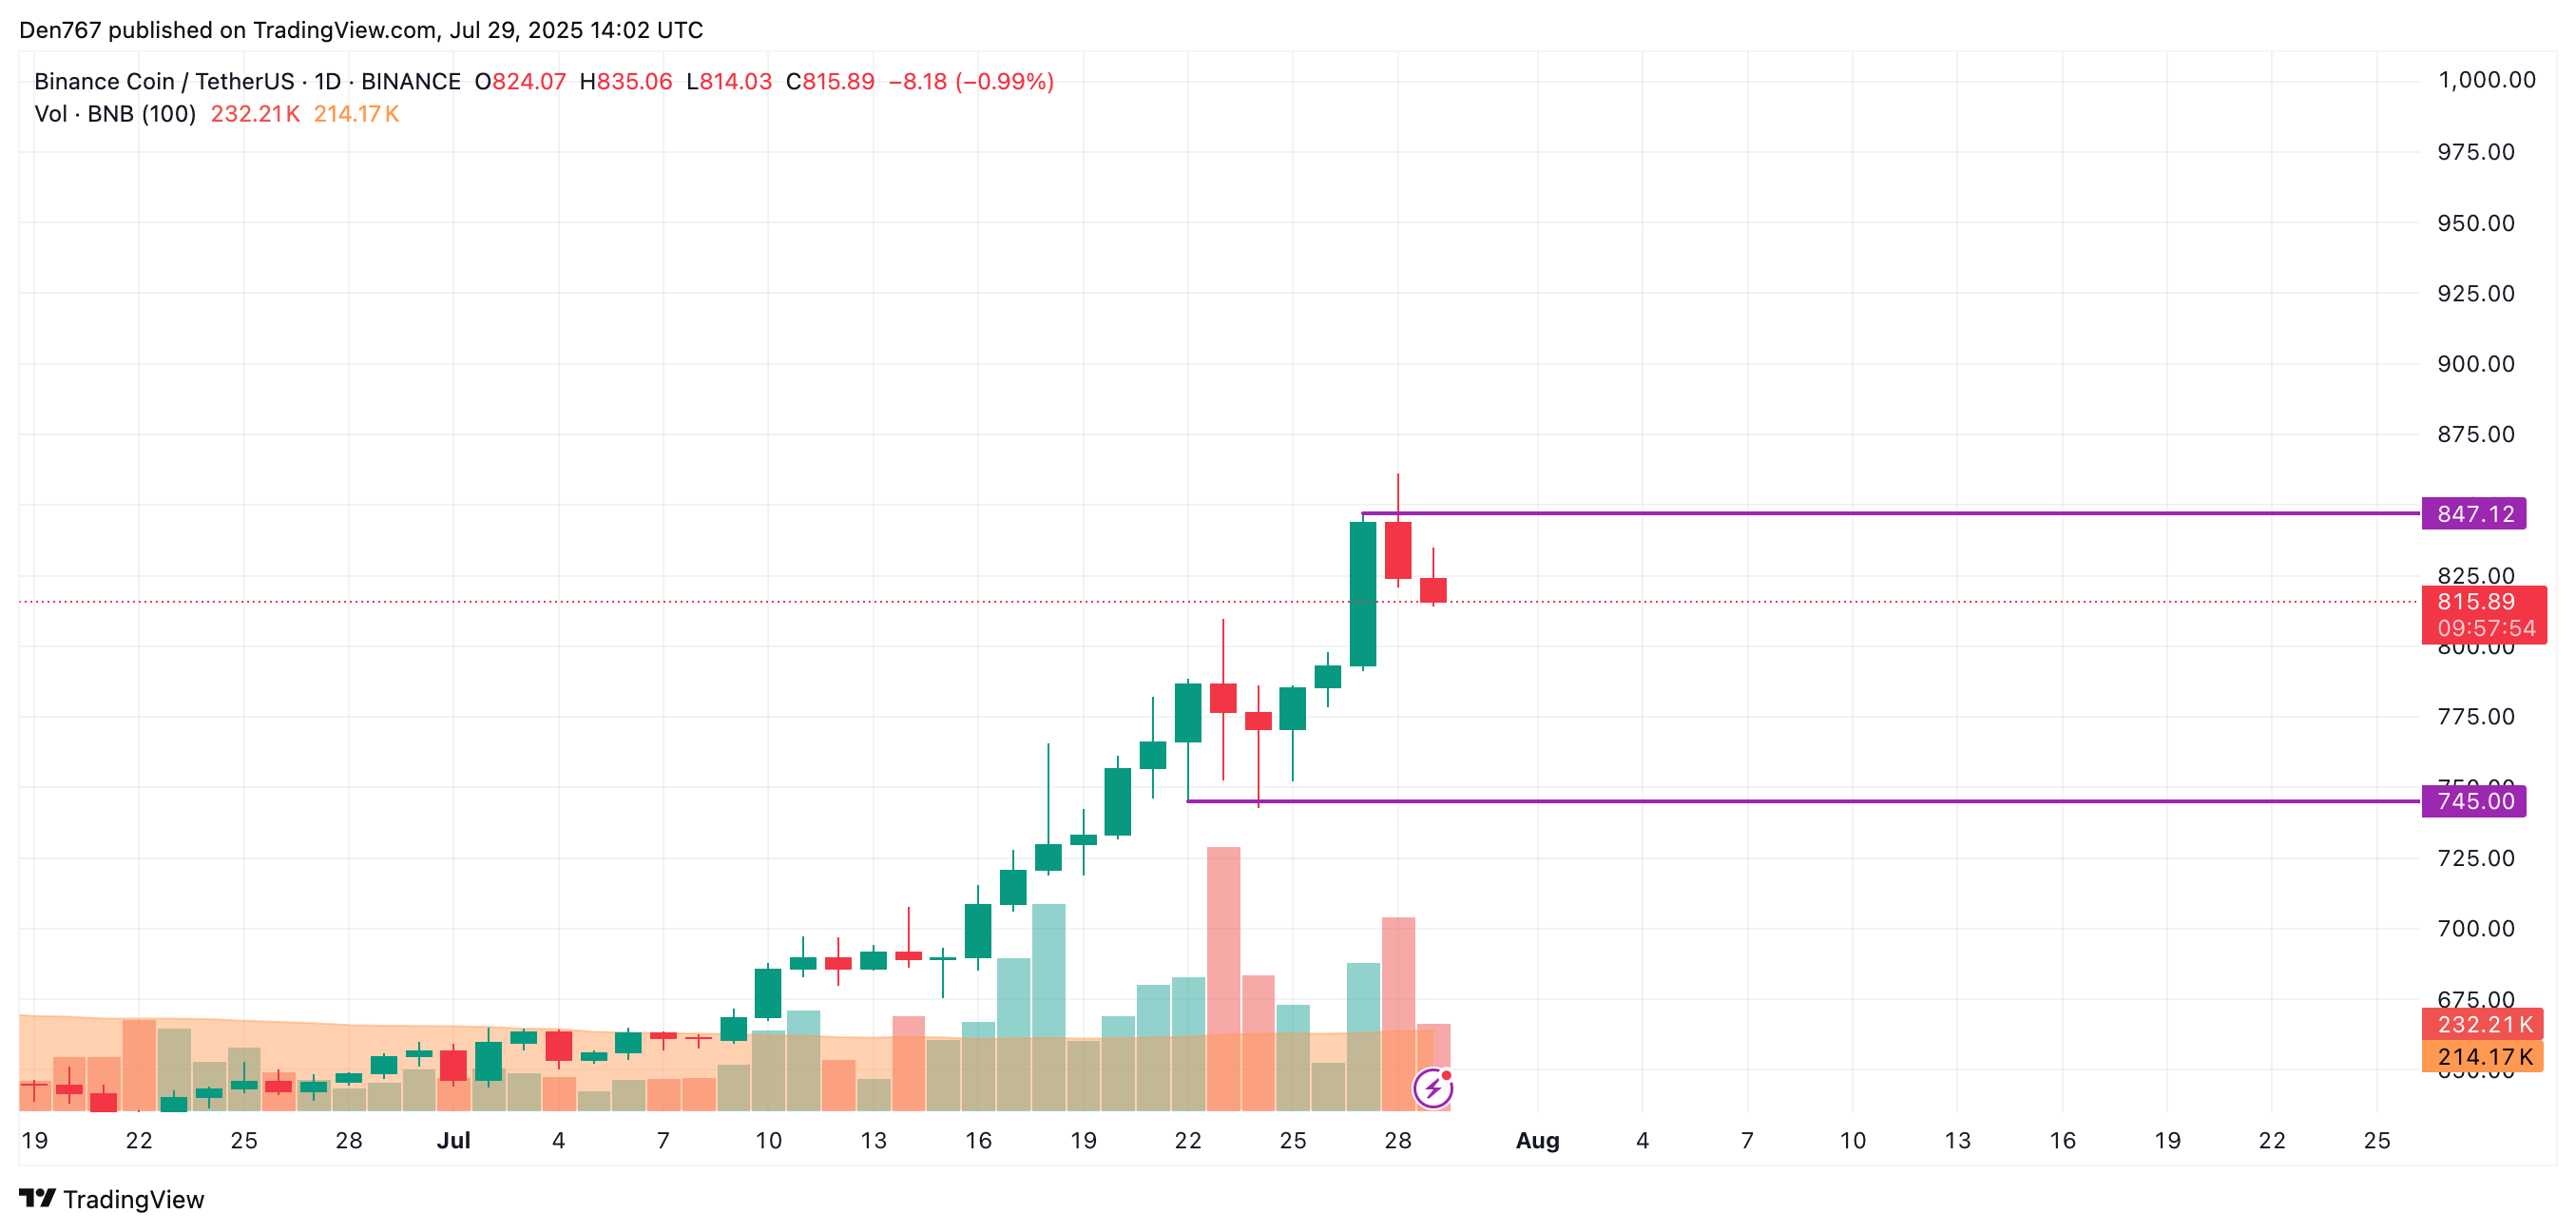
On the longer time frame, there are no reversal signals yet. The rate of the native exchange coin keeps going down after a false breakout of the resistance of $847.12.
You Might Also Like
If the daily bar closes around the current prices or below, traders may witness a test of the $780-$800 range soon.
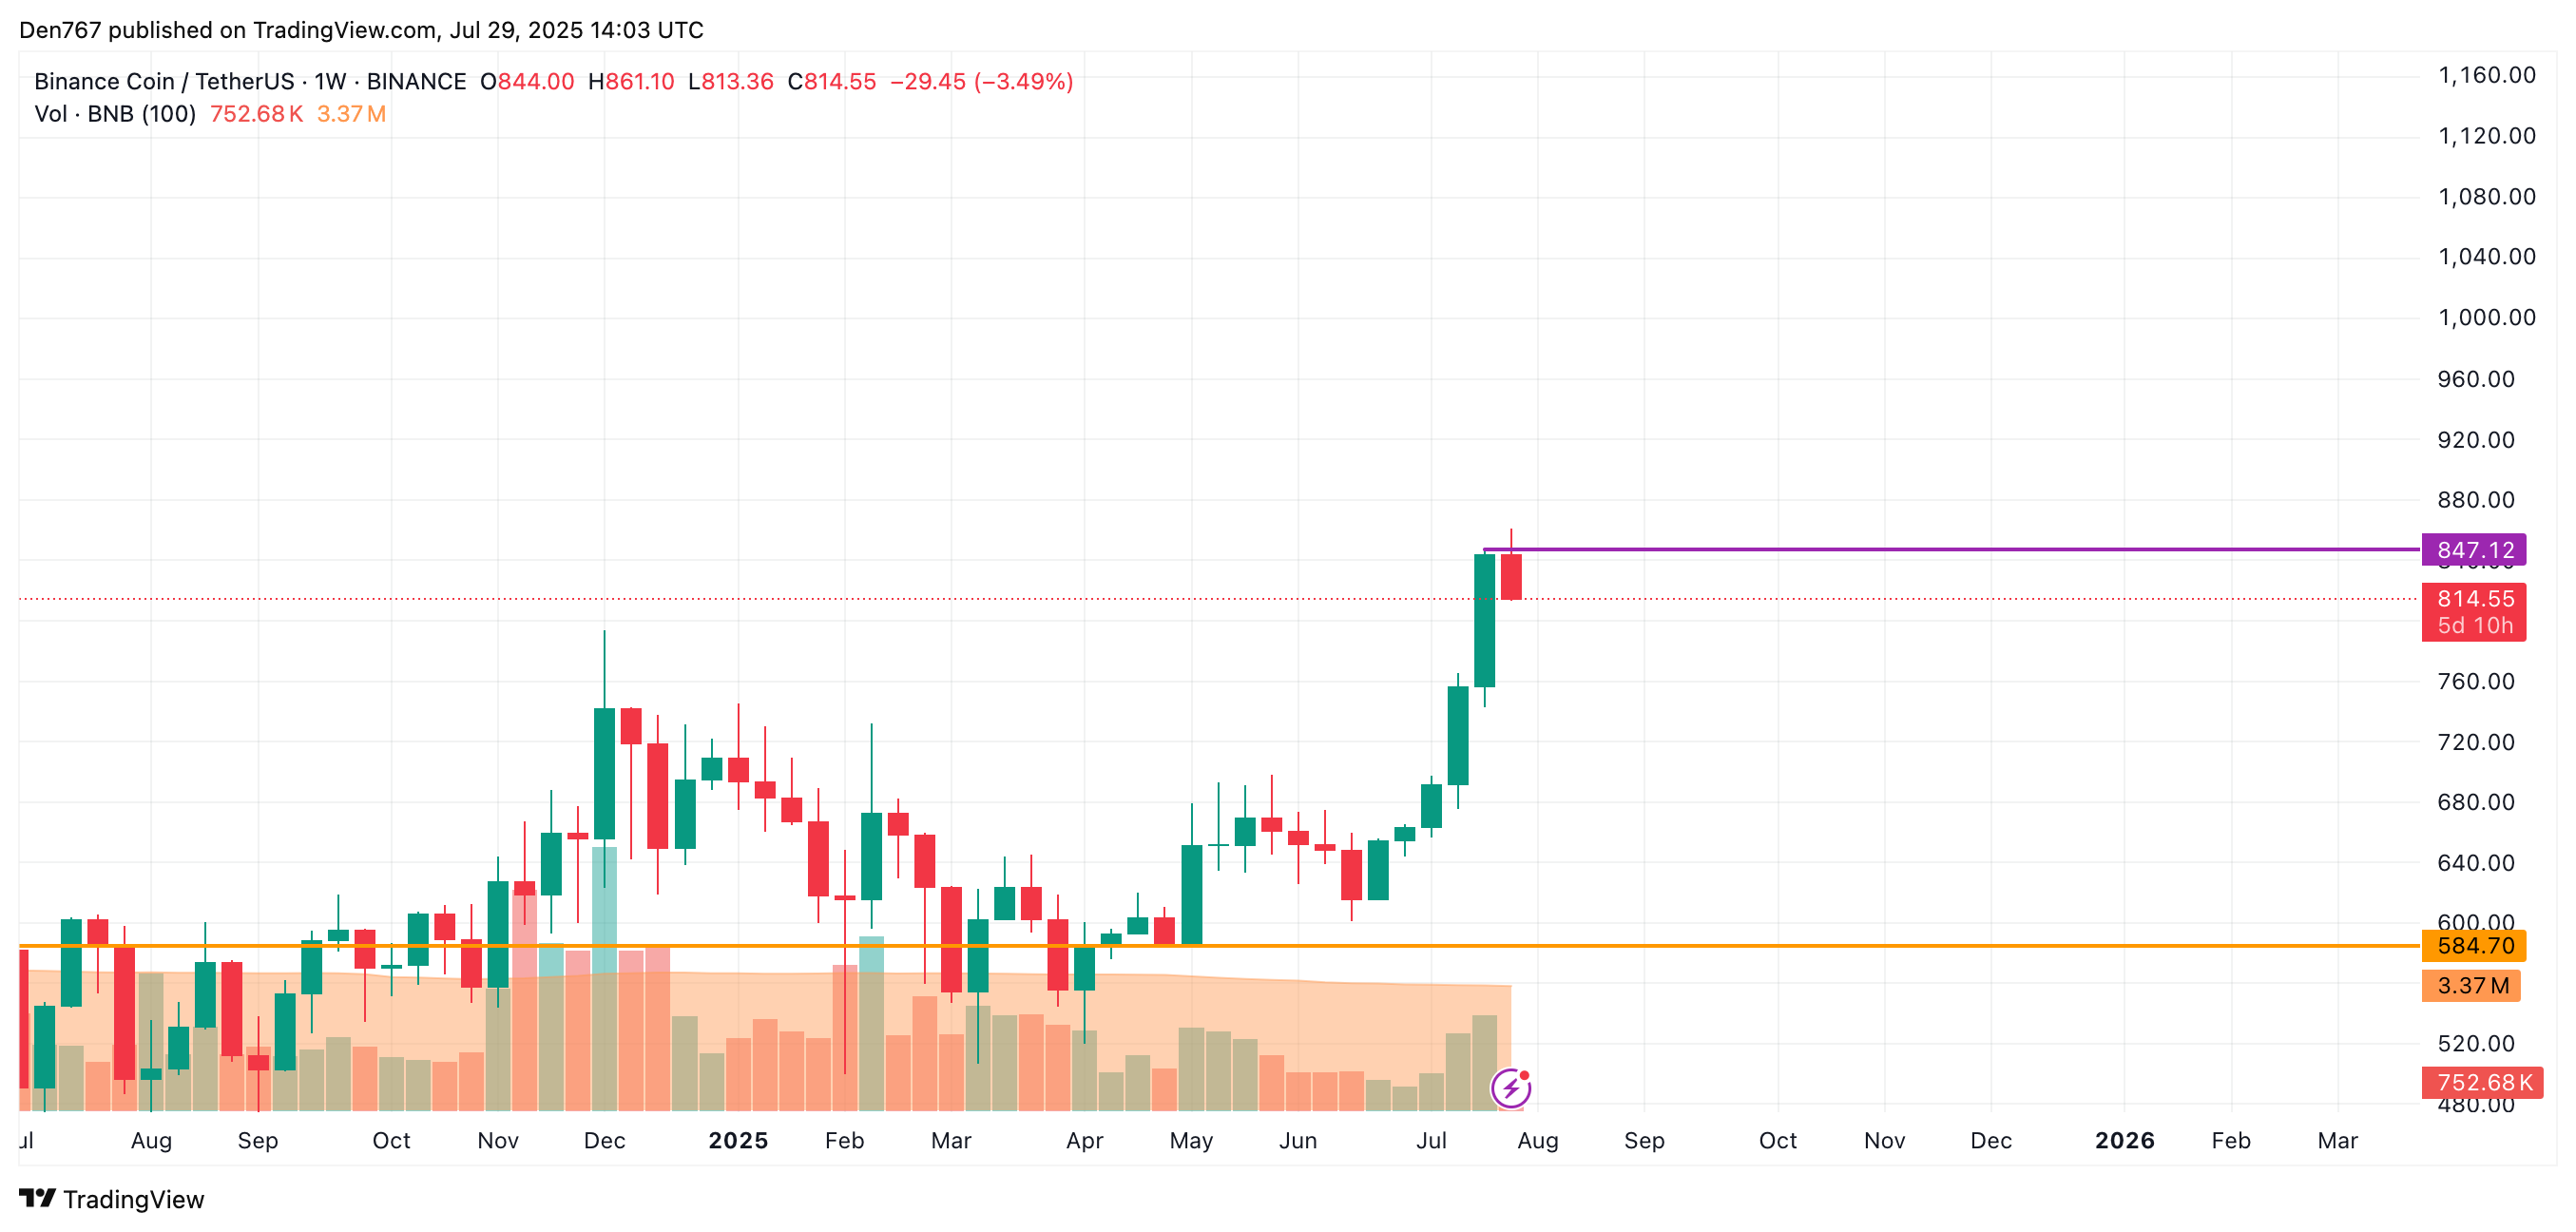
From the midterm point of view, one should pay attention to the weekly bar’s closure. If it happens far from the $847.12 level, there is a high chance of seeing an ongoing decline to the $800 zone and below.
BNB is trading at $814.55 at press time.
$DOGE began the session at $0.240, rallied to $0.248, then plunged during heavy U.S. trading hours, hitting a low of $0.223. A late rebound lifted the price back to $0.226, indicating that buyers were accumulating near the support zone. Notably, volume during the sell‑off spiked to 918 million, more than 2× the 24‑hour average. This indicates that large players may have triggered stop‑loss orders, which could create a base for recovery if demand returns.
Looking at the past 7-days, the chart looks even grimmer, with more than -18% losses.
DOGE/USD price chart in the past week – TradingView
| Level | Significance |
|---|---|
| $0.248 (recent high) | Short‑term resistance; failure to sustain rally triggered the sell‑off. |
| $0.240–$0.241 | Key resistance zone—needs to break for bullish reversal. |
| $0.223–$0.225 | Strong support tested twice; heavy volume suggests accumulation. |
| $0.215–$0.218 | Next support if $0.223 fails. |
Given the heavy sell‑off and subsequent bounce from the $0.223 area, the near‑term outlook is cautiously optimistic. If DOGE holds above $0.223 and can reclaim $0.241, the price could retest $0.260 within days. However, failure to maintain support may send it toward the $0.215–$0.218 range. Investors should monitor U.S. inflation data and Federal Reserve commentary, as macro headwinds may prolong volatility.
For live pricing and charts, visit the DOGE price page.
After rallying to a 2025 high near $3.60 earlier this month, XRP price today has entered a consolidation phase, currently hovering around $3.15. The asset is stabilizing just above the 0.786 Fibonacci retracement level, with key support from the July breakout still holding. Traders are watching closely as momentum indicators cool and structural levels tighten.

XRP broke out of a long-standing descending triangle in early July, triggering a surge that lifted the token from $2.20 to $3.60 in under two weeks. Since then, price has pulled back and is now testing the $3.10–$3.15 demand zone. On the daily chart, the structure remains bullish, with XRP holding above previous resistance zones near $2.80 and $3.00.
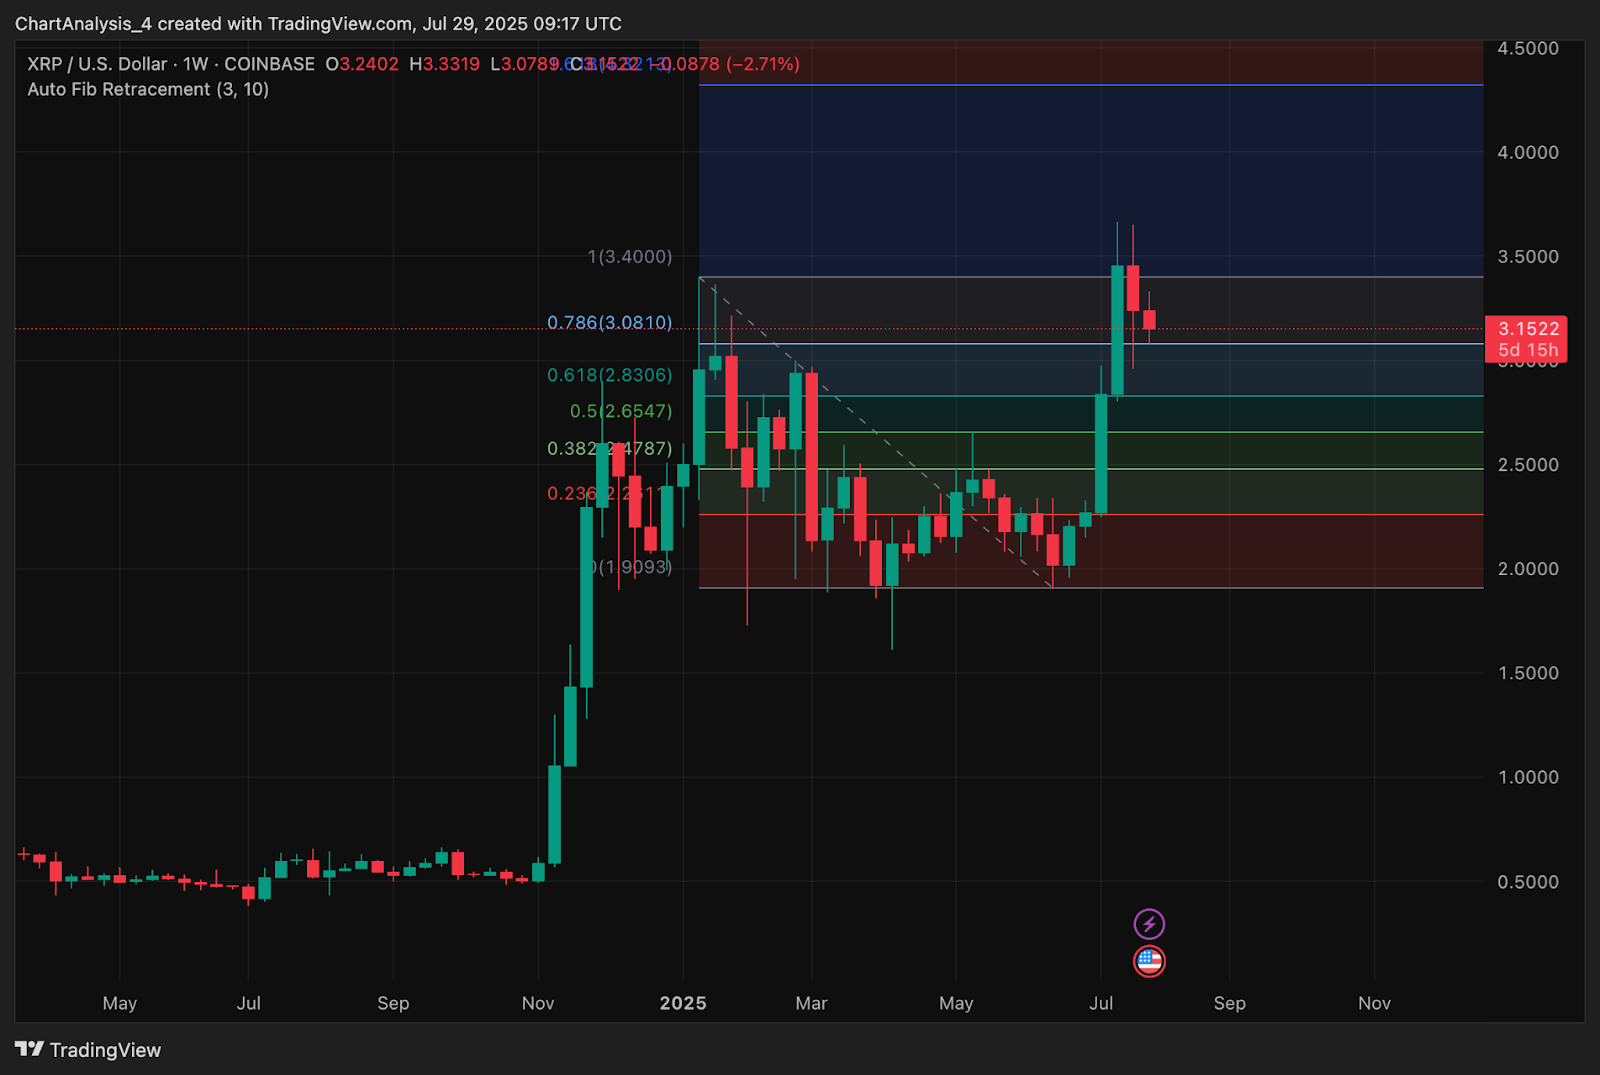
The weekly Fibonacci retracement levels place $3.081 as the 0.786 marker, which has served as a pivot since July 25. This area is now functioning as a near-term magnet for price action. As long as XRP remains above this line, the broader trend bias remains intact.

The post XRP Price Prediction for July 30 appeared first on Coin Edition.
Solana’s long-term price forecasts project a potential 500% gain by 2050, with optimistic scenarios reaching $850 per token. These projections hinge on factors such as widespread adoption, robust developer ecosystems, and the integration of modular solutions like Eclipse, a blockchain built using Solana’s execution layer. However, risks including network instability, competition from Ethereum, and macroeconomic volatility remain significant concerns for investors [1].
The 2025–2030 timeframe outlines a gradual escalation in Solana’s value. For 2025, average prices are expected to reach $194.27 by December, with volatility anticipated due to macroeconomic shifts and U.S. election dynamics [1]. By 2026, the price could stabilize between $165.90 (minimum) and $287.31 (maximum), driven by institutional interest and Solana Pay adoption. In 2027, projections rise to $379.23 as the network expands into mobile-first applications and DePIN projects. The 2028–2030 period sees exponential growth potential, with 2030’s maximum price hitting $579.68, fueled by institutional staking and global fintech integration [1].
Longer-term forecasts (2031–2050) become increasingly speculative but are anchored in Solana’s ability to maintain scalability and adapt to emerging technologies. By 2035, the price could range between $300–$450, assuming CBDC and DeFi integration. In 2040, estimates suggest $400–$650, reflecting its role in decentralized identity and cross-chain systems. The 2050 projection of $700–$1,200 hinges on Solana’s integration into IoT, smart cities, and AR/VR economies, though technological obsolescence or geopolitical shifts could derail growth [1].
Eclipse’s modular approach, leveraging Solana’s infrastructure, is cited as a key bullish catalyst. Analysts argue that cross-chain liquidity and reduced reliance on bridges could enhance Solana’s utility and demand. However, these outcomes depend on the successful execution of Eclipse’s scaling solutions and sustained developer incentives [1].
Critically, Solana’s price trajectory remains sensitive to external factors. Network outages in its history have dented investor confidence, while Ethereum’s dominance in institutional DeFi poses a persistent challenge. Regulatory clarity, particularly in the U.S. and Asia, is also a wildcard. Analysts caution that while utility-driven growth is plausible, speculative fervor could lead to overvaluation [1].
For investors, the decision to enter the market balances high potential with inherent risks. Solana’s ecosystem growth, evidenced by rising dApp activity and NFT volumes, supports its case as a foundational blockchain. Yet, the lack of a proven long-term track record and exposure to macroeconomic fluctuations necessitate caution. Strategies such as dollar-cost averaging are recommended to mitigate volatility [1].
Sources: [1] “Solana Price Prediction 2025–2050: 500% Gains by 2050 – Is It Worth Investing?” (https://www.cryptoninjas.net/news/solana-price-prediction-2025-2050/)
Dogecoin started a fresh decline from the $0.250 zone against the US Dollar. DOGE is now consolidating and might decline below the $0.2220 support.
Dogecoin price started a fresh decline from the $0.250 resistance zone, underperforming Bitcoin and Ethereum. DOGE declined below the $0.2350 and $0.2320 support levels.
The decline gained pace below the $0.2300 level. A low was formed at $0.2225 and the price is now consolidating losses. There is also a bearish trend line forming with resistance at $0.2280 on the hourly chart of the DOGE/USD pair.
Dogecoin price is now trading below the $0.2320 level and the 100-hourly simple moving average. Immediate resistance on the upside is near the $0.2280 level and the 23.6% Fib retracement level of the downward move from the $0.2486 swing high to the $0.2225 low.
The first major resistance for the bulls could be near the $0.2350 level or the 50% Fib retracement level of the downward move from the $0.2486 swing high to the $0.2225 low. The next major resistance is near the $0.2420 level. A close above the $0.2420 resistance might send the price toward the $0.250 resistance. Any more gains might send the price toward the $0.2550 level. The next major stop for the bulls might be $0.2650.
If DOGE’s price fails to climb above the $0.2280 level, it could start a downside correction. Initial support on the downside is near the $0.2220 level. The next major support is near the $0.2120 level.
The main support sits at $0.2050. If there is a downside break below the $0.2050 support, the price could decline further. In the stated case, the price might decline toward the $0.1980 level or even $0.1920 in the near term.
Technical Indicators
Hourly MACD – The MACD for DOGE/USD is now gaining momentum in the bearish zone.
Hourly RSI (Relative Strength Index) – The RSI for DOGE/USD is now below the 50 level.
Major Support Levels – $0.2220 and $0.2120.
Major Resistance Levels – $0.2280 and $0.2350.
XRP Price Predictions have been incredibly bullish recently as XRP price movements flash the same buy signals that preceded its explosive 500% rally from under $1 to over $5 in December 2024.
With Ripple price action currently around $3.55 and multiple technical indicators aligning bullishly, the cryptocurrency community is closely watching whether history will repeat itself.
The market is entering what many consider alt season territory and attention is now on whether the next big altcoin 2025 opportunity lies within XRP’s current setup, or are other high growth crypto on the horizon. Let’s dig in.
XRP Price Predictions: Ripple Technical Signals Mirror December Breakout Pattern
Technical analysis reveals striking similarities between current XRP chart patterns and those seen before Ripple price went parabolic.
Ripple’s TD sequential indicator has flashed multiple buy signals on the 4-hour chart, with the latest “9” formation suggesting trend exhaustion and potential reversal. Historically, this same indicator triggered XRP rallies between 6% and 26% following similar setups.
Current XRP Price Prediction models show the token trading within a rising channel, with support forming around $3.15-$3.20 and resistance targets at $3.30-$3.40.
Ripple’s volume analysis indicates significant whale activity near $2.38, with liquidation clusters building between $2.40-$2.45 that could trigger short squeezes if momentum accelerates.

Market Conditions Align for XRP Price Surge
The macroeconomic environment presents favorable conditions for XRP growth, with institutional adoption accelerating and regulatory uncertainty diminishing.
Ripple’s expansion into over 90 payout markets has processed more than $70 billion in transactions, while recent Dubai Financial Services Authority approval for RLUSD stablecoin demonstrates growing institutional acceptance.
Analysts note that XRP recently achieved its highest weekly close in history, breaking above the 2017-2018 all-time high band in a move that mirrors Bitcoin dominance patterns from late 2020.

Remittix: The DeFi Project Redefining Cross-Border Payments
While XRP Price Predictions are speculative and try to draw comparisons from previous rallies, Remittix is building real tech for individuals and businesses. The project’s recent wallet reveal and confirmed Q3 beta wallet launch positions it at the intersection of crypto innovation and real-world utility.
The Layer 2 Ethereum alternative’s focus on underserved remittance markets in Africa, Southeast Asia and Latin America demonstrates real-world problem-solving beyond typical DeFi project speculation and this has captured investor attention.
Why Whales Don’t Want To Miss out on Remittix
Unlike projects that promise future utility, Remittix delivers working infrastructure today, making it an essential consideration for portfolios focused on next big altcoin 2025 opportunities with sustainable fundamentals and measurable adoption metrics.
Discover the future of PayFi with Remittix by checking out their project here:
Website: https:remittix.io
Socials: https:linktr.eeremittix
$250,000 Giveaway: https:gleam.iocompetitionsnz84L-250000-remittix-giveaway
Solana is testing a key resistance zone after record institutional inflows and ARK Invest’s strategic staking move, signaling a potential breakout.
Under the surface of Solana’s recent price movement lies a mix of structural strength and institutional momentum. The announcement of ARK Invest’s institutional staking partnership, along with a record $311 million in weekly inflows, is having a major positive impact on price.
Currently hovering near the $190 to $194 resistance zone, Solana is testing a region that could determine whether the asset reclaims its bullish trend or pauses for consolidation.
In a notable move for the Solana ecosystem, Cathie Wood’s ARK Invest has officially partnered with SOL Strategies to handle its institutional staking needs through the Digital Asset Revolutions Fund. This is a major achievement for the Solana ecosystem. ARK Invest manages over $20 billion in assets under management.
Solana secures institutional backing as ARK Invest partners with SOL Strategies for high-volume staking operations. Source: SOL Strategies via X
Beyond the validation it brings, this kind of institutional involvement often translates into stronger price support. Large-scale staking operations reduce circulating supply, tightening available tokens on the market. Paired with ARK’s credibility, this could spark renewed investor interest and push Solana further into the spotlight.
After a major bullish development, Solana just logged its largest-ever weekly inflow, $311 million across ETPs, ETFs, and funds, according to CoinShares data. That’s not just a new high, it’s three times the previous record. The scale of capital rotation suggests deeper institutional conviction, particularly at a time when other top assets like Bitcoin saw outflows.

Solana logs a record $311M in weekly inflows, tripling its previous high and signaling rising institutional conviction. Source: SolanaFloor via X
This kind of volume can’t be ignored on the price front. With $551 million in inflows month-to-date, and momentum still building, the surge could put consistent upward pressure on SOL’s market value.
Solana is now testing a key resistance band between $190 and $194, an area that previously acted as a sell wall and short-term ceiling. As highlighted by CW8900, this zone represents the first major hurdle before the next liquidity cluster, located around $210 and then $235.
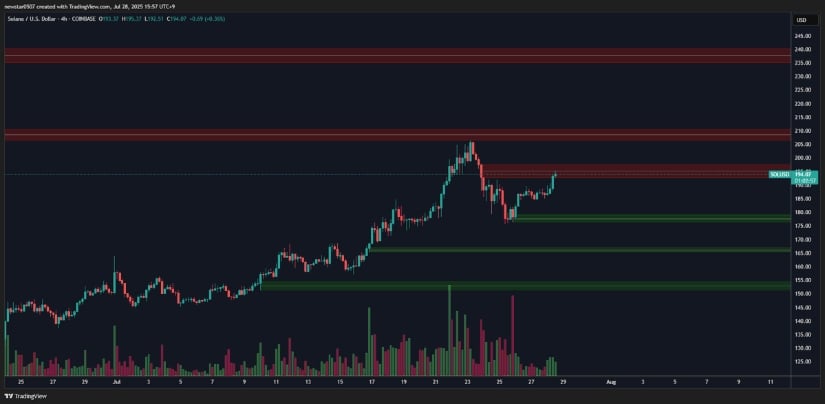
Solana challenges key resistance at $194 as volume builds, with $235 eyed as the next major liquidity target. Source: CW8900 via X
The current structure shows a steady climb backed by rising volume, and price is attempting to pierce through this supply region with multiple intraday rejections already absorbed.
This technical breakout attempt comes on the heels of back-to-back bullish catalysts, including ARK’s institutional staking adoption and a record $311 million in weekly inflows. If SOL can secure a clean close above the $194 range, momentum could quickly extend toward the $210 mark, with $235 remaining the higher-timeframe target should the rally continue.
Solana’s weekly chart is starting to show signs of something bigger unfolding. Trader Tardigrade outlines a compelling long-term structure where price action has been compressing in a wide accumulation range, marked by two failed breakout attempts on both sides.
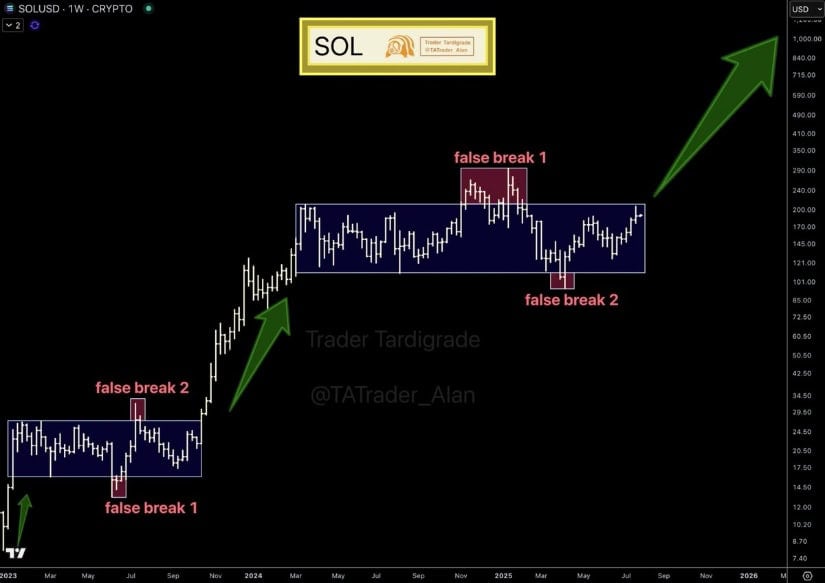
Solana’s weekly fractal hints at a breakout past $260 as accumulation structure tightens and key levels come under pressure. Source: Trader Tardigrade via X
These “false moves” have helped establish well-defined horizontal boundaries, which are now being tested again. With the recent institutional inflows and price reclaiming key zones, the probability of a real breakout, rather than another trap, is increasing.
If SOL clears the upper boundary of this weekly range, the path opens towards its former all-time high around $260, with potential for fresh price discovery beyond that.
While momentum has favored the bulls lately, not all traders are ruling out the possibility of a near-term pullback. As highlighted by OxonTrading, Solana’s 4H chart may be shaping up into a textbook ABC corrective wave. With waves (A) and (B) seemingly completed, a potential (C) leg could drag price back toward the $172 to $174 region before the uptrend resumes. This zone also aligns with previous intraday support, making it a reasonable technical target for a short-term dip.
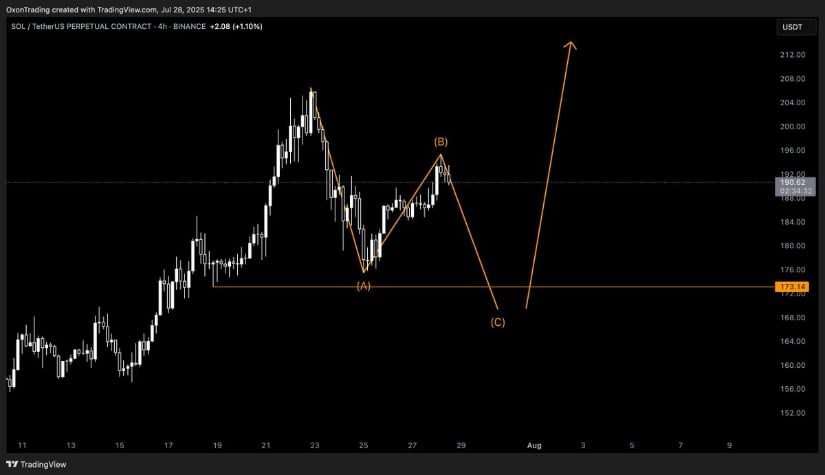
Solana’s 4H chart may be forming an ABC corrective wave, with a potential dip toward $172–$174 before trend continuation. Source: OxonTrading via X
This perspective offers a more cautious counterbalance to the recent bullish flood, especially after SOL’s aggressive push into the $190 resistance band. Even in trending markets, ABC corrections are common and healthy, allowing the market to reset leverage and sentiment.
Solana’s recent surge, backed by institutional inflows, ARK Invest’s strategic entry, and a technically strong setup, has brought it to a critical tipping point. With $311M in weekly inflows and the $190 to 194 zone under attack, bulls are clearly in control for now. If SOL pushes past $194 and holds, the door toward $210 and eventually $235 could swing wide open, especially with momentum and liquidity aligning on higher timeframes.
That said, not everyone’s buying the hype without caution. The possibility of a short-lived ABC correction remains on the radar, with $172 to $174 offering a likely reset zone.
Bears are trying to seize the initiative at the beginning of the week, according to CoinStats.CoinStats”>
The rate of Ethereum ![]() ETHUSD has dropped by 0.6% over the last day.TradingView”>
ETHUSD has dropped by 0.6% over the last day.TradingView”>
On the hourly chart, the price of ETH has fixed below the local support of $3,843. If bulls cannot seize the initiative until the end of the day, the correction is likely to continue to the $3,700 mark.TradingView”>
On the longer time frame, the rate of the main altcoin has made a false breakout of yesterday’s bar high.
If nothing changes by the end of the day, traders may witness a test of the $3,600-$3,700 range shortly.TradingView”>
From the midterm point of view, one should pay attention to the weekly candle closure. If it happens far from the $3,900 zone, bears may come back to the game, which may lead to a drop to the $3,500 mark.
Ethereum is trading at $3,789 at press time.
Almost all of the top 10 coins have started a new week with a correction, according to CoinStats.CoinStats”>
The price of Bitcoin ![]() BTCUSD is almost unchanged since yesterday.TradingView”>
BTCUSD is almost unchanged since yesterday.TradingView”>
On the hourly chart, the rate of the main crypto has fixed below the mirror level of $118,668. If nothing changes by the end of the day, the drop is likely to continue to the $117,500 mark.TradingView”>
On the longer time frame, bears have seized the initiative after yesterday’s bullish closure.
However, the price of BTC is far from key levels, which means sideways trading is the more likely scenario over the next few days.TradingView”>
From the midterm point of view, the picture is similar. None of the sides is dominating, which is also confirmed by falling volume. All in all, traders may expect a consolidation in the range of $116,000-$120,000 by the end of the month.
Bitcoin is trading at $118,093 at press time.
 TRUMP: “Powell must cut rates by 3 points.”
