The main category of Crypto News.
You can use the search box below to find what you need.
[wd_asp id=1]
The main category of Crypto News.
You can use the search box below to find what you need.
[wd_asp id=1]
After a sharp rally that pushed Cardano price to a recent peak of $0.7678, the market is now undergoing a mild correction. As of writing, Cardano price today is hovering near $0.70, down roughly 3.5% in the past 24 hours. The pullback follows a test of the $0.73–$0.75 resistance band, which coincides with a significant supply area and Fibonacci cluster.
Cardano’s rally from sub-$0.58 levels accelerated on July 10, forming a steep vertical leg that pierced multiple resistance zones. However, the move stalled just below the PF1.1R Fibonacci extension at $0.7367, where price sharply rejected and began consolidating lower.
On the 4-hour chart, ADA is now retesting the 20 EMA at $0.6804 and the Bollinger Band midline near $0.6739. This zone has emerged as a near-term demand area. The Supertrend indicator remains bullish with a trend flip near $0.6858, reinforcing the current support.
Price action on the daily timeframe shows a clear Break of Structure (BOS) above prior highs, validati…
The post Cardano (ADA) Price Prediction for July 13, 2025: ADA Pulls Back From $0.74 as Bulls Defend $0.68 Support appeared first on Coin Edition.
XRP has reclaimed its position as the third-largest cryptocurrency by market capitalization following an explosive 25.8% weekly surge that pushed the token past $170 billion in market value.
The Ripple-backed token broke through critical resistance at $2.80, decisively outperforming Bitcoin and Ethereum during a week that saw the broader crypto market reach new all-time highs.XRP ETF: A Big Catalyst for Sustained Momentum
ProShares the launch of the first XRP futures ETFs beginning July 18, 2025, marking a big moment for institutional access to XRP.
🚨 BREAKING: ProShares to launch the first-ever ETF 🇺🇸📅 Trading begins July 18, 2025📈 Crypto is officially knocking on Wall Street’s front door.Is this the beginning of a new era for crypto ETFs? 👀 — John Squire (@TheCryptoSquire)
The institutional momentum behind XRP has reached unprecedented levels, with eleven major asset managers, including Bitwise, 21Shares, Franklin Templeton, and Grayscale, filing for XRP ETF products.
Similarly, whale accumulation has surged to historic highs, with 2,743 wallets now holding over 1 million XRP tokens, collectively controlling 47.32 billion tokens. Source: Santiment on X
This accumulation pattern coincided perfectly with XRP’s breakout above $2.80, liquidating $31.44 million in short positions at that time.
The positive regulatory movement appears increasingly favorable for XRP’s continued ascent.
Investors anticipate the SEC may vote to dismiss its appeal in the Ripple case, building on the 2023 ruling that XRP sales to retail clients were not securities.
Furthermore, data indicates an 88% probability of spot XRP ETF approval by December 2025, while key dates of July 21 and July 25 loom large for leveraged ETF launches and spot ETF decisions. Source: Polymarket
With altcoin season officially according to Santiment analytics, XRP’s technical breakout from multi-year patterns positions it for potential moves toward $6 – $8 levels that could surpass its previous all-time highs.Multi-Year Triangle Breakout Targets $6 Initial Objective
XRP’s weekly chart reveals completion of a massive symmetrical triangle formation that has been building since the 2018 peak at $3.84.Source: TradingView
XRP is currently trading at $2.79, having achieved a decisive breakout above the upper trendline of this multi-year consolidation pattern, with explosive volume that confirms the validity of the move.
Fibonacci extension levels provide a clear roadmap for XRP’s potential trajectory. The 1.272 level sits at $5.96, representing approximately 115% upside from current levels.
The 1.414 extension targets $8.99, while the 1.618 level projects $16.18. The most ambitious 1.786 extension reaches $26.35, though this appears reserved for extended bull market scenarios.
Analyst Ali Martinez’s that “a weekly close above $3 could set the stage for a rally to $6 or even higher” aligns perfectly with these technical projections.Source: @ali_charts on X
The symmetrical nature of the triangle formation, encompassing an entire market cycle from 2019 to present, suggests proportionally larger moves when finally resolved.
Volume characteristics during the triangle showed typical declining patterns as the formation matured, followed by increasing volume on the breakout.
This textbook’s technical development indicates institutional and algorithmic recognition of the pattern completion.
The EMA 200 has been definitively reclaimed around $1.05, providing a solid support foundation for the current uptrend.
XRP trading well above all major moving averages confirms the trend has fully established itself.
The immediate resistance zone sits around $3.19, followed by stronger resistance at $4.31 before reaching the initial $6 target zone.Further Analysis Points to Terminal Wave Toward $5.70
Additionally, the Elliott Wave structure reveals XRP completing a macro triangle pattern within wave (4), now advancing through wave (3) of the larger wave (5) sequence.
Third waves typically generate the most powerful and extended moves in Elliott Wave theory, suggesting XRP’s current advance may be just beginning its most explosive phase.
Source: Maddox_Metrics on TradingView
The breakout from the pennant formation around $2.50 confirms the wave (3) initiation with strong momentum characteristics.
In fact, RSI analysis provides crucial bullish confirmation through a completed bullish divergence pattern.
The divergence occurred when price made lower lows while RSI created higher lows, indicating diminishing selling pressure despite price weakness.
The subsequent RSI breakout above 60 validated the momentum shift, with current readings around 61 suggesting substantial room for additional upside before reaching overbought conditions.
The macro triangle completion represents years of energy accumulation that typically precedes terminal waves of significant magnitude.
XRP’s Elliott Wave count places the cryptocurrency in the final stages of a larger degree pattern, with the analyst’s terminal target of $5.70 representing conservative projections based on standard wave relationships.
This target would establish new cycle highs above the previous $3.84 peak set in 2018.Best Wallet: Your Gateway to Multi-Chain XRP Management During Historic Rally
In light of XRP preparing for its potential ascent toward $6-8 targets, managing and maximizing returns on XRP holdings becomes increasingly critical for serious investors.
Best Wallet is the premier solution for secure XRP storage while providing access to yield generation opportunities across multiple blockchain networks.
Unlike single-chain wallets, Best Wallet’s support for over 60 blockchains, including XRP Ledger, enables seamless portfolio diversification during altcoin season.Source: Best Wallet
The platform’s integration with Rubic exchange aggregator allows XRP holders to capitalize on optimal swap rates across 200+ decentralized exchanges and 20 cross-chain bridges.
This functionality becomes invaluable during a bull market when timing and execution speed determine profit maximization.
As XRP potentially enters a parabolic phase targeting historical highs, having access to next-generation projects through Best Wallet’s launchpad feature could multiply portfolio returns beyond XRP’s performance.
Most significantly, Best Wallet’s $BEST token offers exclusive benefits, including reduced trading fees, early access to promising presales, and higher APY staking rewards.
With upcoming features including crypto-backed debit cards and portfolio management tools, joining the $BEST Presale, which has raised over $13M, is a way to be part of the progress, or you can follow them on or .
Solana is pressing against a key resistance zone, with staking momentum and bullish patterns hinting at a potential breakout toward $180 and beyond.
Solana price is starting to look like it’s gearing up for a major breakout, but it’s not there just yet. Market watchers are closely eyeing the $162 to $167 zone, a thick wall of resistance that’s capped multiple rallies. If bulls can finally break through, the next leg could send SOL flying.
In a latest news development, shared by Cointelegraph, Robinhood just brought SOL and ETH staking in the U.S., and it’s a big moment for Solana. After being dropped in 2023 when the SEC labeled it an unregistered security, SOL is back on one of the most retail-heavy platforms in the space. This clear shift in tone and a signal that regulatory pressure around SOL may be easing.
Solana returns to Robinhood with staking support, signaling renewed retail access and easing regulatory pressure. Source: Cointelegraph via X
From a broader perspective, this rollout could boost staking participation and help Solana gain ground with investors. The ease of access Robinhood offers means more users can now stake SOL without needing to navigate DeFi tools or self-custody.
Just as SOL gains momentum from Robinhood’s staking launch, a familiar name re-enters the scene. On-chain data from SolanaFloor shows that FTX unstaked nearly 190,000 SOL, worth over $31 million. While the transaction itself isn’t necessarily bearish, it does raise questions about potential sell pressure if those tokens hit the market. Participants are watching closely to see whether this is a strategic reshuffle or the start of a larger move from FTX-related wallets.

FTX-linked wallet unstakes 190,000 SOL amid renewed retail momentum, raising questions about possible sell-side pressure. Source: SolanaFloor via X
This development comes at a time when confidence in SOL is starting to pick back up. Retail access through Robinhood and renewed staking support had started to shift sentiment positively. The timing of this large unstake introduces a variable that could impact short-term price action.
Despite fresh momentum from Robinhood staking and on-chain buzz, the Solana price is still stuck under a major technical lid. As highlighted by Market Watcher, the price is grinding just beneath a neckline that’s acted as resistance.
This level at $162 is capping every bounce, and it’s the reason SOL hasn’t followed through like some of its peers. A clean break above that trendline could change the tone quickly.
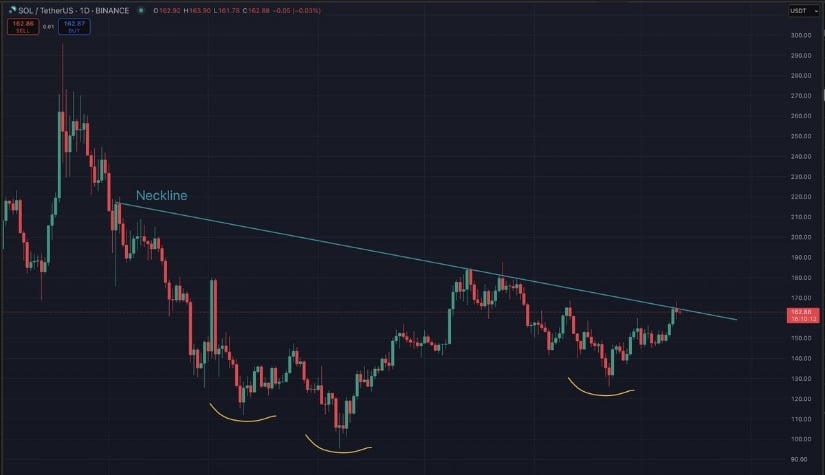
Solana forms an inverse head and shoulders pattern below $162 resistance, with a breakout potential towards $180. Source: Market Watcher via X
The good news is, the setup underneath is getting tighter. Higher lows are forming, and the broader chart is shaping up like an inverse head and shoulders. If volume steps in and SOL Solana price can finally flip that neckline into support, it could unlock the upside towards $180 and potentially higher.
Solana is pressing up against a familiar ceiling. As shown in CW’s chart, the $162 to $164 range has built up into a thick selling wall, capping multiple rally attempts over the past few days. Price is currently hovering just below this zone, making it a crucial level to watch. If SOL can punch through with solid volume, it opens up room for a smoother move toward $180.
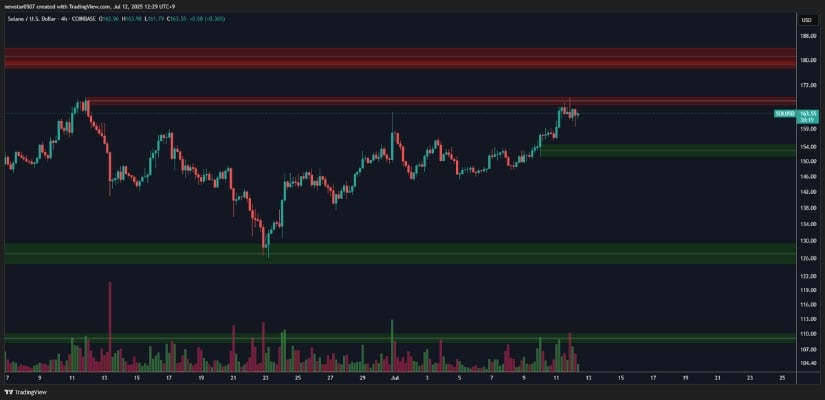
Solana tests the $164 resistance zone with steady volume and bullish structure. Source: CW via X
SOL has been gradually carrying out higher highs and higher lows without overheating, which gives this move a solid foundation. Volume is steady, and momentum hasn’t overextended. If bulls can clear this resistance, the path to $180 looks achievable.
Shelby’s latest chart offers a clean and structured look at where Solana might be heading next once $167 resistance breaks. The ABCD harmonic pattern suggests a potential move up to around $218 if the current bullish leg continues playing out. This projection lines up neatly with previous resistance levels, making it a likely target if momentum stays intact.
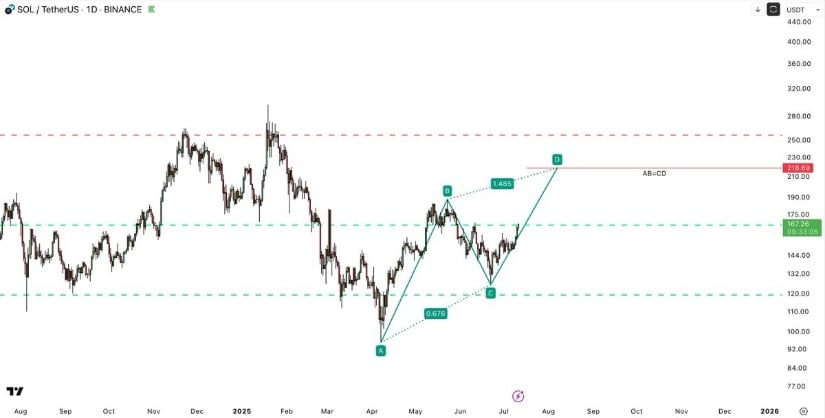
ABCD pattern projects a potential Solana move to $218. Source: Shelby via X
The pattern also shows a healthy retracement at the mid-point (B), giving the setup more credibility. However, Solana will face resistance at $180 zone, and once this breaks, the rally towards $218 could come faster than expected.
Solana is building momentum again, but all eyes remain on that major $162 to $167 resistance zone. From Robinhood’s renewed support to rising staking activity and steady higher lows, the fundamentals and structure both lean bullish.
But for now, this $162 to $167 range remains the battleground. If Solana gets through this range, it’s likely to head for $180 next and could follow through towards the pattern target of $218.
Cardano price pumped this week, reaching its highest point since May 28, as the crypto market surged, and as traders waited for the upcoming NIGHT airdrop. ADA token jumped to a high of $0.75, its highest point since May 28 this year.
Cardano price pumped primarily because of the ongoing crypto market surge that pushed Bitcoin above $118,000 for the first time ever. Such moves always trigger more gains among altcoins.
It also happened as whales continued accumulating Cardano tokens. Santiment data shows that holders of between 10 million and 100 million ADA coins increased their holdings to 13.18 billion, up from the year-to-date low of 11.9 billion. This means that they have bought over 1.28 billion coins worth over $900 million.
More data shows that the daily active addresses on Cardano skyrocketed as the price surged. There were 38.6k addresses, the highest level since May 23rd this year.

A potential reason why whales are busy accumulating Cardano is the upcoming Glacier airdrop, in which holders will receive brand new NIGHT tokens starting from next week.
READ MORE: XRP Price Prediction: Targets $6.2 as Ripple Tailwinds Rise
NIGHT will be the governance token for Midnight, the new privacy-focused sidechain. Midnight will use a technology known as zero-knowledge, which ensures adequate privacy of transactions.
Cardano’s team hopes that Midnight will attract more users to the network as it works towards Bitcoin integration. For example, since Bitcoin transactions are public today, those made inside Midnight will not be easy to track.
Still, the main challenge that will face Midnight is that Cardano’s network has struggled to attract developers and users.
Whales are also buying Cardano because of the rising hopes that the SEC will approve spot ADA ETFs, a move that will lead to more inflows from Wall Street investors.
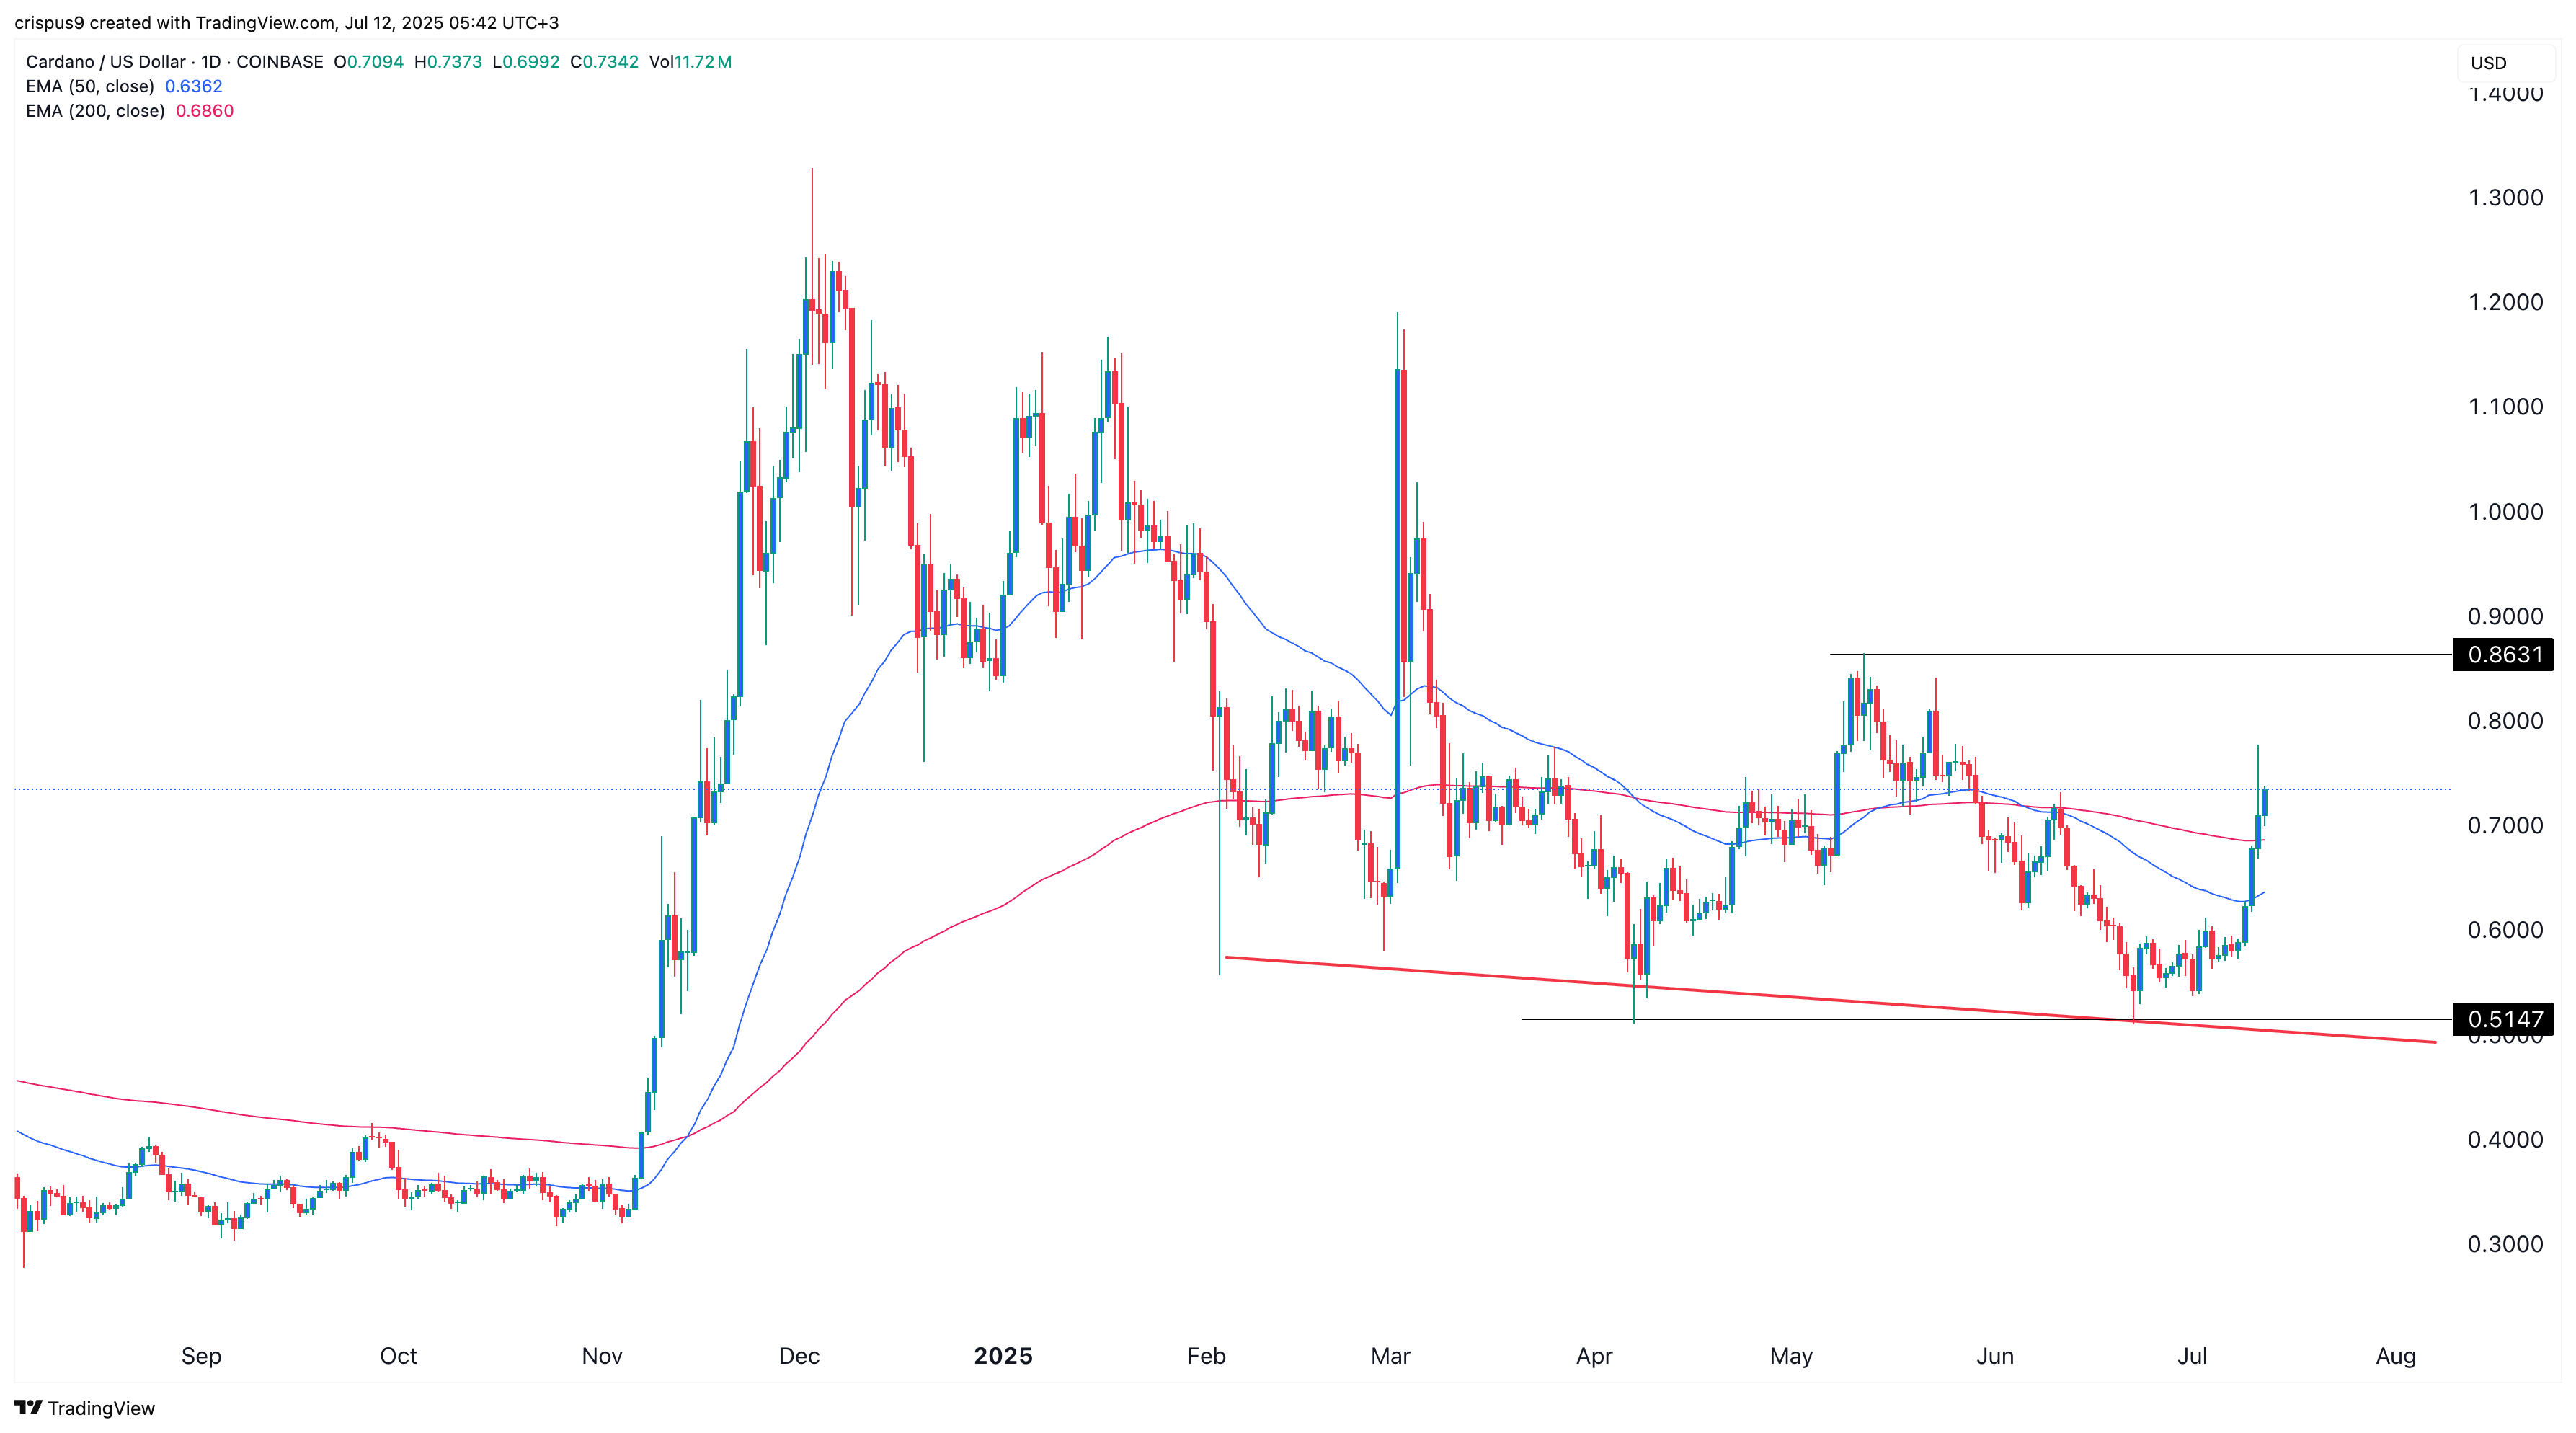
Technically, Cardano price pumped because it formed the highly bullish double-bottom pattern at $0.5147. A double bottom is one of the most common bullish reversal patterns.
Cardano has moved above the 50-day and 200-day moving averages as bulls approach the double-bottom’s neckline at $0.8630. Oscillators like the Relative Strength Index (RSI) and the MACD have all continued rising.
Therefore, ADA price will likely keep rising as bulls target the neckline at $0.8630, its highest level on May 12. More upside will only be confirmed if the Cardano price crosses that resistance level.
READ MORE: Solana Price Analysis as the Staking SOL ETF Assets Surges
XRP is riding high in the latest crypto market rally, with analysts now predicting a potential breakout to new all-time highs this July.
After a stunning 8% price surge and a 26% weekly gain, market sentiment is heating up around XRP as Bitcoin crosses the $120,000 threshold.
XRP is currently trading around $2.80, continuing a multi-day rally that has made it one of the top performers in the altcoin market. As of July 12, XRP price has posted the highest daily gain and the second-highest weekly surge across major cryptocurrencies. This momentum has reignited investor interest and intensified discussions around the next possible leg up.
XRP was trading within the $2.76-$2.80 range, up 7.67% in the last 24 hours at press time. Source: XRP Liquid Index (XRPLX) via Brave New Coin
While short-term resistance remains near $2.83, analysts say the bullish setup is undeniable. The XRP crypto price prediction from market figures such as Pentoshi suggests XRP could soon enter price discovery mode, with an all-time high (ATH) in sight.
According to TradingView and other charting platforms, XRP’s current breakout structure follows a textbook bullish pennant pattern. This structure, combined with increasing volume and strong support around $2.53, suggests that XRP is building toward a sustained move higher.

XRP historically makes two major moves per cycle—first when Bitcoin breaks past previous highs, and again near Bitcoin’s cycle peak—typically within a 365-day timeframe and in similarly sized waves. Source: Flow-Trade on TradingView
As the next resistance zone lies between $2.70 and $2.90, with a breakout above $3.92—the year-to-date high—likely to confirm a run toward $4.20 and beyond. Some predictions even point toward $6 as a plausible near-term target if institutional momentum continues.
A major contributor to this confidence is the Wyckoff accumulation pattern, which XRP has been forming for months. The bullish breakout seen recently is consistent with the markup phase, where assets often move rapidly to new highs.
Beyond technicals, on-chain data shows that wallets holding over 1 million XRP now control 47.32 billion tokens, signaling strong confidence among large holders. At the same time, the introduction and growing anticipation of XRP ETFs—as well as Ripple’s RLUSD stablecoin surpassing $500 million in market cap—have added new layers of investor interest.
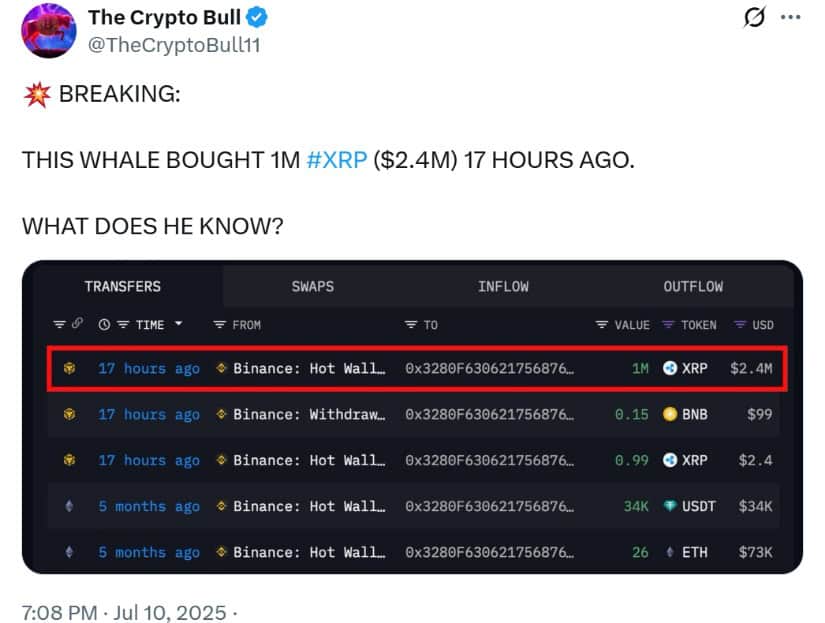
A whale investor purchased 1 million XRP worth $2.4 million just 17 hours ago, raising speculation about potential insider confidence. Source: The Crypto Bull via X
Ripple’s CEO Brad Garlinghouse also continues to press for favorable U.S. crypto regulation. His recent testimony in Congress helped improve sentiment, especially in light of the XRP lawsuit potentially drawing to a close. Optimism is growing over a resolution in the Ripple vs SEC case, which could open the door for broader institutional participation.
Experts are also increasingly turning their attention to long-term forecasts. One notable analysis from XForceGlobal using Elliott Wave theory suggests that XRP is preparing for a powerful Wave 3 expansion, often the most explosive phase in five-wave structures.
According to this model, XRP price prediction 2025 could fall between $5 and $9, with $20 or more considered possible by early 2026 if macro conditions align and adoption accelerates. This is consistent with XRP’s past rally cycles, which have experienced gains of between 16x and 60x in previous cycles.
XRP price forecast 2025 remains optimistic with stronger, broader institutional demand, advancements in ETFs, and increased regulatory clarity.
Despite the bullish forecast, investors are advised to be on the lookout for crucial levels of support and resistance. Unless XRP is able to break through $2.83, a healthy correction to $2.60 or even $1.90 is likely to be observed. The RSI level of 80 also shows that the asset is short-term overbought.
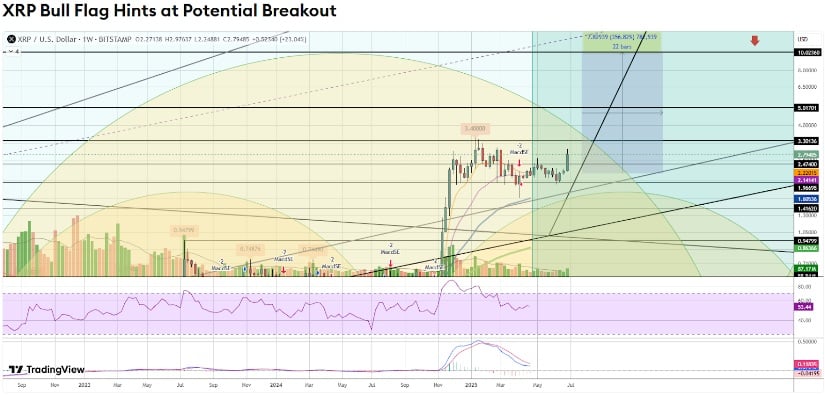
XRP is forming a weekly bull flag, signaling bullish consolidation that could lead to a breakout toward new yearly highs. Source: TradingMula on TradingView
However, if XRP manages to sustain over $2.83 or regain $3.00 with volume confirmation, then the chances of achieving back to 2018 ATH at $3.84 and continuing higher to $4–$6 become a much bigger proposition.
With Bitcoin setting new records and XRP following closely behind, all eyes are on whether XRP can finally break free from years of consolidation and reclaim a leading role in the crypto bull cycle. The combination of favorable technicals, rising whale accumulation, and regulatory clarity gives XRP a compelling case for reaching a new ATH in July—and perhaps even more in the months ahead.
ETH/USD climbs past $2750: Ethereum has been making headlines in the cryptocurrency world, particularly as ETH/USD breaks through significant resistance levels.
Crypto prices today: Recently, the price surpassed $2750, stirring discussions about the potential for Ethereum to reach the $3000 mark. This article will analyze the current trends, factors influencing Ethereum’s price movement, and the outlook for future performance.
What is Ethereum?
Ethereum is a decentralized blockchain platform that enables developers to build and deploy smart contracts and decentralized applications (dApps). Launched in 2015, Ethereum has become the second-largest cryptocurrency by market capitalization, following Bitcoin. Its native cryptocurrency, Ether (ETH), is used to facilitate transactions on the network and pay for computational services.
The Role of Smart Contracts
Smart contracts are self-executing contracts with the terms of the agreement directly written into code. They operate on the Ethereum blockchain, allowing for trustless and automated transactions. This capability has opened up numerous use-cases across various industries, from finance to gaming, contributing to Ethereum’s growing adoption.
Technical Analysis of Recent Trends
As ETH/USD climbed past $2750, traders and enthusiasts closely monitored this upward movement. The price surge indicated strong bullish sentiment, breaking through previous resistance levels. Technical indicators showed positive momentum, suggesting that a continuation of this trend could lead to further gains.
Key Resistance Levels
Identifying key resistance levels is crucial for traders. The recent breakthrough at $2750 represents a significant psychological barrier. If Ethereum can sustain its momentum, the next target appears to be $3000. Historically, psychological price points often serve as crucial levels of support or resistance.
Market Sentiment
Market sentiment plays a vital role in cryptocurrency price movements. Positive news, such as institutional investment or technological advancements, can drive demand for ETH. Conversely, negative news can lead to sell-offs. Understanding the prevailing market sentiment is essential for predicting price movements.
Institutional Adoption
The increasing interest from institutional investors has been a game-changer for Ethereum. Major financial institutions and hedge funds have begun to allocate portions of their portfolios to cryptocurrencies, including ETH. This trend brings credibility and stability to the market, often leading to price appreciation.
Network Upgrades
Ethereum is undergoing significant upgrades, notably the transition to Ethereum 2.0, which aims to improve scalability and reduce energy consumption. These upgrades are expected to enhance the network’s efficiency, making it more attractive to developers and users alike. As these improvements are implemented, they could positively impact Ethereum’s price.
Regulatory Environment
The regulatory landscape is another critical factor influencing Ethereum’s price. As governments around the world develop frameworks for cryptocurrency regulation, clarity and legitimacy can boost investor confidence. However, stringent regulations could have the opposite effect, leading to uncertainty and potential price declines.
Historical Context
Reaching the $3000 mark would represent a significant milestone for Ethereum. Historically, price levels like this often act as psychological barriers, where traders may hesitate to push beyond. Understanding the historical context behind such price movements helps traders gauge potential market reactions.
Implications of Reaching $3000
If Ethereum successfully reaches the $3000 target, it could attract more attention from both retail and institutional investors. A surge in buying pressure could lead to further increases, creating a positive feedback loop. Additionally, reaching this target may enhance Ethereum’s standing as a leading cryptocurrency, reinforcing its value proposition in the market.
Risks and Challenges
Market Volatility
The cryptocurrency market is notorious for its volatility. Rapid price swings can occur due to various factors, including market sentiment, external news, and trading volumes. Traders should be aware of this volatility and employ risk management strategies to protect their investments.
Competition from Other Cryptocurrencies
Ethereum faces competition from other blockchain platforms, such as Binance Smart Chain, Solana, and Cardano. These platforms offer similar functionalities and have gained traction in the decentralized finance (DeFi) space. The rise of competitors could hinder Ethereum’s growth and impact its market share.
Technical Challenges
As Ethereum’s network continues to grow, it faces technical challenges related to scalability and transaction fees. High gas fees during peak usage can deter users and developers from utilizing the platform. Addressing these technical issues is crucial for sustaining growth and maintaining user engagement.
Decentralized Finance (DeFi)
The DeFi sector has gained tremendous popularity, with Ethereum serving as the backbone for many DeFi projects. By enabling decentralized lending, borrowing, and trading, Ethereum has attracted significant capital and user engagement. The growth of DeFi is a substantial factor supporting Ethereum’s price.
Non-Fungible Tokens (NFTs)
NFTs have exploded in popularity, with Ethereum being the primary platform for their creation and trading. The rise of NFTs has introduced new users to the Ethereum ecosystem, contributing to increased demand for ETH. As the NFT market continues to evolve, it may further bolster Ethereum’s price.
Future Outlook for Ethereum
Short-Term Predictions
In the short term, if Ethereum maintains its momentum and breaks through the $3000 barrier, traders may witness increased buying activity. However, it is essential to monitor market sentiment and external factors that could influence price movements.
Long-Term Potential
In the long run, Ethereum’s potential remains strong, driven by its technological advancements, growing adoption in DeFi and NFTs, and institutional interest. The transition to Ethereum 2.0 could significantly enhance the network’s scalability, making it a more attractive option for developers and users alike.
Ethereum’s recent climb past $2750 raises intriguing questions about its potential to reach the $3000 target. While various factors, including market sentiment, institutional adoption, and technological upgrades, play significant roles in determining price movements, the inherent volatility of the cryptocurrency market remains a critical consideration.
As traders and enthusiasts closely monitor Ethereum’s performance, understanding the underlying dynamics will be essential for making informed decisions. Whether Ethereum reaches the $3000 mark or faces challenges, its position as a leading cryptocurrency continues to evolve, promising an exciting future for those involved in the ecosystem.
When considering shares, indices, forex (foreign exchange) and commodities for trading and price predictions, remember that trading CFDs involves a significant degree of risk and could result in capital loss.
Past performance is not indicative of any future results. This information is provided for informative purposes only and should not be construed to be investment advice. Trading cryptocurrency CFDs and spread bets is restricted for all UK retail clients.
The Dogecoin price has crawled back over the past few days, despite on-chain data indicating whale selling. The DOGE token rose to the important resistance point at $0.20, its highest point since June 11, and 40% above its lowest point in June.
The Dogecoin price has rebounded over the past few days, even as on-chain metrics indicate whale selling. Data shows that DOGE holders with between 1 million and 10 million coins have reduced their holdings from 10.7 billion on July 6 to 10 billion today.
The same trend happened among those holding between 100 million and 1 billion coins, who hold 24.8 billion tokens, down from 26.5 billion earlier this month.
More data shows that DOGE holders with between 100k and 1 million coins have 8.9 billion, down from the March high of 9.2 billion.

Dogecoin whale transactions | Source: Santiment
READ MORE: Solana Price Analysis as the Staking SOL ETF Assets Surges
Still, there are a few reasons why the DOGE price may continue to rise in the near term.
First, Polymarket data indicate that the odds of the Securities and Exchange Commission (SEC) approving a spot DOGE ETF have increased over the past few days. They have moved to 80% from a low of 44% in June.
A DOGE ETF is possible because it is a proof-of-work cryptocurrency like Bitcoin and Ethereum, and the SEC does not view it as a security. It is also a giant asset with a market capitalization of over $30 billion.
Second, Dogecoin remains a relatively inexpensive coin, with an MVRV-Z score of 0.739, significantly lower than the 5.8 recorded in November last year. The MVRV indicator has pointed upwards, a sign that the coin is gaining momentum.
Third, the Dogecoin price is likely to benefit from the ongoing crypto bull run, which may push Bitcoin to over $150,000, as we predicted earlier.
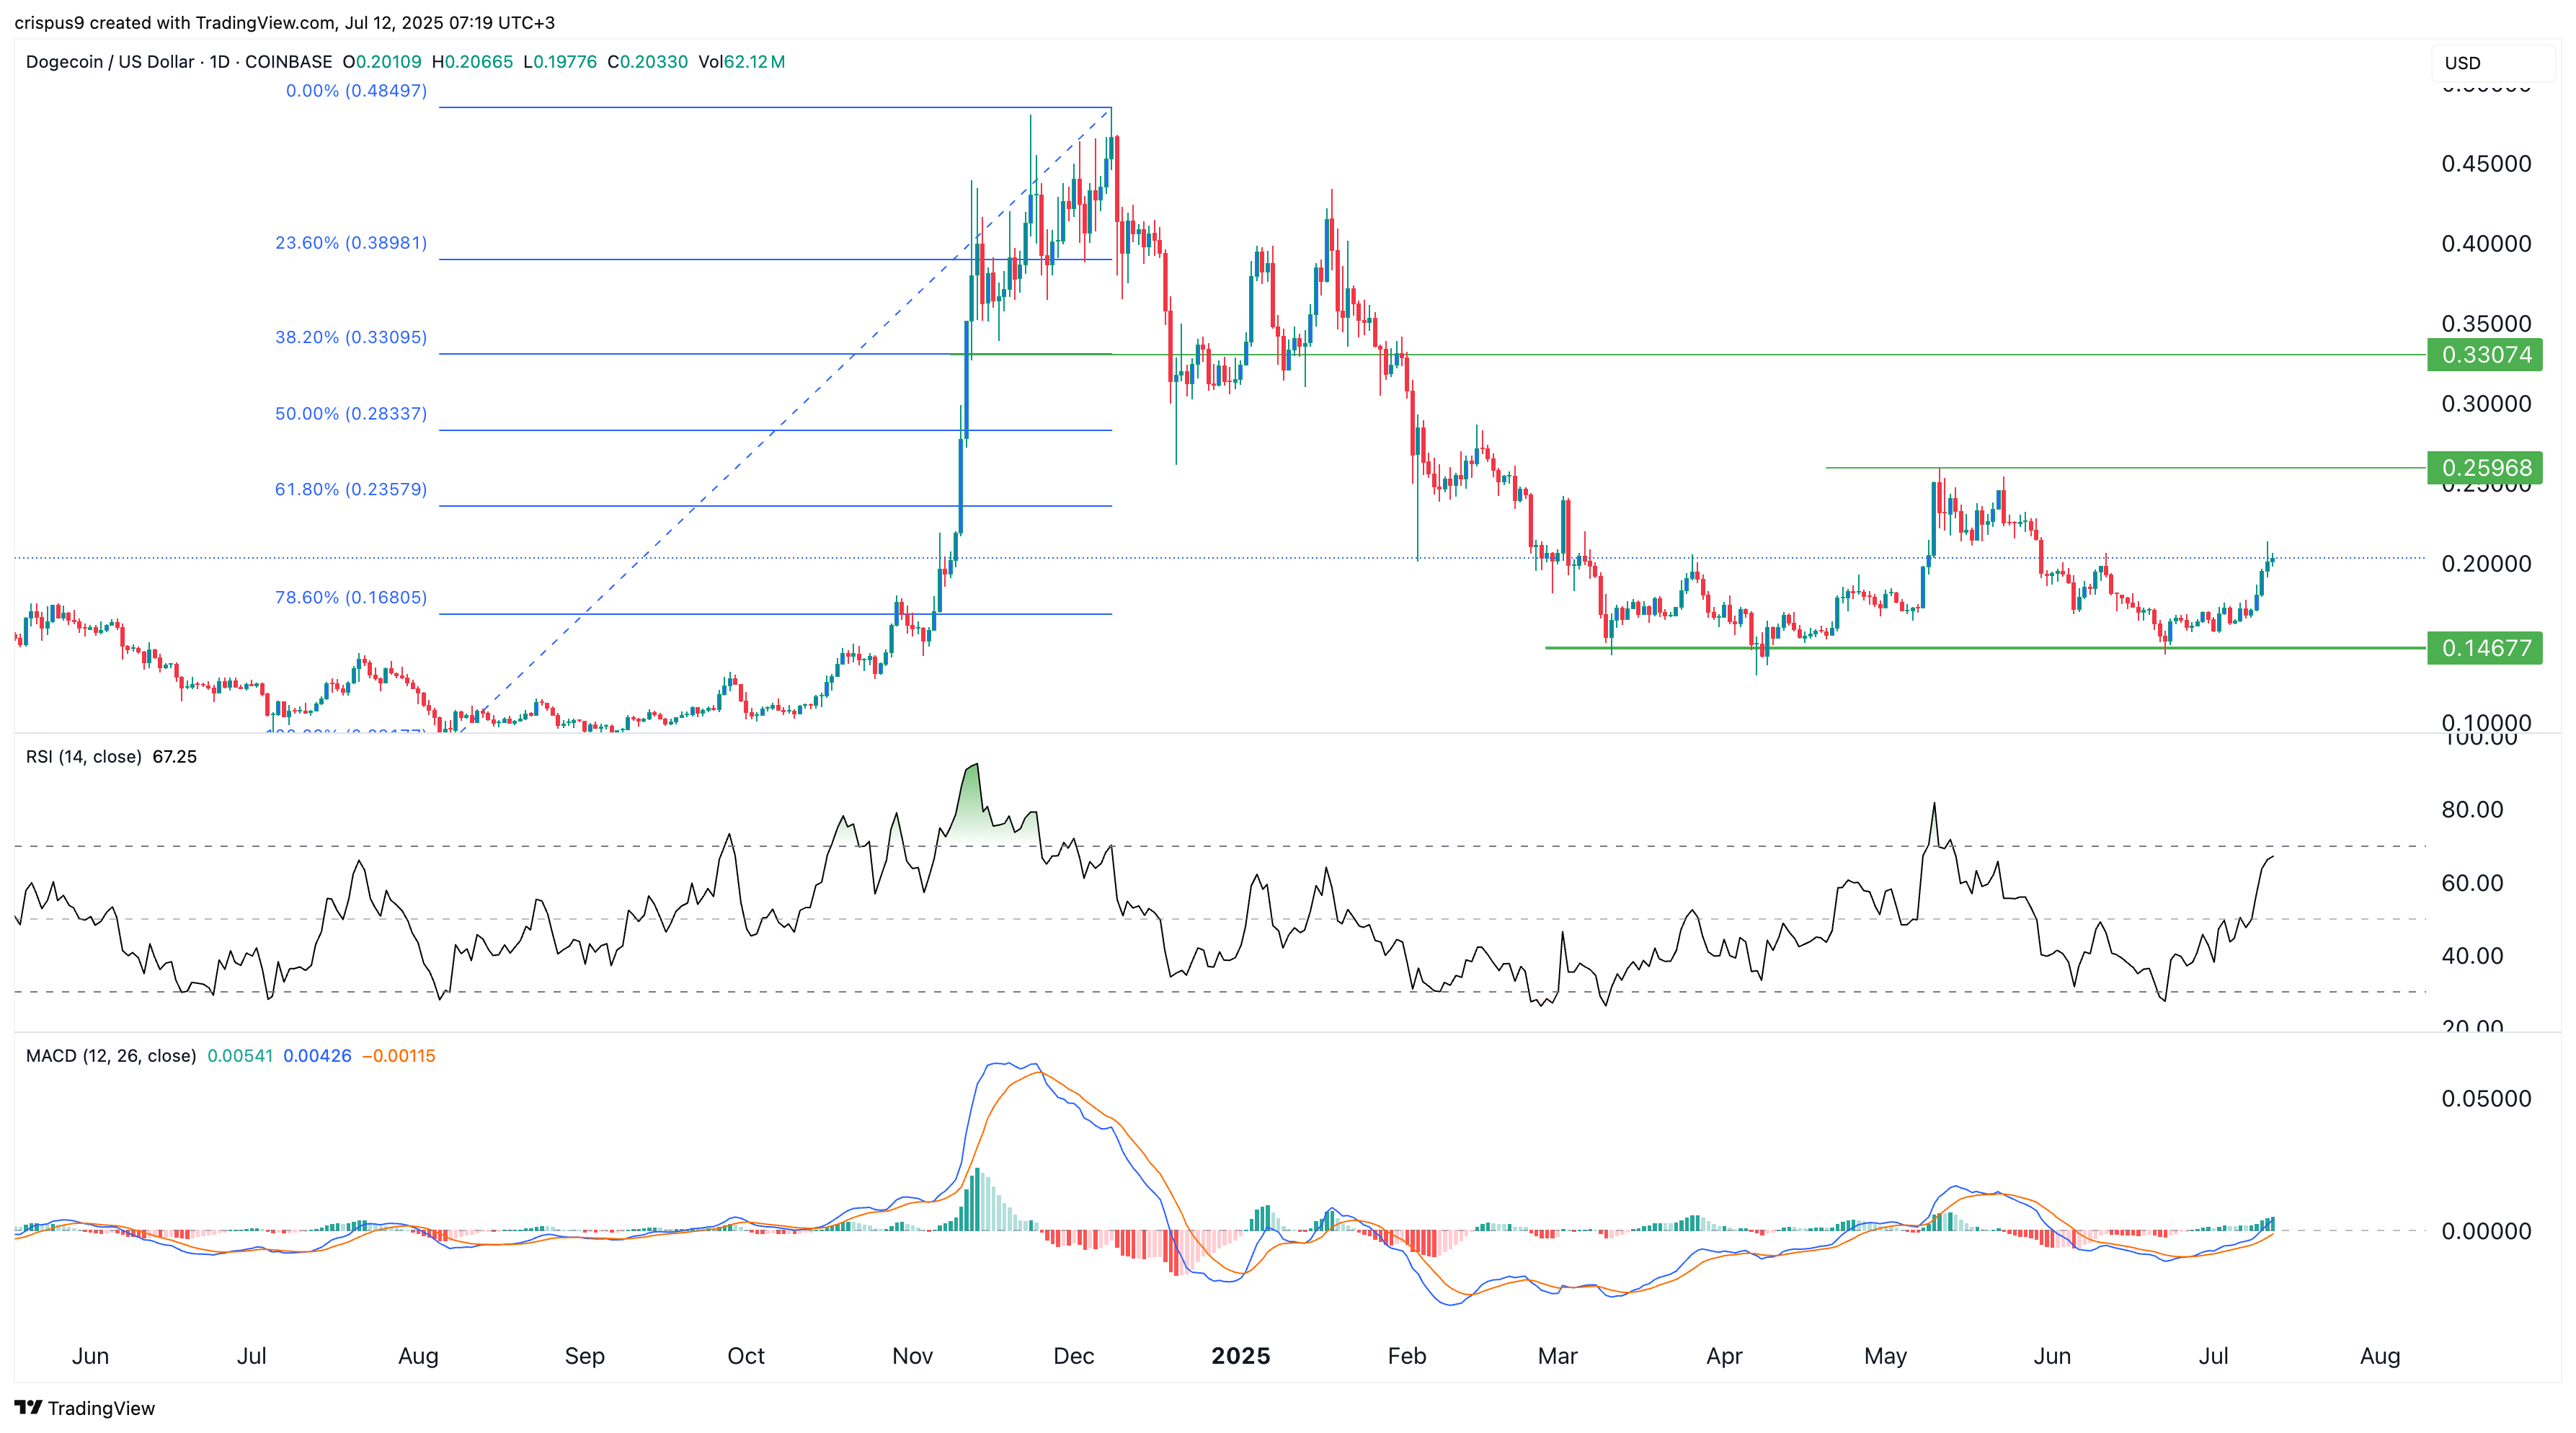
The other bullish catalyst is that the DOGE price formed a double-bottom pattern at $0.1467 on April 8 and June 22. This pattern often leads to a strong recovery over time.
Dogecoin’s Relative Strength Index (RSI) has jumped to 67, its highest level since May 14. The MACD indicator has moved close to the zero line and is pointing upwards.
Therefore, the token will likely continue rising as bulls target the next key resistance point at $0.2596, the neckline of the double-bottom pattern. A move above that level will indicate further gains, potentially reaching $0.3300, the 38.2% Fibonacci Retracement level.
READ MORE: Pi Network Price Analysis: Here’s Why Pi Coin is Set to Soar in Value
Between November ’24 and January ’25 XRP surged from $0.50 to $3.27 – but will it break $3 again any time soon? Get our July & August XRP price predictions, technical analysis, and market outlook for the next potential rally.
Ripple (XRP), famous for its aggressive rallies, has been drawing a lot of attention lately as its legal fog clears and US crypto regulations appear to be moving in its favor. That said, despite its impressive run up from $0.50 last November, to $3.27 in January, after it slid under $3.00 on February the first, it has been able to pass that resistance level again. As a result, most traders are asking the same question: Could we see another explosive rally any time soon?
To answer this, we analyze some key indicators: funding rates, premium index, seasonality index, and structure. These indicators provide crucial insights into market dynamics. Let’s dive into the data and see what these indicators reveal about XRP’s potential price action for the rest of July and into August.
Funding rates are a great way to understand how the market is feeling. When funding rates are very high, it usually means many traders are betting on the price going up (going long). This can be a warning sign. If too many people are already long, it might be risky to open a new long position because the price could be near a top.
Let’s look at the XRP chart. In the past, we’ve seen that XRP often goes through long periods of sideways movement (First green box) while funding stays low or even negative. This is a buildup phase. After that, XRP starts to rally, more traders jump in, and funding rates rise sharply (Red box), often right before the price tops out.
Right now, the data shows we’re still in the accumulation phase. Funding is low or neutral, and the price is moving sideways. This suggests the big move hasn’t started yet, but the price is already slowly grinding upwards.
Now let’s take a look at the premium index. This index shows whether traders are paying more for the asset on the spot market or on the futures market. It’s a useful tool to understand if people are accumulating on spot or if there’s a lot of speculation in futures.
When the premium index turns green (positive), it means the price on the futures market is higher than the spot price. When it turns red (negative), it means the spot price is higher than the futures price.

For healthy market conditions, you usually want to see the spot price higher, which gives a negative premium index. This suggests real demand. On the other hand, when the premium index is too high, it means there’s a lot of speculation in futures, and often the market is getting closer to a top.
What we can see in the chart with XRP is that we have already, for a prolonged time, a negative premium index, which means that most action is happening on the spot market (accumulation), and that is a healthy sign. It shows a similar signal as the funding rates, that market conditions are healthy, and that we’re building up momentum for another rally.
XRP belongs to the ISO20022 sector, just like XLM, HBAR, XDC, and many more. Tokens in this sector comply with the ISO 20022 standard, a global framework for financial messaging. This standard is widely used in traditional banking and payments (like SWIFT) to ensure interoperability, security, and efficiency in transactions. This sector has completely outperformed the whole crypto market in late 2024, as you can see in the ISO20022 Season Index below.
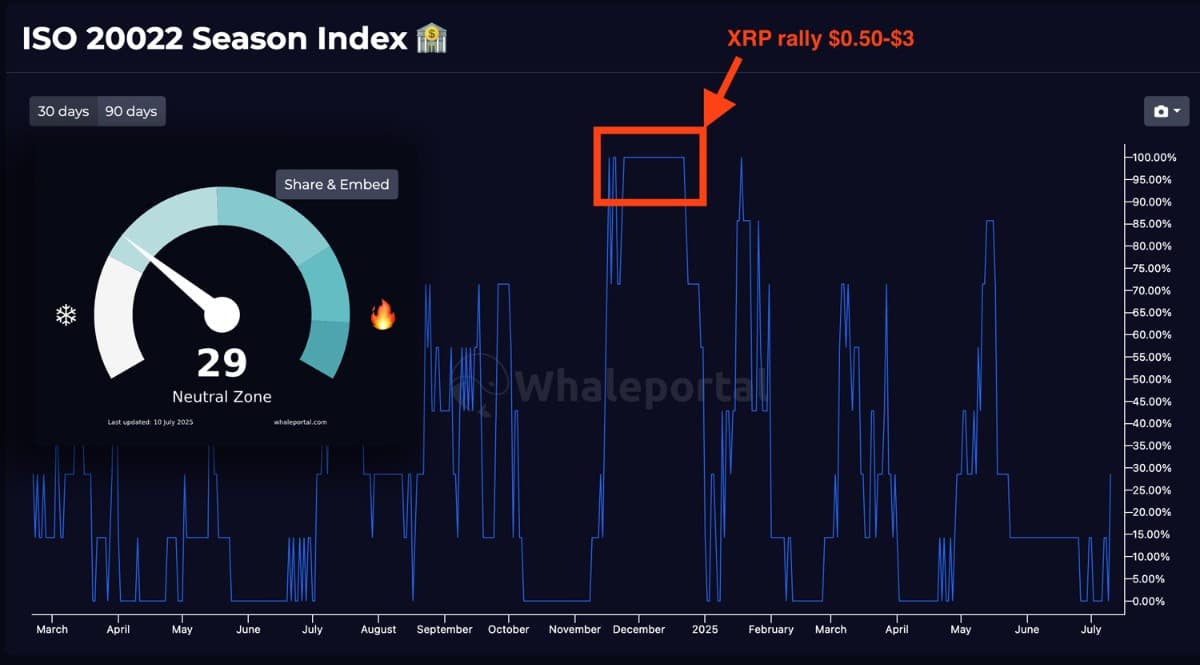
This index measures the strength of ISO 20022 tokens compared to Bitcoin and the broader crypto market. For a while, it hovered between 0 and 15, but recently it spiked to 30, likely driven by strong gains in Stellar (XLM).
This spike could be an early signal that ISO 20022 tokens are starting to attract attention again, and it may suggest that XRP could soon follow with renewed momentum.
After XRP’s big rally in late 2024, where the price jumped from 50 cents to around 3 dollars, the market has been in a period of consolidation. The most recent correction wasn’t been very deep, which leaves many traders wondering what’s going on. XRP is known for sharp and explosive moves, but also for strong pullbacks afterward. This time, the drop has been more shallow than usual – a higher low.
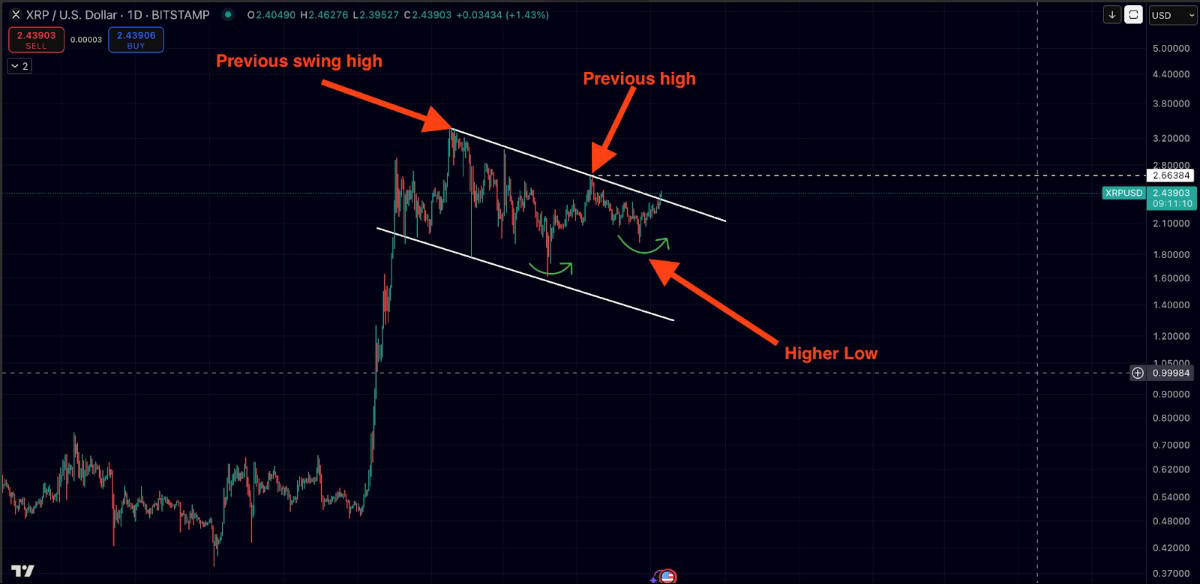
The current chart structure looks quite bullish. There is a declining channel, also known as a bull flag, and the price is now trading above the resistance. A first higher low has already formed, which shows the potential start of a new uptrend. The last key step to confirm the uptrend is a break above $3.00
All signs suggest that XRP is quietly gaining strength. Funding rates remain low, the premium index shows healthy spot market accumulation, and the ISO 20022 sector is starting to attract attention again, with coins like XLM leading the way. On top of that, XRP’s chart structure looks bullish, with a breakout from a declining channel and a clear higher low already in place.
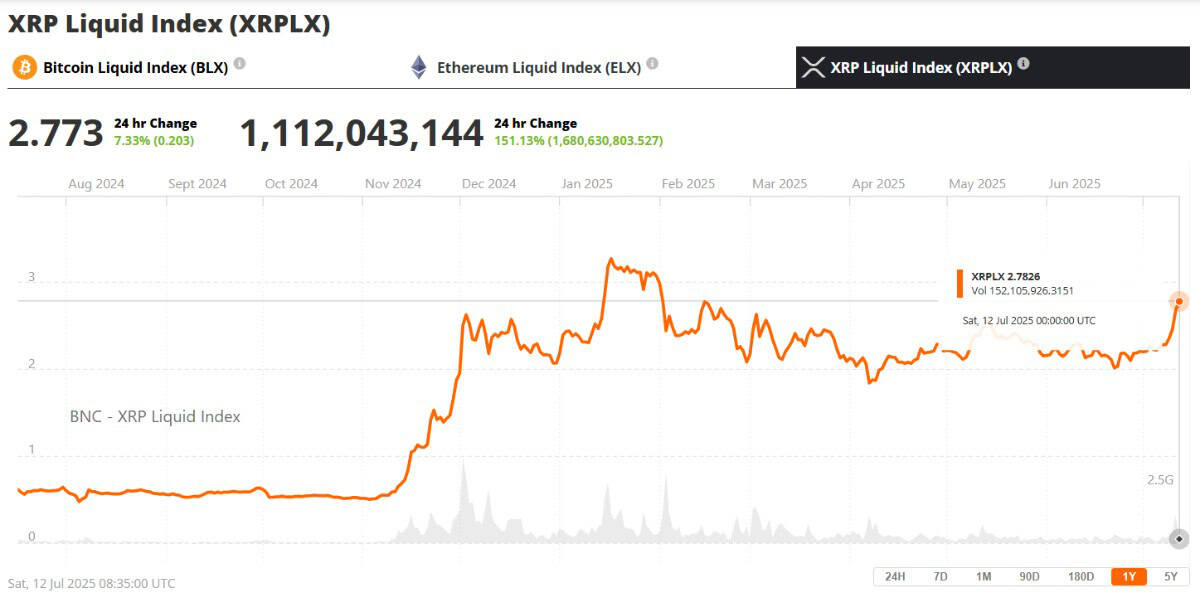
XRP price source: Brave New Coin XRP Liquid Index
XRP has already successfully broken above its key resistance at $2.66 and is pushing towards $3.00, after which price could enter a phase of discovery and reach new highs (its previous all time high was $3.84 in January 2018).
While nothing is ever certain in crypto, the current data indicates that XRP may be preparing for another strong move in July or August. It’s a moment worth watching closely, especially for those looking to catch the next rally.
The crypto market keeps growing today, according to CoinStats.CoinStats”>
The rate of Bitcoin ![]() BTCUSD has risen by 6.44% since yesterday.TradingView”>
BTCUSD has risen by 6.44% since yesterday.TradingView”>
On the hourly chart, the price of the main crypto is near the formed resistance of $118,839. As there are no levels ahead, there are good chances of seeing ongoing growth.TradingView”>
On the longer time frame, the rate of BTC keeps rising after breaking the $112,000 level.
If the candle closes around the current prices, traders may witness a test of the $120,000 range soon.TradingView”>
From the midterm point of view, bulls are controlling the situation on the market. Until the rate is above the $112,000 mark, there is a high chance of seeing a new all-time high from BTC shortly.
Bitcoin is trading at $118,196 at press time.
Peter Zhang
Jul 12, 2025 03:13
Polygon (MATIC) solidifies its enterprise blockchain leadership with major partnerships, technical upgrades, and NFT dominance. Discover how these developments could shape its price trajectory in 2…
Polygon (MATIC), now transitioning to POL, continues to make headlines with its strategic corporate partnerships, technical upgrades, and growing adoption in Web3. Despite market volatility, Polygon’s recent developments, including its Aggregate Layer v0.2 testnet and rising NFT sales, have positioned it as a strong contender in the crypto space. This article delves into the latest news, technical analysis, and future price projections for MATIC/POL, offering actionable insights for investors.
a) Enterprise Partnerships (July 11, 2025)
Polygon has forged strategic alliances with major corporations, including Starbucks, Reddit, Meta, Nike, and Disney Metaverse, to drive enterprise blockchain adoption. Collaborations with Google Cloud and Franklin Templeton further strengthen its position in the Web3 ecosystem, boosting operational efficiency and user engagement. This influx of partnerships signals institutional confidence in Polygon’s technology, potentially driving long-term demand for its POL token.
Impact: Positive. These partnerships enhance Polygon’s credibility and utility, reinforcing it as a go-to blockchain solution for enterprises.
b) NFT Market Dominance (July 4, 2025)
Polygon surpassed Ethereum in weekly NFT sales, reaching $24 million—a 52% increase. This growth is largely tied to platforms like Courtyard, demonstrating Polygon’s strength in NFT ecosystems. However, despite this milestone, MATIC’s price has seen significant declines this year.
Impact: Neutral. While NFT growth showcases Polygon’s ecosystem strength, price action remains subdued.
c) Migration to POL and Technical Innovations (July 6, 2025)
The migration from MATIC to POL is nearing completion (85% done), bringing enhanced token utility and economic improvements. The rollout of Aggregate Layer v0.2 testnet introduces cross-chain interoperability, a critical feature for blockchain scalability. These developments coincide with a 12% rise in transaction volume and a 30% surge in developer activity.
Impact: Positive. These technical upgrades position Polygon as a leader in blockchain interoperability, likely driving future adoption and price growth.
d) Market Performance (July 8-9, 2025)
MATIC’s price showed a slight recovery, trading at $0.192734 on July 9. Technical indicators like the RSI suggest oversold conditions, while the MACD reflects bearish momentum. Analysts offer mixed forecasts, with some predicting a rise to $0.89 by year-end.
Impact: Neutral. While bearish trends dominate, the potential for recovery remains strong based on technical signals and project developments.
As of July 12, 2025, MATIC/POL shows mixed signals:
Key Levels:
– Resistance 1 & 2: $0.58
– Support 1: $0.35
– Support 2: $0.33
The trend remains weakly bullish, although bearish momentum persists.
Short-Term Strategy:
With RSI nearing oversold levels and the price testing lower Bollinger Bands, short-term traders might consider entering positions near $0.35, targeting resistance at $0.58.
Long-Term Strategy:
Investors should monitor the POL migration and adoption of Aggregate Layer v0.2. Accumulating at current levels could yield significant returns if institutional partnerships and technical upgrades drive adoption.
Risk Management:
Utilize stop-loss orders around $0.33 to mitigate downside risks, given the bearish market conditions.
Short-Term (Q3 2025):
MATIC/POL is likely to trade between $0.35 and $0.58, with a potential breakout if bullish momentum builds.
Year-End 2025:
Analysts suggest a price target of $0.89, driven by institutional adoption, technical upgrades, and higher transaction volumes.
Long-Term:
Polygon’s enterprise partnerships and cross-chain capabilities position it for a potential revisit of its $3 all-time high in the next 2-3 years.
Despite its strong fundamentals, Polygon faces several risks:
Investors must weigh these risks against the project’s potential for long-term growth.
Polygon (MATIC/POL) is at a pivotal moment, driven by strategic partnerships, technical advancements, and growing adoption in NFTs and enterprise blockchain. While technical indicators suggest mixed short-term trends, the project’s fundamentals remain strong, offering significant upside potential for long-term investors. As the POL migration nears completion and enterprise adoption grows, Polygon is well-positioned to emerge as a leader in the decentralized ecosystem.
Image source: Shutterstock


: Key Partnerships, Technical Advances, and Price Predictions for 2025")