The main category of Crypto News.
You can use the search box below to find what you need.
[wd_asp id=1]
The main category of Crypto News.
You can use the search box below to find what you need.
[wd_asp id=1]
Ethereum (ETH) price has been quietly rebuilding strength after weeks of sideways movement, leaving traders wondering if a major breakout is around the corner. With the price hovering above $2,600 and key technical signals flashing early bullish signs, all eyes are on whether ETH price can push above its next resistance and reclaim the $3,000 level soon. In this article, we break down Ethereum price daily chart, examine support and resistance levels, study the momentum indicators, and run a few quick calculations to predict where ETH could be headed next. If you’re watching ETH price closely, this analysis will help you understand what comes next for the world’s second-largest cryptocurrency.
Looking at the daily chart you shared, Ethereum (ETH) price is trading around $2,620–$2,623 with a steady upward bias. The Heikin Ashi candles show a period of consolidation above $2,500, forming a tight range with slightly higher lows — a sign that buyers are slowly regaining control.
The Relative Strength Index (RSI) sits at 59.9, just shy of the crucial 60 mark that often precedes a stronger push. It means ETH price is not overbought yet — there’s room for a continuation. The RSI is also comfortably above its moving average (around 52), showing upward momentum is building again.
The chart highlights Fibonacci extension levels, which show clear upside targets. The visible Fibonacci grid suggests a key short-term resistance near $2,750–$2,800, with the next levels around $3,000 and $3,200.
Given the previous bounce from the May lows, the rally leg was about $2,000 to $2,900 — a move of $900. If we take the recent low near $2,400 and add a similar swing, a measured move target comes to:
$2,400 + $900 = $3,300
This aligns well with the Fibonacci cluster you marked above $3,200. It suggests that if Ethereum price breaks above $2,750 with volume, a move towards $3,200–$3,300 is technically realistic.
On the downside, the chart shows ETH price has repeatedly defended the $2,400–$2,500 region. This has now formed a solid base. Multiple tests without breakdown imply that whales are likely accumulating below $2,500.
As long as Ethereum price stays above this floor, the short-term risk remains limited. If price dips back to this zone, it may act as a springboard for bulls to push higher again.
The RSI reading near 60 is promising. Typically, for ETH price, when the RSI crosses 60 on the daily, it signals the start of a momentum phase that can last a few weeks. For example, the big rally earlier this year started when RSI went from 45 to 65, and price surged nearly 40%.
Using a similar percentage, a 40% move from the recent swing low ($2,400) could target:
$2,400 + (0.40 × $2,400) = $2,400 + $960 = $3,360
Again, this matches the measured move and the upper Fibonacci zone.
Based on the price structure, support zone, and RSI momentum, Ethereum price looks ready to test $2,750–$2,800 soon. If bulls manage to break and close above $2,800 on strong daily volume, the next logical leg is toward $3,200–$3,300.
If the market stalls or Bitcoin pulls back, ETH price could retest $2,500–$2,550 as support. But unless that level is lost with heavy selling, the bias stays bullish.
Ethereum price daily chart shows it is quietly building strength for a fresh breakout. With RSI momentum intact, a strong support base, and clear Fibonacci targets, traders should watch the $2,750–$2,800 level like a hawk. A breakout above that could unlock the path to $3,200–$3,300 in the coming weeks — giving bulls nearly a 20–25% upside from current levels. For now, the trend remains constructive — but always keep an eye on Bitcoin for confirmation. If BTC stays stable, ETH price next move could surprise on the upside.
OKX is a top choice to buy ETH. With low trading fees, extensive token listings, and an intuitive interface, it’s a preferred platform for many crypto traders across Europe.
Special Promotion – Limited Time
Until September 14, 2025, OKX is hosting an exclusive McLaren F1 Team giveaway:
–> Receive a complimentary McLaren F1 Team cap<–
Enter to win a VIP trackside experience in Zandvoort (Aug 29–31)
This offer is open to all new European users who haven’t yet traded on OKX. Don’t wait – claim your reward today!
$ETH, $Ethereum, $ETHPrice, $EthereumPrice
After breaking out of a multi-week compression channel, Dogecoin price rallied sharply toward the $0.185 zone. This area had previously acted as a key supply region throughout June, and the latest push has once again triggered selling pressure. As of writing, Dogecoin price today is hovering near $0.181 with signs of slowing momentum as bulls pause below a trend-defining resistance zone.
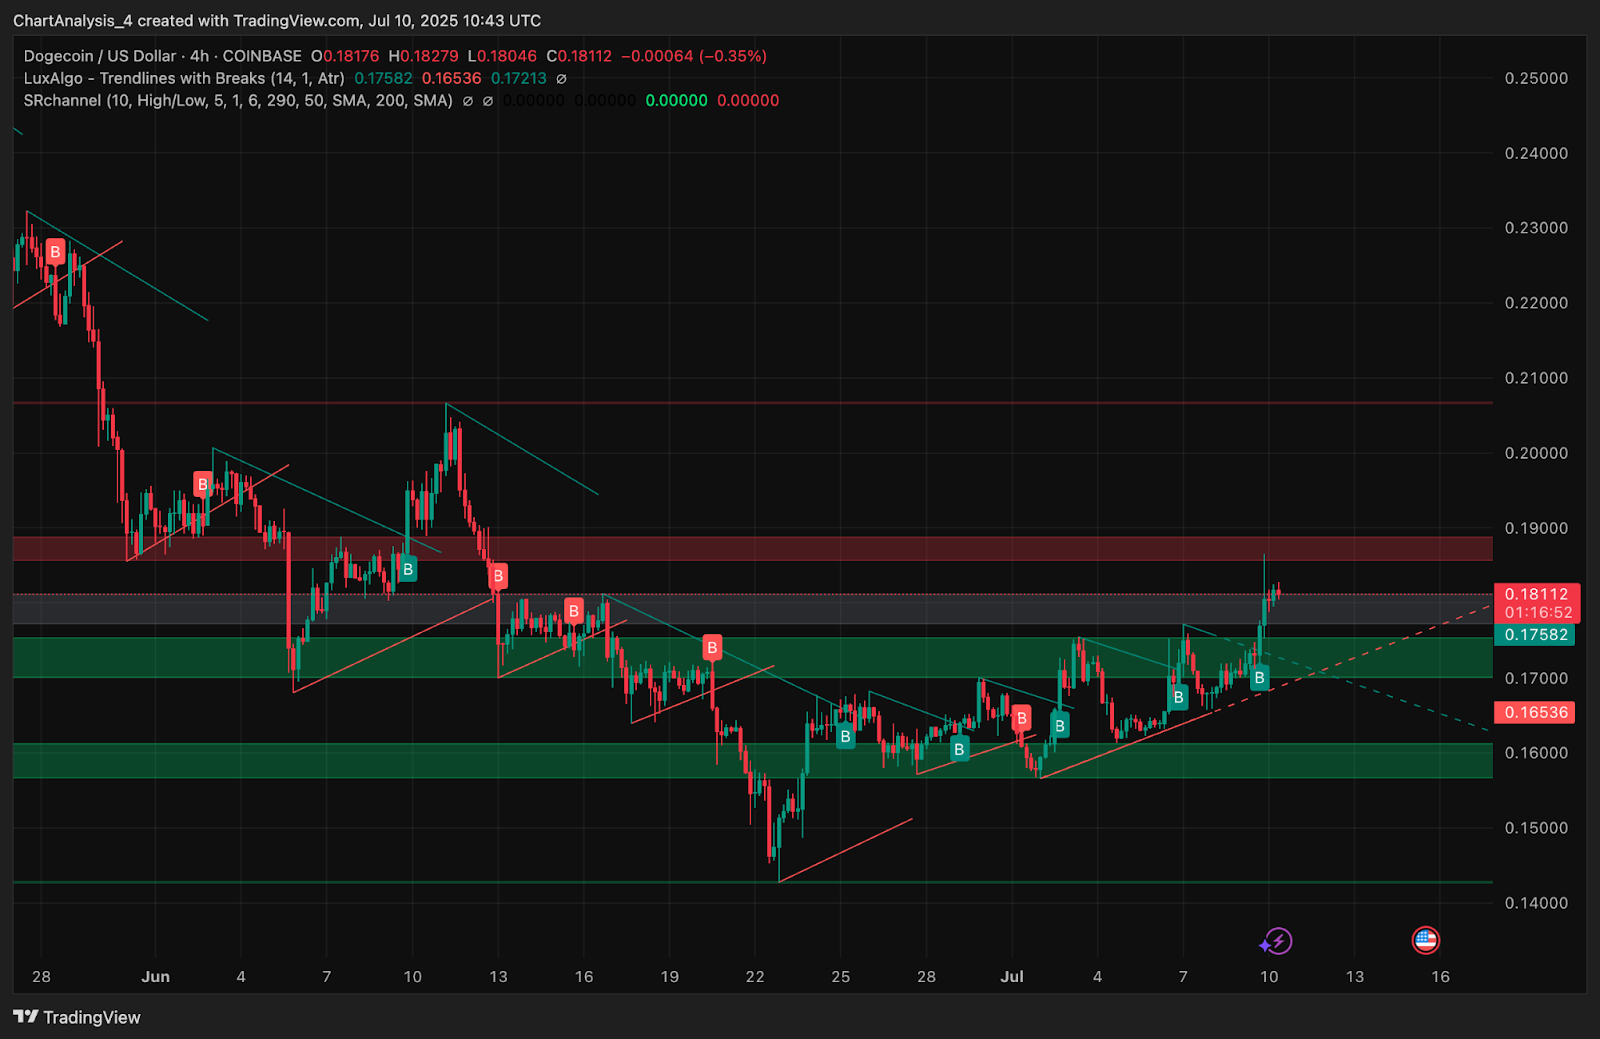
The broader structure on the 4-hour chart shows DOGE breaking out from a descending wedge pattern that extended from mid-June to early July. Price climbed through the $0.172 resistance and surged into the $0.182–$0.185 supply band before stalling. This region aligns with the R4 pivot level and previously marked a rejection area in late June.
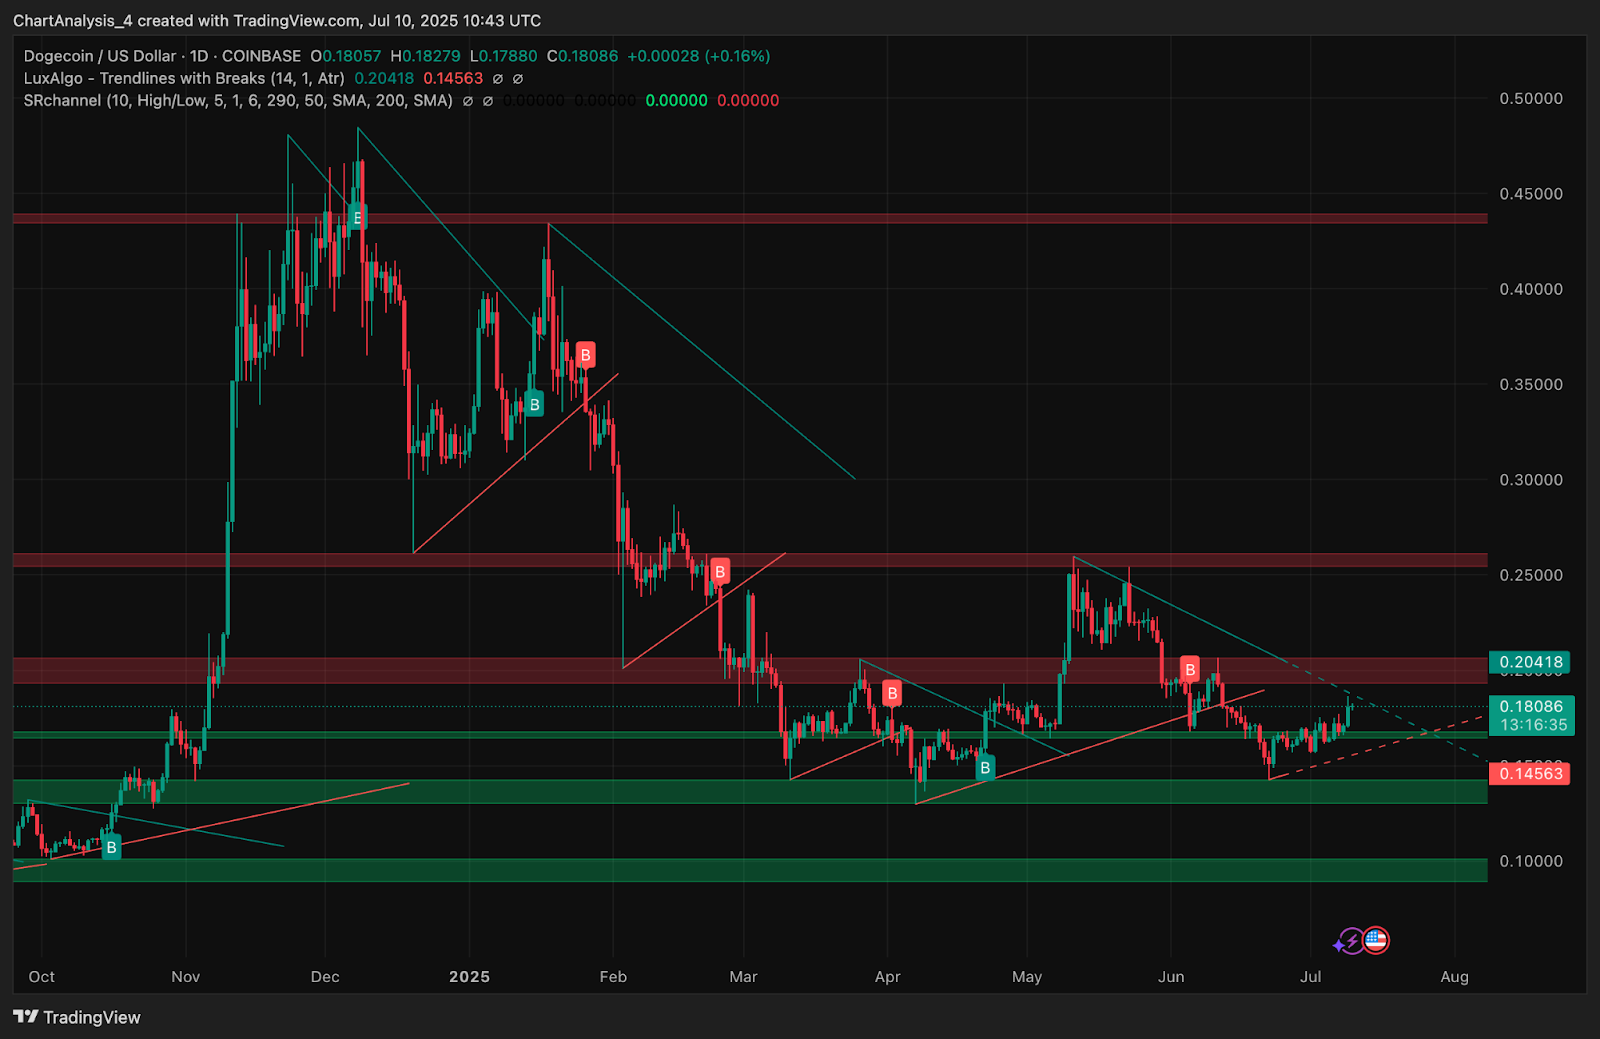
Support has now been established at $0.1758, where demand has responded strongly in recent sessions. Trendline support also extends from the July 5 swing low, reinforcing the bullish trend. On the daily chart, DOGE is challenging a macro downtrend line stretching back to April, a breakout from which could defi…
The post Dogecoin (DOGE) Price Prediction for July 11 appeared first on Coin Edition.
Cardano (ADA) is one of the most promising cryptocurrencies on the market today. The asset has rallied 69% in the past year, and in the past week alone is up nearly 10%. Analysts are riding on expectations that the ADA coin will continue this climb and eventually reach $1, although the timeline remains a mixed projection.
Cardano’s recent climb is fueled by a wave of liquidations, with $2.98 million in short positions being wiped out, from a total 24-h liquidation of $3.40 million. Additionally, the entire crypto market is riding the Bitcoin wave, as the king coin has reached a new ATH of $113,000 on Thursday. Furthermore, ADA has seen strong backing from institutional investors. With Donald Trump including ADA in its crypto reserve, chances are that the token may continue to pick up pace.
If this buying momentum persists, Cardano may soon test its immediate resistance level near $0.70. Several crypto analysts are even speculating that it could retest the $1 mark by the end of July, although that would be a very bullish move. A spark that could cause this, according to Flitpay, could be the approval of select spot ADA ETFs by the SEC. “We might also witness the launch of Cardano (ADA) ETFs this year because the US SEC acknowledged various applications, including Grayscale’s Spot Cardano ETF and Canary ADA Spot ETF, in February 2025,” the analysts say. “Once approved, this ETF will track the ADA price daily based on data from various cryptocurrency exchanges.”
Also Read: These 2 Cryptocurrency Coins Will Explode When Retail Hits: Analyst
Analysts at CoinCodex have given their own forecast for ADA over the next two months, accounting for the rebounding market and other bullish factors. The analysts write, “According to our current Cardano price prediction, the price of Cardano is predicted to rise by 25.73% and reach $ 0.788964 by August 8, 2025. Per our technical indicators, the current sentiment is Neutral while the Fear & Greed Index is showing 71 (Greed).” The CoinCodex forecast doesn’t see ADA reaching the $1 mark again until 2026, with the asset seeing $0.97 as a 2025 resistance level.
Beyond this year, a new and revised price target for Cardano’s ADA indicates a 550% surge in price with a target of $3.85. The Finder’s panel of financial experts predicts that ADA could reach a high of $3.85 five years down the line. The forecast indicates that Cardano could rise by 550% by 2030 and deliver major profits to investors by the end of the decade. If Cardano ADA reaches $3.85 in 2030, it would breach its all-time high of $3.09, which it reached in September 2021.
Disclaimer: This is a Press Release provided by a third party who is responsible for the content. Please conduct your own research before taking any action based on the content.
XRP price prediction is pouring in high numbers lately as the market buzzes with anticipation for the XRP ETF approval. With the SEC setting late 2025 for a response on the final XRP ETF approval, how high can the price go, as optimism fills the market?
Analysts speculate a surge as high as $5 while citing a rise in institutional interest and market demand. Meanwhile, the Remittix $RTX token is also fast picking up pace as the top crypto presale this year, using strong utility to fuel a price surge.
Here is a breakdown of this unfolding market update and how investors can position their portfolio to gain from the rising Remittix popularity and post-ETF XRP price prediction.
While all eyes are on the XRP ETF approval as a primary catalyst for its price surge in the second half of 2025, whale accumulation and on-chain progress are other factors experts believe could play significant roles.
The recent whale accumulation of about 900M XRP is the first signal ushering in a bull sentiment over the last few weeks, with the whale’s move returning confidence to the market. However, there hasn’t been much progress since the whale accumulation. Experts’ analysis suggests this could be a good place to start as other institutional traders return to the market.
The Ripple ETF approval currently has a 95% completion rate, raising optimism and expert analysis. According to the expert outlook, XRP price prediction of $5 could be a starting point when the ETF approval is finally completed.

The XRP price prediction has increased since the first half of the year when the SEC dropped its appeal against Ripple, returning market confidence and bullish sentiment. However, technical analysis suggests a need to clearly cross the $2.60 range before the XRP price prediction becomes a reality.
With a rising number of crypto presales currently flooding the market, Remittix is becoming the top option for many who are now discovering the high profit potential of this token. Remittix stands out from the crowd with a PayFi solution that combines it with top payment asset projects like XRP.
This is because of its approach to solving the crypto traders’ pain point, allowing fast and cheaper cross-border payments to bank accounts. Remittix’s revolutionary approach is why some analysts call it the XRP 2.0, because it refines XRP solutions, offering users more.
The high rising acceptance and support from crypto traders now suggest it could be the best crypto presale this year, with $16M raised already nearing its soft cap. Experts project a bullish breakout for the Remittix token this year as whales and institutional traders’ adoption continue rising.
Website: https://remittix.io/
Socials: https://linktr.ee/remittix
Disclaimer: This media platform provides the content of this article on an “as-is” basis, without any warranties or representations of any kind, express or implied. We assume no responsibility for any inaccuracies, errors, or omissions. We do not assume any responsibility or liability for the accuracy, content, images, videos, licenses, completeness, legality, or reliability of the information presented herein. Any concerns, complaints, or copyright issues related to this article should be directed to the content provider mentioned above.
/div>

With over 6.6 million wallet addresses, growing trading volume, and whispers of a potential XRP ETF approval, all signs point toward what some are calling the “perfect storm” for Ripple’s biggest rally yet.
XRP has officially broken out of a “falling wedge” — a bullish technical pattern that often signals a trend reversal. This breakout has been backed by a significant rise in trading volume, surging from about $2.5 billion to $4.5 billion in just one day.
Even more telling? Ripple recently moved 477 million XRP into an unknown wallet. Big transfers like this often signal either major institutional activity or preparations for larger strategic moves.
Technical analysts now see XRP’s next resistance at around $2.60, and if the bulls hold momentum, it could push further toward $3 in the coming months.
There’s been a lot of buzz around XRP crossing 6.6 million wallet addresses, but it’s worth understanding what that number really means. Yes, there are 6.6 million XRP wallets on the blockchain. But that doesn’t mean 6.6 million active users. In reality, many of those wallets are inactive, duplicates, or simply cold storage. According to crypto analysts, the number of unique, active XRP holders is likely under 1 million. Still, the rise in wallets does show increasing interest — and the whales are definitely paying attention.
Here’s where things get really interesting. On-chain data shows that more than 2,742 wallets now hold over 1 million XRP each. These large wallets control nearly 47.3 billion XRP — that’s almost half of the total supply.
Whale accumulation like this usually happens before major price runs. It signals long-term confidence and positions being built for the next leg up.
The biggest wildcard in XRP’s future is the potential launch of spot XRP ETFs.
The U.S. SEC recently streamlined its approval process for crypto ETFs, cutting review time from 240 days to as little as 75 days. While futures-based XRP ETFs are already set to launch between July 14–25, the crypto world is waiting for that final green light on spot XRP ETFs — which are much more impactful.
Crypto market experts are already placing high odds (up to 98%) on XRP spot ETF approvals happening before the end of 2025.
If this happens, it could flood the market with new institutional money, significantly boosting XRP’s price and market credibility.
If momentum continues and XRP clears the $2.60–$2.65 resistance zone, analysts say it could easily reach $3 by August.
With a successful ETF approval and increased whale activity, XRP could target $3.50–$4 by Q4 2025, especially if the broader crypto market remains bullish.
Indicators like RSI (around 66) and MACD also suggest there’s still room for upside before XRP becomes overbought.
It just might be.
Here’s why:
| Bullish Factor | Why It Matters |
| Breakout above wedge | Strong technical signal for a rally |
| Whale accumulation | Institutional confidence increasing |
| 6.6M wallet addresses | Rising interest and awareness |
| XRP ETF potential | Major catalyst for mainstream adoption |
| Volume surge | Suggests growing buyer strength |
Together, these trends are creating what analysts call a “perfect storm” scenario for XRP. While nothing in crypto is ever guaranteed, XRP’s current setup looks more promising than it has in months — or even years.
If you’ve been waiting for XRP to wake up, now might be the time to watch closely. Between strong technical signals, ETF buzz, and growing whale activity, the next few months could define XRP’s future.
Just remember: crypto is still volatile. Always do your own research, and don’t chase green candles blindly. But if the current trends continue, XRP might just be on its way to its biggest rally ever.
Q1: What is the latest XRP price prediction for 2025?
XRP could hit $3–$4 in 2025 if ETF news and whale buying continue.
Q2: Why are XRP holders excited about ETFs?
Because spot XRP ETFs could bring big institutional money and boost prices.

Solana Price Prediction is in focus after SOL traded near $154 support on July 9, as on-chain data revealed that top holders have been hedging against wider market risks in recent days. This buildup at the $154 mark comes as whales moved large stakes and institutional traders adjusted positions ahead of macro updates and tariff talks from the U.S. administration.
Investors are also watching the hype around Pump.fun’s native PUMP token sale, which could siphon off speculative capital from SOL as participants chase quick memecoin gains. Meanwhile, a new contender in the blockchain space is gearing up for its own launch in Q3, with a wallet reveal that hints at strong community backing.
Solana Price Prediction models from experts like Ali Charts on X (formerly Twitter), suggest that if SOL sustains support at $147.59, it may rebound toward the next resistance zone near $170. Currently, SOL trades at around $154.55, up modestly from its low of $147, reflecting a 1.5% gain over 24 hours amid a broader crypto market uptick.

On-chain data shows three whale transfers of roughly 3 million SOL each in the past 48 hours, indicating that major holders are positioning for a potential recovery amid favorable Solana price predictions. At the same time, analysts in their Solana price predictions point out that SOL remains in a symmetrical triangle on the 4-hour chart, with a breakout to the upside likely to target the $180 mark in the medium term.
Pump.fun’s PUMP token sale is set to launch on July 12, offering 150 billion tokens at $0.004 each, representing 15% of the 1 trillion supply. Bybit will host the primary sale, but European users will be barred due to MiCA compliance, and Gate.io’s brief leak of a $600 million sale page has created confusion around the distribution details.
Despite the uncertainty, memecoin traders are flocking to PowerTrade’s options platforms, with bullish call flows on altcoins including SOL and PUMP, reflecting a risk-on mood in the short term. The impending sale could absorb up to $600 million in liquidity, potentially at the expense of SOL spot volume as speculative funds chase quick gains in the memecoin sector.
Remittix introduces a fresh approach to blockchain payments, blending real-time cross-border transfers with staking incentives in a unified network that rewards both remitters and nodes. Its tokenomics include a deflationary mechanism and gas-fee rebates that set it apart from traditional Layer-1 projects.
The Remittix wallet revealed earlier this month showcased a sleek interface and support for multi-asset holdings, underscoring the team’s focus on user experience. This early glimpse has already driven strong interest among retail and institutional backers ahead of the planned Q3 launch.
Capital raised has topped $16 million, nearing the $18 million softcap target. The project is sweetening the deal with a 50% token bonus for early participants, creating an incentive to commit now rather than wait for later stages.
Ready to join a project that blends real-time payments and DeFi rewards? Secure your RTX tokens at today’s price of $0.0811 and claim the 50% bonus before the softcap is reached.
Don’t miss out on a Q3 launch that promises innovation in blockchain remittances and a community-driven growth model. Head to the Remittix page now to reserve your tokens and become part of the best crypto presale to buy now.
Discover the future of PayFi with Remittix by checking out their presale here:
Website: https://remittix.io/
Socials: https://linktr.ee/remittix
This content is brought to you by the FingerLakes1.com Team. Support our mission by visiting www.patreon.com/fl1 or learn how you send us your local content here.
A familiar pattern is emerging on XRP charts, and analysts are starting to take notice.
The current setup for XRP price is drawing strong comparisons to the bullish run of 2017, sparking renewed optimism among traders.
With technical indicators flashing strength and historical patterns aligning, some are beginning to wonder: Could XRP be on the verge of a massive breakout to $5?
XRP price today is holding firm above the $2.40 level, signaling bullish momentum after a strong rebound. The coin surged past key resistance at $2.32 and continued to rally toward the $2.45 mark, outperforming Bitcoin and Ethereum during the recent uptick.
At the time of writing, XRP is consolidating gains at around $2.42, trading above its 100-hourly Simple Moving Average. A bullish trendline has formed, providing solid support near the $2.38 level.
XRP was trading at around $2.42, up 4.5% in the last 24 hours at press time. Source: XRP Liquid Index (XRPLX) via Brave New Coin
Technical analysts note that XRP today is facing minor resistance near $2.45. A confirmed breakout above this level could open the door to $2.50 and $2.60. In a more extended rally, targets of $2.75 or higher remain in play if market sentiment remains supportive.
If, however, XRP fails to maintain momentum, support can be found at $2.38 and $2.35. A drop below those levels could pull the coin back to $2.32 or even test lower zones around $2.26.
Beyond the immediate technicals, a larger narrative is taking shape. According to a widely shared chart from crypto analyst “Charting Guy,” XRP’s current price structure appears to be replicating its 2017–2018 cycle—a time when XRP skyrocketed to an all-time high of $3.40.

The XRP/BTC 2017 fractal is closely aligning in timing, direction, and structure, matching past December and January highs to the exact day. Source: Charting Guy via X
The overlay of XRP’s historical price action shows striking similarities, particularly in the timing of rallies and corrections. Recent price peaks in December and January closely mirror the highs of late 2017 and early 2018. This resemblance has fueled discussions about XRP price predictions across the cryptocurrency community, particularly given the coin’s year-over-year gain of over 435%.
While the 2018 market was followed by a steep correction, analysts argue that the present day offers a different backdrop. Unlike five years ago, institutional interest, broader crypto adoption, and Ripple’s global business expansion provide a more supportive environment for sustained growth.
From a technical standpoint, indicators are favoring further gains. XRP’s Relative Strength Index (RSI) has climbed above 60, suggesting building momentum. Meanwhile, the Moving Average Convergence Divergence (MACD) has flipped bullish for the first time since May.
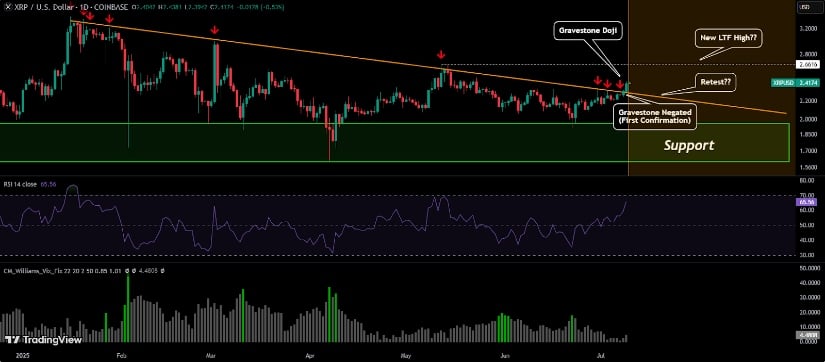
XRP negated the gravestone doji with a bullish candle, and a breakout now hinges on either a trendline retest or a push above $2.65. Source: VIAQUANT on TradingView
The break above a six-month-long pennant pattern also reinforces the case for a continued rally. Chart watchers believe the XRP coin price could retest the $2.50 level in the short term. If the bullish structure holds, $3 may be within reach by Q4.
Adding to the bullish outlook is anticipation surrounding potential ETF approvals. If XRP ETFs are approved later this year, market participants believe it could fuel a fresh wave of institutional capital, possibly pushing the XRP crypto price prediction toward $3.50 and beyond.
Of course, not everything hinges on chart patterns. The Ripple vs SEC lawsuit continues to cast a shadow over the asset’s long-term valuation. While much of the legal uncertainty has been priced in, a definitive court ruling or settlement would be far-reaching in terms of having an impact on market sentiment.
A resolution on the XRP lawsuit or movement on the ongoing SEC Ripple case—specifically, whether what Ripple does is governed by securities laws—is still among the most important drivers for investors.
Still, the worst of regulatory headwinds is now behind us, most believe. With Ripple expanding its payment network and the XRP Ledger supporting new applications, long-term prospects are firm.
The XRP price prediction 2025 is between $3.50 and $5.00, pending overall market forces, updates on regulation, and ETFs.
For the XRP price in 2030, other long-term bulls anticipate valuations above $10 through more intensive token use, cross-border payment utilization, and possible IPO news on Ripple Labs.
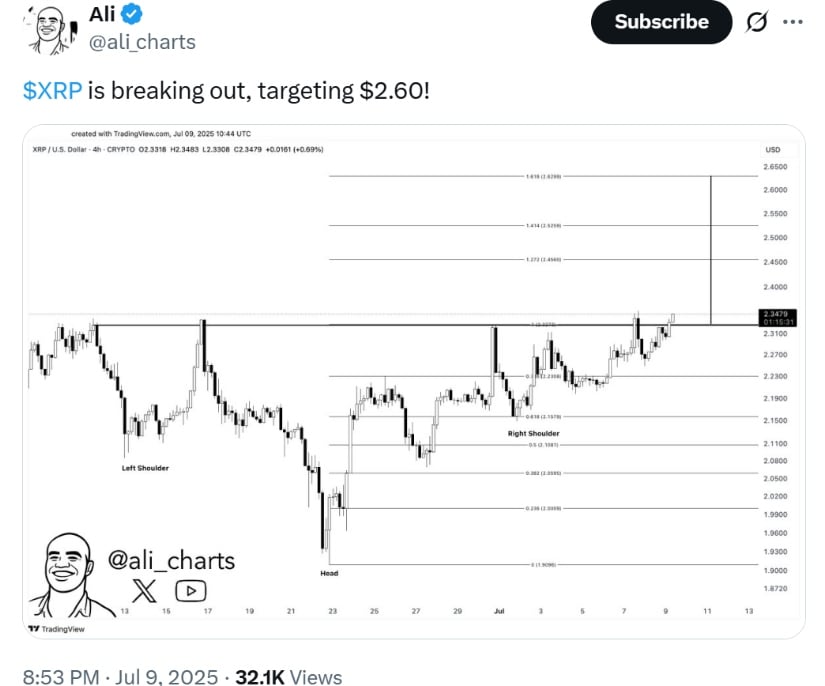
XRP is initiating a breakout with a near-term target of $2.60. Source: Ali Martinez via X
These long-term expectations are still optimistic, yet for the short term, it is more defined: prices of XRP are gaining strength, technical signals are aligned, and the whispers of 2017 are getting louder.
The market will never repeat itself exactly, but rather it rhymes. If XRP is still riding its 2017 path, then it could be on the cusp of something historic. As long as regulatory uncertainties persist, a positive macro backdrop and growing investor confidence can help XRP chart its course toward $5—sooner than most anticipated.
Tune in for more XRP updates today and news on the XRP court case and ETF developments that can map out the future of this high-performing altcoin.
We strive to uphold the highest ethical standards in all of our reporting and coverage. We StartupNews.fyi want to be transparent with our readers about any potential conflicts of interest that may arise in our work. It’s possible that some of the investors we feature may have connections to other businesses, including competitors or companies we write about. However, we want to assure our readers that this will not have any impact on the integrity or impartiality of our reporting. We are committed to delivering accurate, unbiased news and information to our audience, and we will continue to uphold our ethics and principles in all of our work. Thank you for your trust and support.
Website Upgradation is going on for any glitch kindly connect at office@startupnews.fyi
Bitcoin (BTC) price has soared past $112,000 for the first time, setting a fresh all-time high (ATH) this week, while Ethereum (ETH) jumped 7% to $2,790 and major altcoins posted significant gains.
This comprehensive analysis examines the key factors driving the current crypto price surge across Bitcoin, Ethereum, XRP, and Dogecoin (DOGE) markets. I am answering the question why is crypto going up today and checking what technical analysis tells about the BTC/USDT, ETH/USDT, XRP/USDT and DOGE/USDT charts.
Why Is Crypto Going Up Today? Major Cryptocurrency Performance Breakdown
Bitcoin Price Surge to Record Territory
Bitcoin price action has been particularly impressive, with the cryptocurrency breaking through the $110,000 resistance level that had capped gains for weeks. On Thursday, Bitcoin’s price experienced a slight correction, dropping by 0.3% to $110,969.
Bitcoin remains below its all-time high set in May. Source: Tradingview.com
The chart above indicates that despite reaching a new all-time high, technically nothing significant has changed. Only a breakout above $112,000 would pave the way for a further upward move. Currently, however, the price could equally correct more sharply and return to the psychological level of $100,000, marking the boundary of the current consolidation.Paul Howard, Wincent
Paul Howard from Wincent also provides technical insight into the breakthrough: “The move in BTC prices +2.2% the last 24 hours is not particularly noteworthy in itself, but made interesting because it sets a new ATH for the asset. This was led by some ETF purchasing overnight and with the low volatility environment the last 2 months finally breaching $110k.”
Howard expects Bitcoin to continue trading around the $110k level +/-2% for the short term, based on options market positioning. The breakthrough came after Bitcoin’s volatility declined significantly, a pattern that historically precedes major upward moves.
Ethereum Rally Leads Altcoin Performance
Looking at the chart and Ethereum’s recent performance, we can see that on Wednesday the price rose by nearly 6%, closing the day at $2,589. On Thursday, it set an intraday high of $2,823, testing the highest levels in over a month. At the time of writing, Ethereum is up 0.6%, trading at $2,786.
From a technical analysis standpoint, Ethereum, much like Bitcoin, remains in a consolidation phase. The upper boundary of this range is defined by local highs from May and June, while the lower boundary corresponds to temporary lows from February, retested in the second half of last month below the $2,200 level. Also technically significant is the $2,400 mark, which has served as local support in recent weeks.
Ethereum price has emerged as a standout performer, with Howard noting the “6% pump on ETH and alts” as particularly significant. The Ethereum rally reflects a broader shift as “alts look set to catch the tail wind from ETH’s ascension as the newest treasury play.”
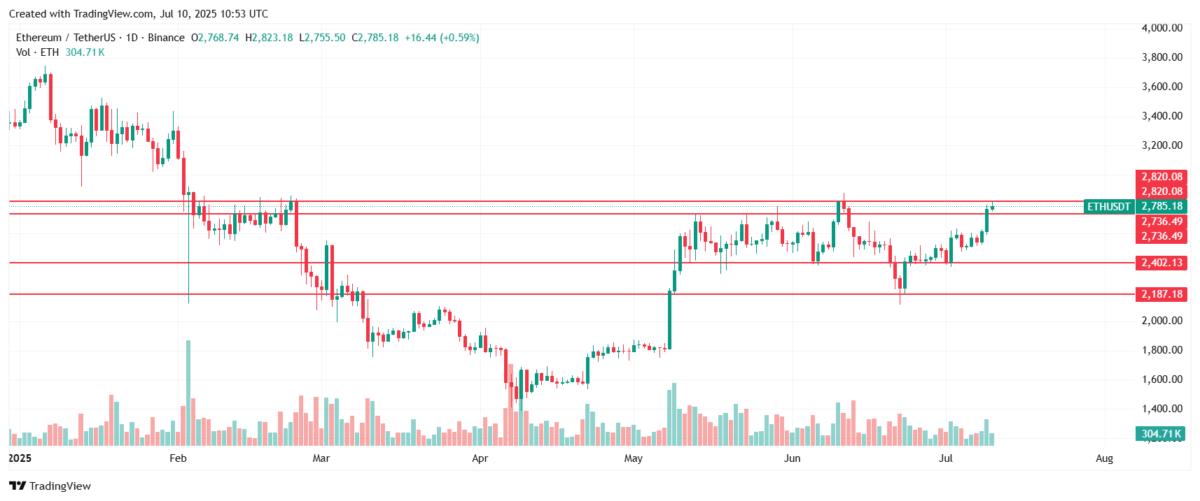
Current Ethereum price today: Source: TradingView.com
The surge was amplified by forced liquidations as “long term leveraged ETH shorts were wiped out overnight forcing liquidations and a sudden pop,” creating a cascade effect that Howard believes looks sustainable given broader market conditions.
Digital asset manager Bitwise’s analysts identified ETH as one of the “cleanest” token plays for the tokenization trend, while long-only institutions are betting on Ethereum’s future role in asset tokenization.
You may also like: Ethereum (ETH) Price Prediction: Why the Ethereum Price Is Going Up and Where the ETH Price Is Set to Go
XRP Price Momentum Builds
According to my technical analysis, XRP is currently rising for the third consecutive session, testing its highest levels since May 23. On Thursday, July 10, 2025, the intraday high reached $2.458, while at the time of writing, the price is up 1.6%, trading at $2.44.
From the perspective of my technical analysis, a key development occurred as XRP broke through the downward trendline drawn from the beginning of 2025. This breakout opens the way for a potential retest and breakout of the local highs from May, between $2.60 and $2.67. Only then would I see a stronger case for bullish momentum, possibly pushing the price toward the $3.40 level, last tested over six months ago.
XRP price has gained significant traction, trading with weekly gains exceeding 7%. The XRP surge reflects broader altcoin outperformance, as the rally extends beyond Bitcoin to encompass major alternative cryptocurrencies benefiting from the Ethereum-led momentum.
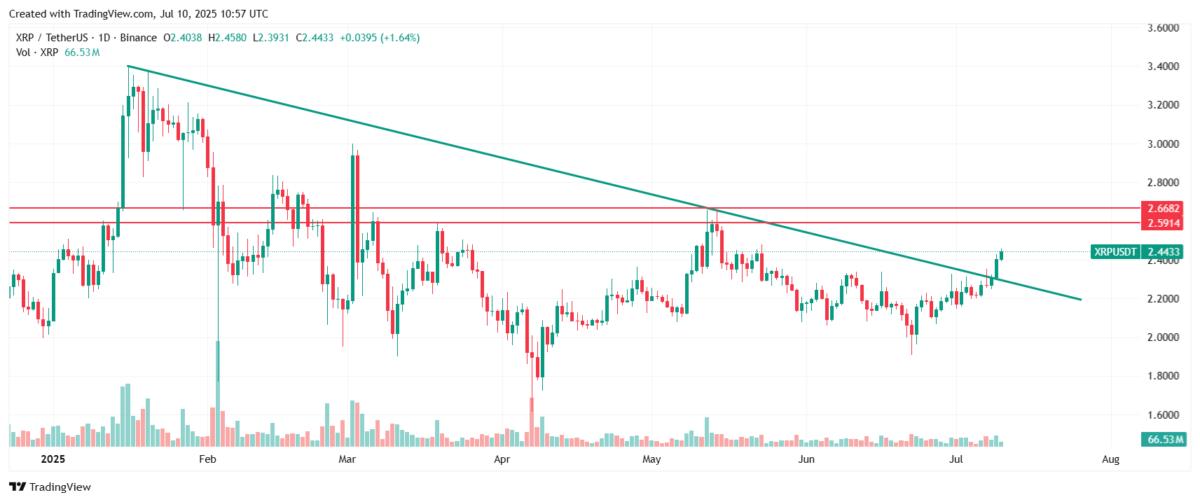
XRP technical analysis and price today. Source: Tradingview.com
Dogecoin Price Action Shows Technical Strength
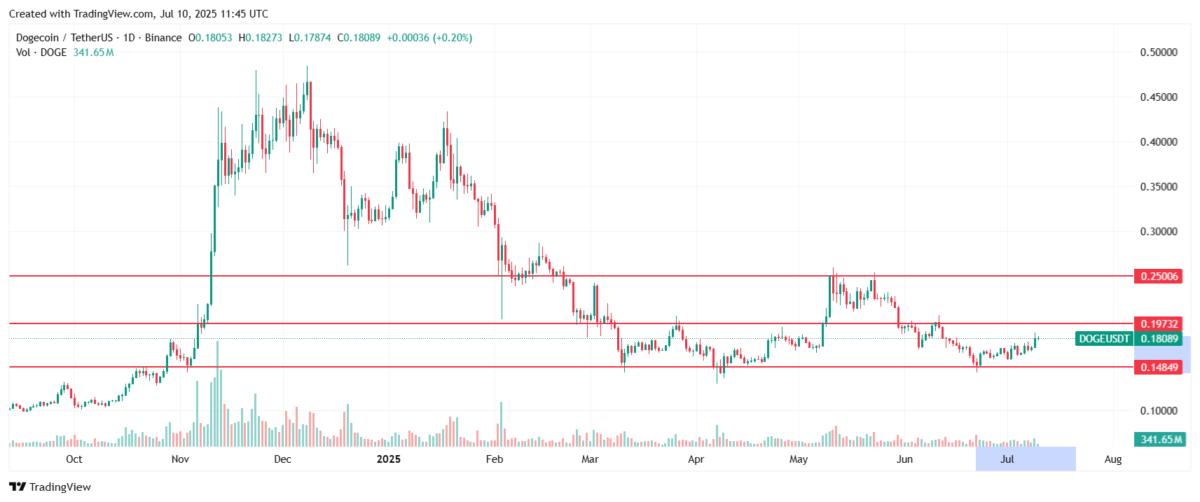
Dogecoin’s price surged strongly during Wednesday’s session, gaining nearly 6% and testing monthly highs. However, on Thursday, the meme cryptocurrency lost momentum and is currently up just under 0.5%, trading slightly above 18 cents.
Among the cryptocurrencies analyzed in this article, Dogecoin is currently performing the weakest, still moving close to its recent multi-month lows. That said, it has rebounded by around 30% from last month’s bottom and is once again approaching its psychological resistance level around 20 cents. A breakout above this threshold would signal a move into a higher trading range, with the upper boundary near 25 cents—May’s peak, which, for now, I consider a medium-term target for Dogecoin.
Dogecoin price demonstrated explosive movement with a 6% surge during recent trading sessions. Technical analysis reveals DOGE is forming potential bullish patterns, with institutional whale accumulation supporting continued upside momentum.
Why is XRP price rising today? Source: Tradingview.com
Related: Why Dogecoin Price Is Surging? Breaking News and Price Predictions for July 2025
Why Crypto Is Surging? Political Pressure Drives $15 Billion Bitcoin ETF Surge
The primary catalyst behind why crypto is rising stems from unprecedented political pressure on the Federal Reserve. Donald Trump’s aggressive campaign demanding Fed Chair Jerome Powell cut rates to 1% and resign has triggered massive institutional flows into Bitcoin ETFs.Markus Thielen, the CEO of 10x Research.
“The sharp surge in Bitcoin ETF inflows since late April 2025 has been primarily driven by political pressure on the Federal Reserve, with Donald Trump openly demanding that Chair Jerome Powell cut rates to 1% and resign,” explains Markus Thielen, founder of 10x Research.
Since mid-April, Bitcoin ETFs have accumulated $15 billion worth of Bitcoin, creating relentless buying pressure that’s forcing previously hesitant traders back into the market. This institutional demand has remained consistent even during Bitcoin’s consolidation phases, demonstrating the strength of underlying fundamentals driving the crypto market rally.
Industry Leaders Confirm Institutional Maturity
The breakthrough to new highs has drawn significant commentary from industry leaders who see this moment as a structural shift rather than mere speculation. Nick Jones, Founder and CEO of Zumo, emphasizes the fundamental change occurring in the market landscape.Nick Jones, Founder and CEO of Zumo
“With Bitcoin surging past $112,000 for the first time to set a fresh record high, the market is booming. The rise is underpinned by increasing institutional adoption and resurgent retail demand, reflecting confidence that crypto has arrived in the mainstream and is now reshaping finance,” Jones stated.
The institutional narrative extends beyond traditional finance into corporate treasury strategies. Jones highlighted growing corporate interest in Bitcoin as a treasury asset, with Emirates making headlines through its decision to integrate cryptocurrency payments into its operations.Ryan Chow, co-founder of BTCFi platform Solv Protocol
Ryan Chow, co-founder of BTCFi platform Solv Protocol with over $2 billion in total value locked, frames the current surge as a long-overdue recalibration from speculation to structural adoption. “What we’re seeing is a long-overdue recalibration from speculation to structural adoption as mandates are being rewritten around digital assets. Bitcoin’s new all-time high is a signal of growing institutional maturity and global confidence in crypto as an asset class,” Chow explained.
Regulatory Landscape Shapes Market Sentiment
The regulatory environment is becoming increasingly supportive of digital asset growth. Jones highlighted the critical importance of upcoming regulatory developments in the UK, noting that “all eyes in the UK will be on Rachel Reeves when the Chancellor takes to the stage at Mansion House on Tuesday to provide an update on the Financial Services Growth and Competitiveness Strategy.”
The demand for regulatory clarity is driven by growing retail adoption, with Jones citing FCA research showing “12% of UK adults now own crypto – these retail investors are looking for compliant propositions that offer a safer route to market.”
Howard points to upcoming legislative developments in the US, noting that “we await news in the coming week from the US administration on the STABLE and GENIUS bills, likely can expect prices grinding higher rather than any short term pullback.”
Liquidation Data Reveals Short Squeeze
The crypto price surge triggered the largest wave of liquidations since May, with over $460 million in short positions wiped out. More than 114,000 traders were liquidated, with $463 million coming from short positions compared to only $64 million from long positions.
This massive short squeeze created a cascade effect, with waves of liquidations accelerating price movements higher across major cryptocurrencies.
Onchain analysis firm Santiment identified a crucial pattern supporting the digital currency rise: retail trader-based wallets have been notably absent from the current move. This historically indicates prime conditions for sharp upside moves.
“When retail shows FUD (whether through fear or impatience), these are usually prime spots for smart money to move in and accumulate. This time has been no different,” Santiment noted.
Frequently Asked Questions, FAQs
Why is crypto going up so fast?
The rapid crypto surge is driven by $15 billion in Bitcoin ETF inflows, political pressure on the Federal Reserve, massive short liquidations exceeding $460 million, and growing institutional adoption with companies like Emirates integrating crypto payments.
What’s driving Bitcoin to new highs?
Bitcoin’s rally past $112,000 is fueled by institutional ETF demand, declining volatility preceding major moves, corporate treasury adoption, and regulatory momentum around digital asset legislation.
Why are altcoins outperforming Bitcoin?
Ethereum and other altcoins are benefiting from tokenization trends, ETH’s emergence as a treasury play, forced liquidations of leveraged shorts, and smart money accumulation while retail remains absent.
XRP price rose over 12% in the past 48 hours, climbing to $2.44 following Ripple’s announcement of a custodial partnership with BNY Mellon. The move pushed XRP through a year-long descending trendline and into a major resistance band. Now, traders are watching to see whether momentum can sustain above $2.40, or if profit-taking sets in.
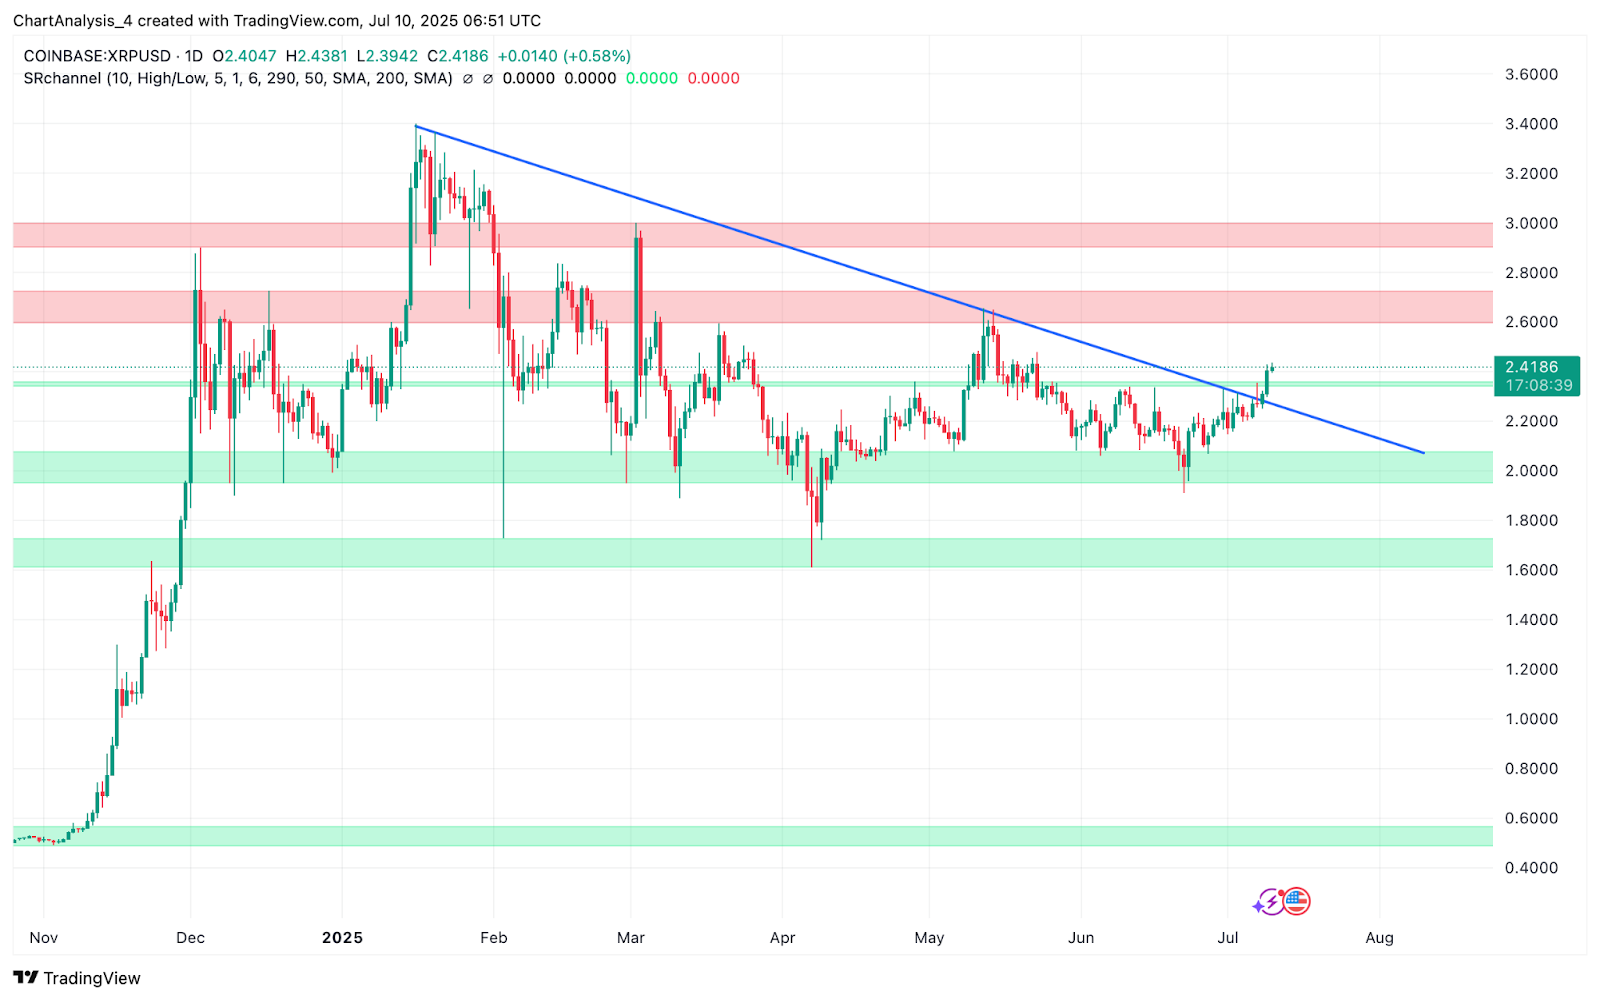
XRP has broken decisively above the $2.25–$2.28 resistance zone and is consolidating just below $2.44. This breakout marks the first successful close above the macro downtrend line since March 2024, according to the daily chart. The move also reclaims a crucial horizontal supply zone that previously capped price since April.
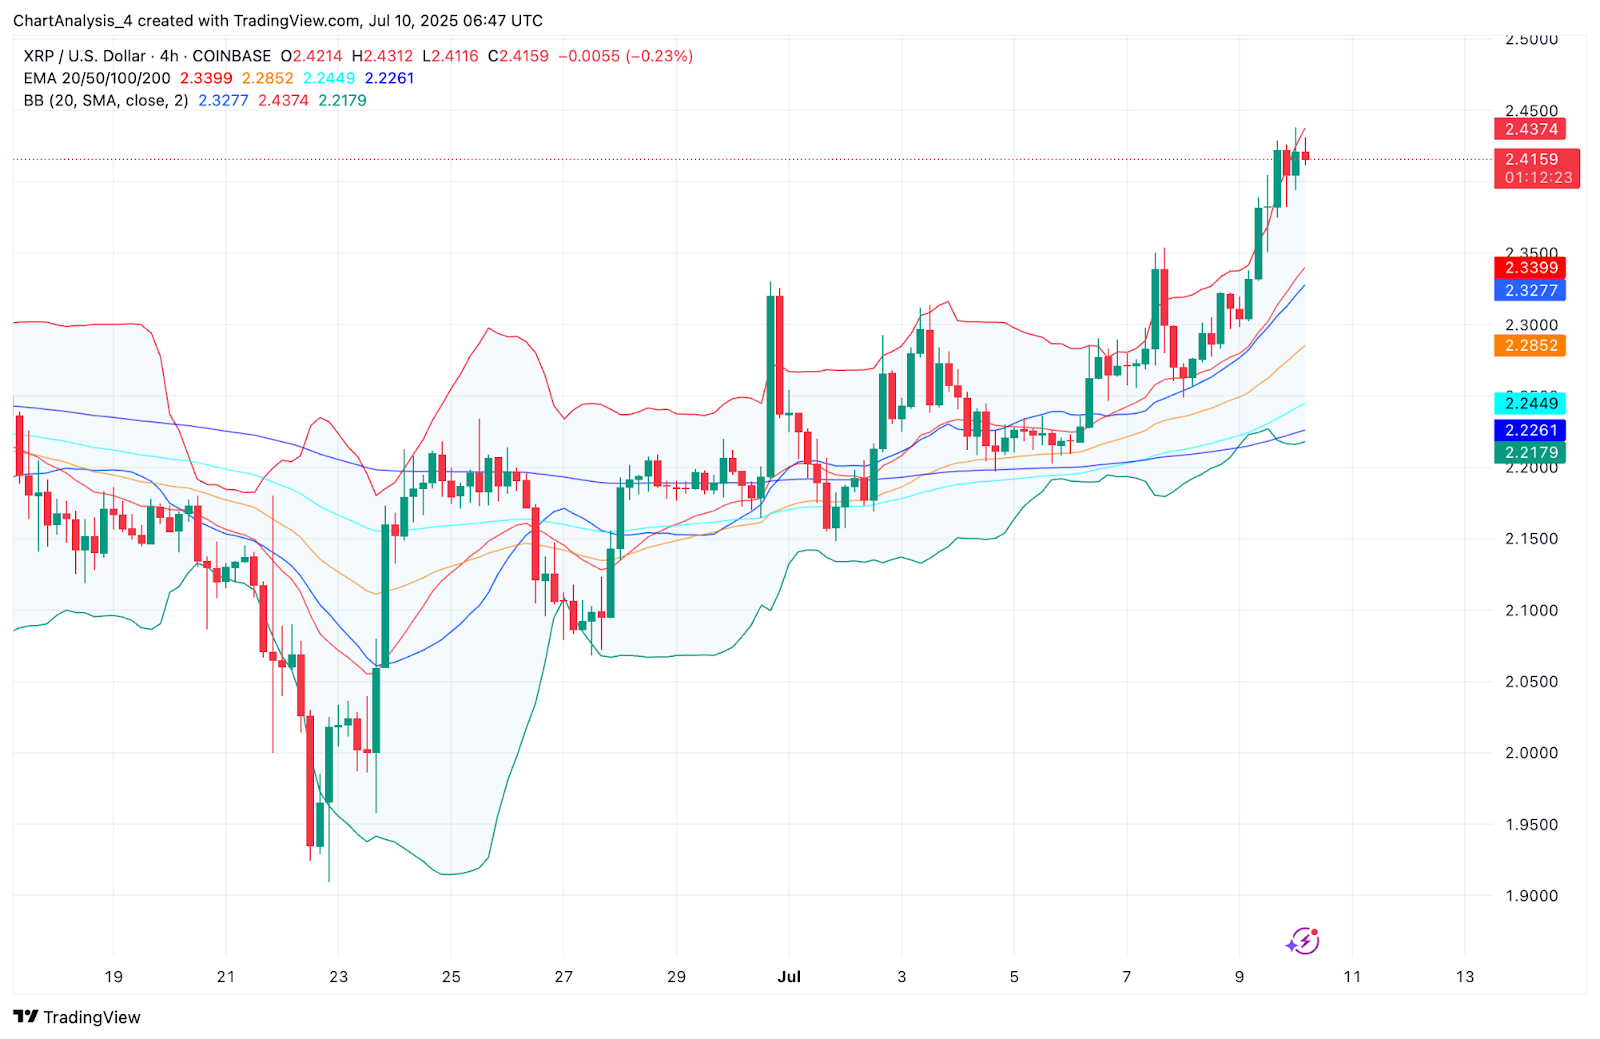
The 4-hour Bollinger Bands show XRP pushing the upper band at $2.4374, with the price now pausing near this dynamic resistance. Meanwhile, the EMA cluster (20/50/100/200) is fully aligned below price with the EMA20 at $2.34 and the EMA100 near $2.24 further confirming strong bullish structure.
XRP’s price action has now entered a liquidity pocket between $2.44 and $2.52, a zone…
The post XRP (XRP) Price Prediction for July 11 appeared first on Coin Edition.


