The main category of Crypto News.
You can use the search box below to find what you need.
[wd_asp id=1]
The main category of Crypto News.
You can use the search box below to find what you need.
[wd_asp id=1]
A rare technical pattern that has only appeared twice in XRP’s history and was followed by explosive rallies of 1,500% and 8,000% has just flashed again on the charts, according to a new analysis.
This development has put XRP back at the center of investor attention. The digital asset is already showing strong bullish momentum to this effect, currently trading around $2.40 with a 7-day rise of over 8%.
A well-followed market analyst, EGRAG CRYPTO, is highlighting a repeating three-month green candle pattern as a key bullish signal. According to his analysis, this pattern has only appeared twice before in XRP’s history. In both cases, a major rally followed.
In one instance, XRP consolidated for five months and then skyrocketed by 1500%. A similar setup today could drive prices toward the $10 mark by August …
The post XRP Chart Flashes Rare Pattern from 1,500% Rally appeared first on Coin Edition.
Dogecoin
DOGE
$0.18
24h volatility:
6.4%
Market cap:
$27.29 B
Vol. 24h:
$1.82 B
traded at $0.1758 on Tuesday, July 9, consolidating above the $0.17 psychological resistance for a second session. This technical breakout comes after nearly two months of consolidation between $0.13 and $0.16.
Dogecoin price forecast | Source: TradingView
The daily DOGEUSDT chart outlines a Triple Bottom pattern, with recent lows registered in March, April, and June, establishing strong support between $0.13 to $0.15. The neckline resistance is positioned around $0.20, with a potential for a 130% rally if the $0.40 breakout target is validated.
The Relative Strength Index (RSI) sits at 53.43, indicating more room for upside before overbought conditions. More so, the widening Bollinger Bands signal increased volatility with DOGE price pressing against the upper limit at $0.176.
Recent Derivatives trading metrics further validate the bullish momentum behind Dogecoin price action. On July 9, Coinglass data shows that Dogecoin Open interest surged by 5.92% to $2.16 billion, reflecting approximately $130 million in fresh capital inflows within the last 24 hours.
This rapid capital inflow was accompanied by a rise in trading volume, which climbed to $3.33 billion, emphasizing the bullish rebound narrative.
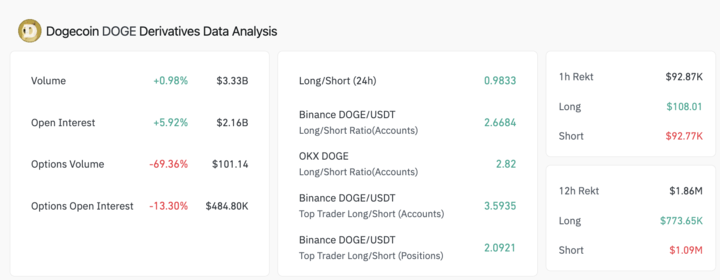
Dogecoin Derivatives Market Data | Source: Coinglass
More so, Dogecoin Long/short ratios across major exchanges further reinforce the bullish narrative. On Binance, the ratio of long to short positions among accounts stands at 2.7, while OKX shows an even stronger bias with a ratio of 2.8.
Among top traders on Binance, the long/short ratio based on accounts has reached 3.6, and by open positions, it sits at 2.11. These figures reveal that both retail and high-volume traders are clearly leaning long, favoring another DOGE price leg-up in the coming sessions.
If Dogecoin can sustain a daily close above $0.18, bullish traders will likely attempt to reclaim the $0.20 neckline.
Conversely, failure to hold $0.17 support may drag prices back to the Bollinger midline near $0.164 or even lower, toward the $0.15 pivot.
As Dogecoin regains momentum, meme coin enthusiasts are also eyeing $BTCBULL, the leading presale token tied to Bitcoin performance.
BTC Bull Token allows holders to earn passive Bitcoin rewards as BTC advances toward $1 million, a narrative already attracting investor interest.
With $8.4 million USDT raised and tokens now live for claiming and staking, BTCBULL is well-positioned to benefit from the current bull cycle.
The post Dogecoin Price Surges Past $0.17 as Triple Bottom Pattern Signals 130% Upside Potential appeared first on Coinspeaker.
Cardano is pressing against key resistance as whale accumulation, rising dominance, and Grayscale backing hint at a potential breakout ahead.
Cardano price jumped nearly 9% in the last few hours and is currently trading around $0.61. While not related to Cardano has made it into the headlines, but a lot is going on behind the scenes.
Cardano just landed the third spot in Grayscale’s Smart Contract Platform Fund, taking up 18.57% of the portfolio, right behind Ethereum and Solana. That is a major share among the institutional holdings. It means Grayscale, one of the biggest names in crypto investment, sees enough long-term value in ADA to give it serious weight in their smart contract lineup.
Grayscale boosts Cardano to the third-largest holding in its Smart Contract Fund, signaling rising institutional confidence in ADA. Source: Grayscale via X
While Cardano hasn’t always had the spotlight, but this move signals growing trust. Grayscale’s allocation puts ADA ahead of newer players like Sui, Avalanche, and Hedera, showing it’s still a core bet in the layer-1 space. Whether or not ADA makes a price run soon, it’s clear some major players are willing to play it out.
After reclaiming the $0.60 mark, Cardano price is now testing a key resistance around $0.62, an area it hasn’t convincingly broken for days. The chart shared by Crispy shows ADA bumping right into this zone, with a clean neckline across prior local highs. If it clears this level with strength, a move toward $0.70 opens up, backed by increasing volume and a trending RSI.

Cardano retests key resistance at $0.62, with rising volume and RSI hinting at a breakout toward the $0.70 range. Source: Crispy via X
Grayscale just boosted confidence in ADA by making it a major part of its smart contract portfolio. That kind of long-view backing adds a layer of support for the price action. If price flips $0.62 into support, Cardano price prediction starts to lean bullish.
While ADA’s technicals are focused on the $0.62 resistance level, the whales have been making their moves. According to Ali Martinez, whales have added up over 120 million ADA in just the last two weeks. This kind of activity suggests that whales are positioning in advance before the breakout of the resistance.
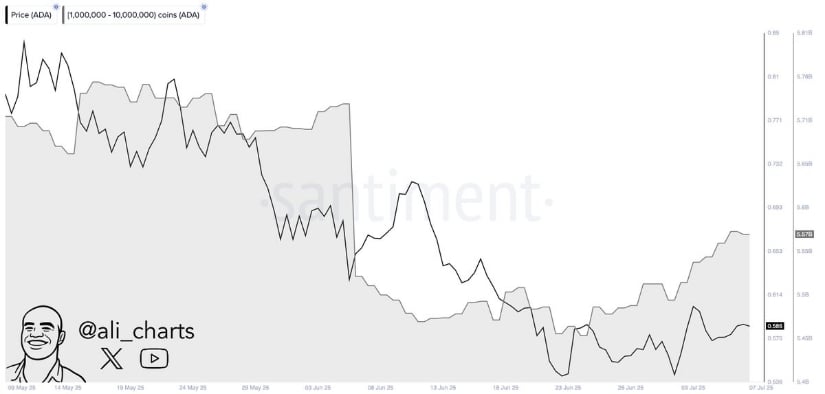
Whales accumulate over 120 million ADA in two weeks, signaling confidence ahead of a potential breakout. Source: Ali Martinez via X
This buying spree lines up with the bullish narrative. I started with Grayscale’s major allocation to ADA, then technicals showed signs of strength as momentum picked up. Now, the on-chain side shows heavyweight wallets moving in.
While Cardano’s price is challenging resistance near $0.62, ADA’s market dominance is quietly starting to climb again. According to this chart shared by Ssebi, ADA dominance has ticked up to 0.64%, a small but notable reversal after months of decline. This hints at a potential shift in momentum, especially as Bitcoin dominance starts to trend lower.
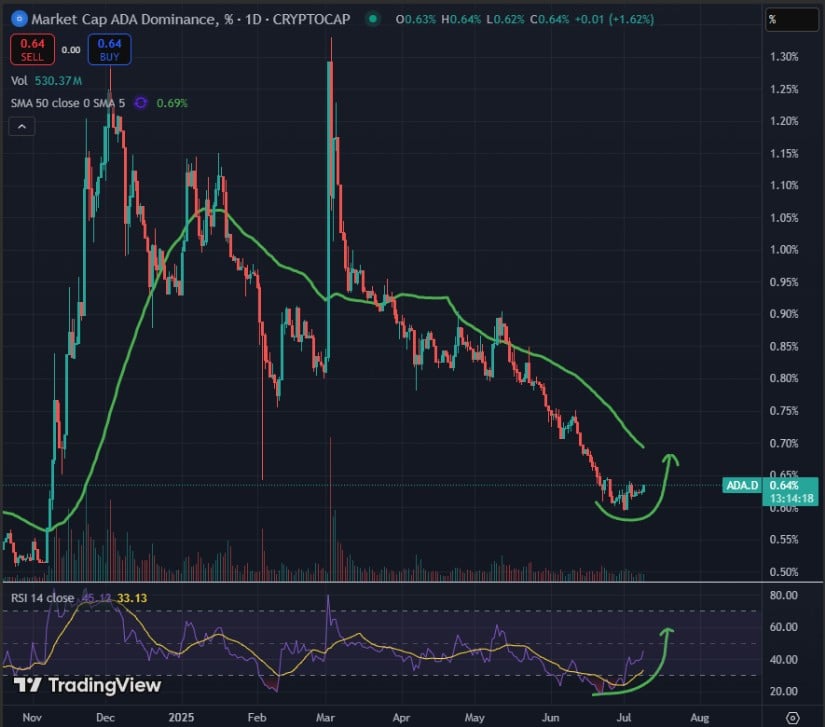
Cardano’s market dominance rises to 0.64%, marking a subtle but important reversal after a months-long downtrend. Source: Ssebi via X
Technically, ADA’s dominance is curling up off the lows with RSI rising from oversold territory. If this trend continues, it could signal a broader shift in capital flow toward altcoins, and ADA looks to be one of the first in line. Add that to the institutional interest from Grayscale and heavy recent whale accumulation, and Cardano is beginning to look more like a frontrunner.
While ADA is hovering just below its $0.656 breakout level, the on-chain activity is starting to look more supportive. As confirmed by Zhao Lusi, whales have added 120 million ADA over the last two weeks, worth approximately $71 million, and more than $8 million ADA has left exchanges during the same period. That kind of exchange outflow often signals reduced sell pressure and growing holder conviction.
Here’s a quick breakdown of what’s stacking up:
120M ADA added by whales, suggesting accumulation ahead of a possible breakout
$8M ADA withdrawn from exchanges, easing immediate sell pressure
Price pressing against $0.656, a level that could flip momentum if cleared
Positive netflow emerging, a shift from recent months of outflows
Put together, it’s not just the price pressing up; it’s the underlying flow of capital and behavior behind the scenes that’s slowly turning in ADA’s favor.
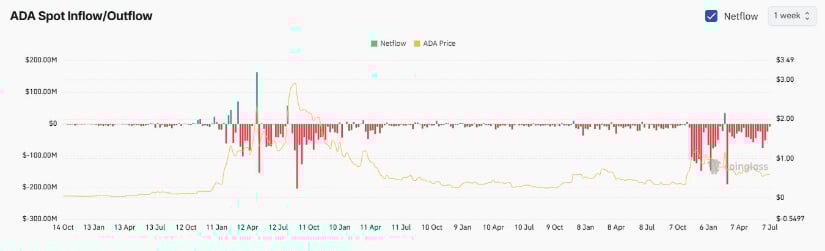
Over $71M in ADA scooped up by whales and $8M withdrawn from exchanges, signaling growing conviction among big holders. Source: Zhao Lusi via X
ADA price has been quietly building pressure for weeks, and now things are finally starting to stack in its favor. Whales are buying, Grayscale is backing, and even ADA’s dominance is ticking up again. It’s not just a chart setup anymore; there’s real weight behind the move this time.
If ADA manages to flip $0.656, the bullish outlook starts to take shape, with $0.70 likely being the first target on the radar.
Ripple’s (XRP) price showcases bullish potential, rising over 3% to exchange hands at around $2.37 at the time of writing. This increase in the price of XRP comes amid growing macroeconomic uncertainty, triggered by United States (US) President Donald Trump expanding the scope of his potential tariffs to include copper and pharmaceuticals.
Ripple, the issuer of XRP, has announced the selection of the Bank of New York (BNY), a renowned global service institution, as the primary custodian for its enterprise-grade Ripple USD (RLUSD) stablecoin reserves.
According to the announcement via a blog post, RLUSD stands out from other stablecoins for being regulatory-compliant, transparent, and fostering institutional-oriented utility. The token, pegged to the US Dollar (USD), is issued under a New York Department of Financial Services (NYDFS) Trust Company Charter.
“Ripple USD addresses a critical gap in the market as a stablecoin developed for enterprise-grade financial use cases, designed to meet the rigorous standards of leading financial institutions,” SVP of Stablecoins at Ripple, Jack McDonald, said.
Ripple has, in recent weeks, committed to expanding its stablecoin infrastructure by building strategic partnerships beyond the US, particularly in the European and Asian regions. The company aims to be the bridge between traditional finance and the digital currency ecosystem, potentially capturing a significant portion of the SWIFT system’s global volume.
Interest in the token has also continued to improve over the past two weeks, with XRP futures Open Interest (OI) rising to $4.98 billion from the $3.54 billion recorded on June 23. OI represents the value of all futures and options contracts that have not been settled or closed. The nearly 30% increase indicates trader confidence in the token, with bets on futures price increases buoying risk-on sentiment.
XRP futures Open Interest | Source: CoinGlass
XRP’s price is back in a short-term bullish phase, backed by growing interest in the derivatives market. The token has offered multiple technical bullish signals on the 8-hour chart below, starting with a Golden Cross pattern.
A Golden Cross is a bullish formation characterized by a shorter-term moving average crossing above a longer-term moving average. For instance, the 50-period Exponential Moving Average (EMA) currently holds above the 200-period EMA, reinforcing the bullish structure.
Traders will likely seek exposure, considering the Moving Average Convergence Divergence (MACD) indicator has sustained a buy signal since Sunday. The green histogram bars expanding above the mean line signal that the bullish outlook may have the potential to sustain recovery in upcoming sessions.
A recently confirmed breakout from an inverse Head-and-Shoulders (H&S) pattern estimates an 18% move to $2.76. This target, as discussed in the previous price forecast, is determined by measuring the height of the pattern and then extrapolating above the breakout point.
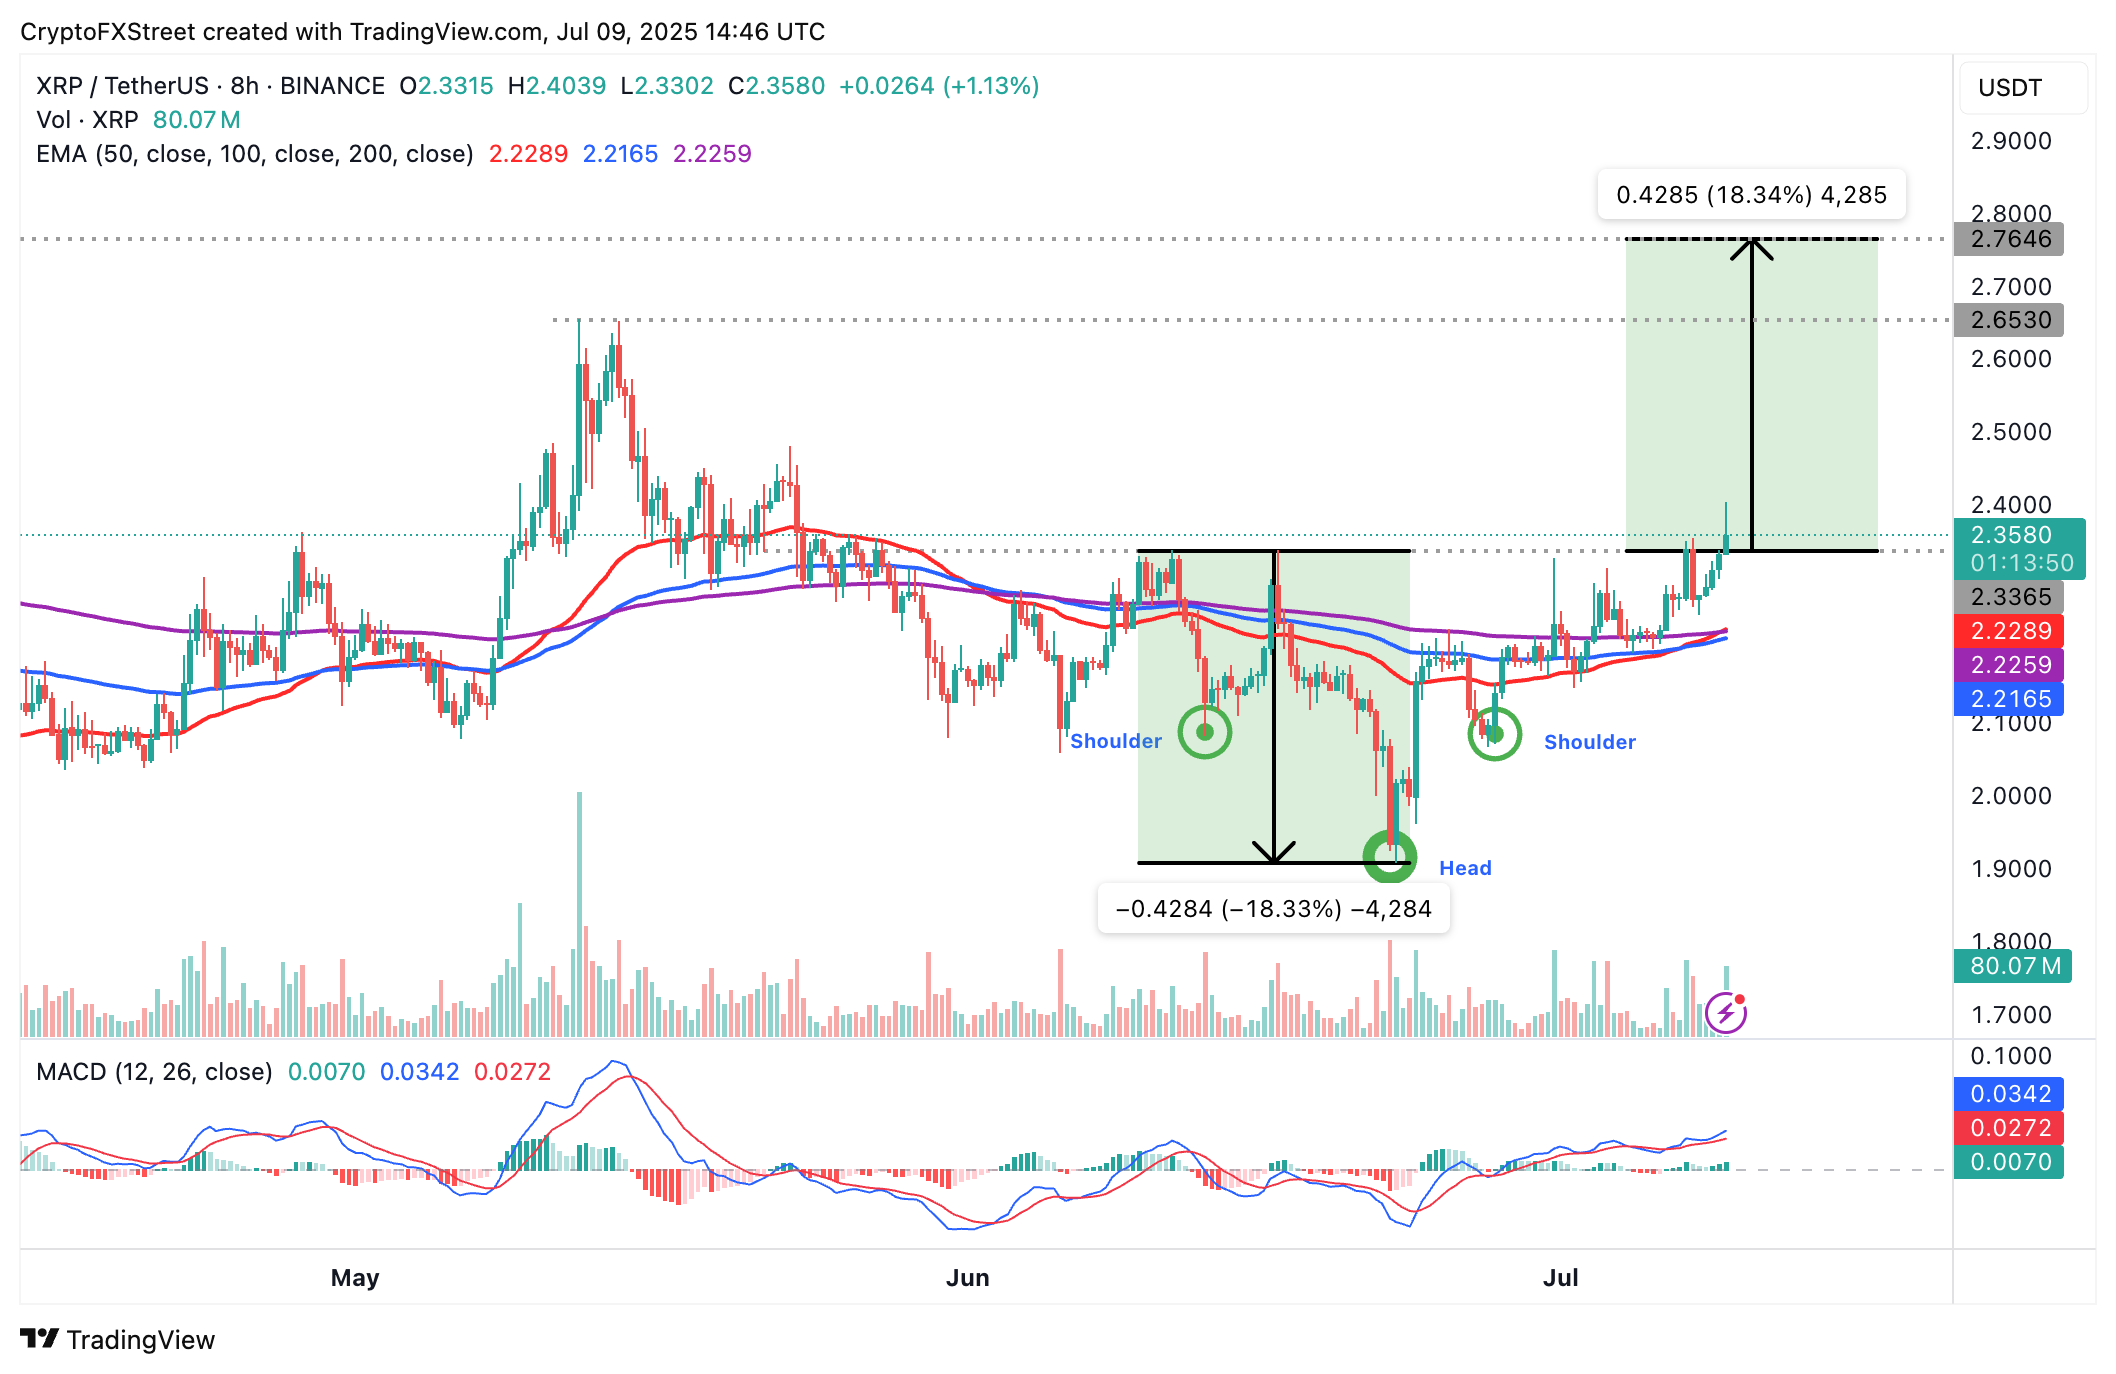
XRP/USDT 8-hour chart
Still, XRP could face resistance at $2.40, a level that capped price action around June 20. A trend reversal from this level or slightly higher could be motivated by potential pressure from profit-taking activities and the possibility of changing market dynamics, especially with tariff shockwaves on the horizon.
Key levels to keep in mind as tentative support are the confluence formed by the 50-period EMA and the 200-period EMA at $2.22, the 100-period EMA at $2.21, and the area around $2.20, which was tested on July 5.
Dogecoin price is heating up this July as whale activity spikes and market sentiment shifts bullish.
With DOGE rebounding above $0.17, traders are watching closely—could a breakout above $0.25 be next? Here’s the latest Dogecoin price prediction and analysis.
Dogecoin (DOGE) is regaining investor attention in July 2025 as the popular meme coin shows signs of a rebound after weeks of sideways movement. The dogecoin price recently climbed above $0.17, marking a 24% recovery from its June lows below $0.145. As of writing, DOGE is trading around $0.1721, with analysts eyeing a potential breakout toward the $0.25 resistance level.
Dogecoin (DOGE) was trading at around $0.17, up 2.09% in the last 24 hours at press time. Source: Brave New Coin
According to data from IntoTheBlock, large holder netflows surged 112% this week, suggesting aggressive accumulation by whale wallets holding between 1 million and 100 million DOGE. This sharp increase in whale activity reflects growing institutional confidence, especially as macroeconomic pressures begin to ease.
“Whales are doubling down on DOGE amid signs of renewed bullish sentiment and broader market recovery,” noted a Bitget analyst in a recent update.
From a technical standpoint, Dogecoin is attempting to break through a multi-month resistance zone between $0.175 and $0.18. The daily Relative Strength Index (RSI) is trending upward from the low-40s, currently sitting near 50. Analysts interpret this shift as a signal that bearish momentum is weakening.
 Price Prediction: DOGE Rebounds with Strength—Eyes Breakout Above alt=")
Dogecoin has broken past its previous resistance at $0.17, forming a strong bullish structure with buyers firmly in control. Source: FrankFx14 on TradingView
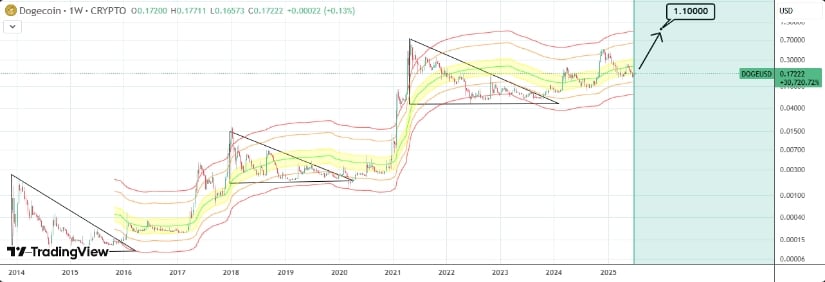
The Moving Average Convergence Divergence (MACD) indicator has also shown signs of a potential bullish crossover. Meanwhile, DOGE’s price structure is now forming a bullish cup-and-handle pattern on the weekly chart—a technical formation that often precedes significant upward movement. If confirmed, this structure could push Dogecoin price toward the $0.75 region in the long run.
Much of Dogecoin’s recent price performance is attributed to macroeconomic shifts, including optimism around a potential U.S. Federal Reserve rate cut. Crypto markets rallied broadly after the Fed hinted at a dovish policy and trade tensions began to ease.
Moreover, Elon Musk’s unexpected announcement of a new political platform, the “America Party,” fueled further DOGE speculation. While Musk did not explicitly mention Dogecoin, his history of promoting DOGE across Tesla and X (formerly Twitter) triggered a wave of meme coin enthusiasm.
“Musk has always been a wild card for DOGE, and traders are positioning accordingly,” said Shawn Young, Chief Analyst at MEXC.
The 24-hour trading volume for Dogecoin exceeded $1.03 billion in early July, reflecting renewed investor participation. On-chain activity has seen a sharp rise, with over 12,000 new wallets being activated daily. DOGE whale wallets, in particular, are not only accumulating but also participating in governance discussions about future upgrades, including Layer 2 scalability solutions.
DOGE’s current market cap stands at $25.16 billion, and its increased liquidity puts it in a strong position for further growth. Developers are reportedly working on integrations with social media platforms in Latin America and Southeast Asia, which could further enhance utility and support a long-term uptrend.
Analysts are cautiously optimistic that DOGE could break above $0.20 in the coming weeks. If the resistance at $0.175 is overcome, momentum could carry the dogecoin price toward the psychological $0.20 mark, with a stretch target between $0.23 and $0.25.
Dogecoin remains in limbo, with a breakout above $0.25 signaling a move toward $0.74. Source: Mukit1 on TradingView
“Dogecoin is coiling near a breakout zone,” said crypto analyst Simeon. “If bulls reclaim $0.20, a test of the $0.25 area is likely before the month ends.”
However, failure to hold above $0.1623 support may result in a pullback to $0.13, especially if trading volume dries up. Traders are urged to monitor daily closes and RSI behavior as potential indicators of trend confirmation.
Looking further ahead, several market observers believe Dogecoin could reach $0.30 or higher by the end of 2025, contingent on the successful implementation of Layer 2 upgrades and continued adoption.
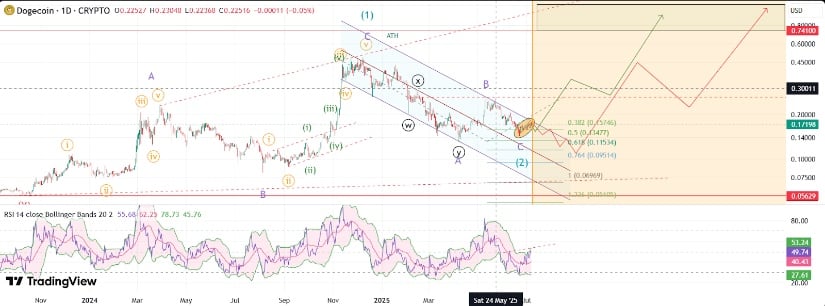
Dogecoin’s 1D technicals suggest it’s undervalued, with cycle patterns pointing to a potential rally toward $1 by year-end. Source: InvestingScope on TradingView
ETF speculation is also driving enthusiasm. Asset managers such as Grayscale and 21Shares have filed for DOGE ETF applications, with decisions expected later this year. If approved, such products could attract institutional capital and legitimize Dogecoin within traditional financial systems.
“An ETF would be a game changer for Dogecoin,” said Eugene Cheung, CCO at OSL. “It opens the door to a whole new class of investors.”
While Dogecoin is a high-risk asset, recent trends suggest that it could be in a new accumulation phase. With increased participation by whales, social media mania, and macroeconomic tailwinds, DOGE appears to be breaking out.
Whether or not dogecoin reaches $1 is unknown, but the coming weeks can be decisive for its short-to-medium-term destiny. For now, all eyes are on the $0.175 resistance—a gateway that could define Dogecoin’s July rally and beyond.
Buyers remain more powerful than sellers in the middle of the week, according to CoinMarketCap. CoinMarketCap”>
The rate of Cardano ![]() ADAUSD has risen by 2.23% over the last 24 hours.TradingView”>
ADAUSD has risen by 2.23% over the last 24 hours.TradingView”>
On the hourly chart, the price of ADA might have set a local resistance of $0.599. If buyers can hold the gained initiative and the daily bar closes near the upper level, one can expect a breakout, followed by a further upward move to the $0.61 area.TradingView”>
On the bigger time frame, the rate of ADA is rising after yesterday’s bullish closure. If the bar closes near its peak and with no long wick, traders may expect a test of the resistance of $0.6117 until the end of the week.TradingView”>
From the midterm point of view, the price of ADA is far from key levels. In this case, one should pay attention to the bar’s closure in terms of the previous candle’s high.
If it happens near $0.61, the accumulated energy might be enough for a test of the $0.65 range.
ADA is trading at $0.5973 at press time.
XRP could be on the verge of a breakout, with analysts eyeing a powerful Wave 3 rally to as high as $15.
A bullish chart pattern and rising market optimism are fueling fresh predictions of a massive XRP price surge, as the token breaks the short-term resistance around $2.30.
Crypto analyst Shawn Mark has ignited fresh bullish sentiment in the XRP community by predicting a potential 600% surge in price, citing Elliott Wave Theory as the foundation for the forecast. According to the analysis, Wave 3, traditionally the strongest phase in the Elliott Wave cycle, may push XRP price toward the $13–$15 range, with an extended target between $26 and $33.
XRP could surge over 600% in its next Wave 3 rally, potentially reaching $13–$15 based on historical patterns. Source: @Shawnmark7899 via X
This prediction stems from past price action, notably the 600% rise seen between November 2024 and January 2025, when XRP surged on renewed momentum following key legal and regulatory developments. If history is any guide, analysts believe XRP may be on the verge of repeating that performance.
“Wave 3 is typically the most aggressive phase of an impulsive move, and XRP’s setup looks ripe,” the analyst posted, adding that if bullish momentum builds from current levels, “we could see XRP entering price discovery above $10.”
As of July 9, XRP is trading at $2.346, marking a 2.3% daily gain and a 6.73% rise over the past week. While the asset has shown resilience, short-term volatility remains a key challenge. Binance data indicates a 6.58% drop in the last 24 hours prior to the latest rebound, suggesting that bullish momentum is not yet fully secure.
According to CoinMarketCap, XRP’s 24-hour trading volume stood at $4.7 billion, a sign of heightened market activity. Analysts at CoinCodeCap believe the token may retrace to $2.00–$2.10 before attempting to reclaim the $2.50 resistance zone. They suggest a “buy-the-dip” strategy, eyeing a potential 20% gain on the next leg upward.
The short-term technical picture for XRP coin remains constructive. The MACD (Moving Average Convergence Divergence) shows a bullish crossover, with the MACD line above the signal line—often interpreted as a continuation of upward momentum.

XRP is showing strong bullish momentum, and a confirmed breakout above $2.34 could pave the way toward $2.48, while support at $2.16 remains key to sustaining the uptrend. Source: FenzoFxBroker on TradingView
Similarly, the Relative Strength Index (RSI) currently stands at 59.62. This places XRP in bullish territory but below the overbought threshold of 70, giving room for further upside before technical exhaustion sets in.
Meanwhile, More Crypto Online reports that XRP is facing a key resistance test between $2.32 and $2.34. A decisive breakout above this range could confirm the start of a larger rally, possibly setting the stage for the anticipated Wave 3 explosion.
Beyond technicals, Ripple’s ongoing efforts to secure a U.S. banking license may also contribute to future adoption. Though it doesn’t directly affect XRP’s classification, the move could strengthen Ripple Labs’ position within traditional finance and boost long-term investor confidence in XRP crypto.
The company has also benefited from easing regulatory pressure after the drawn-out Ripple vs. SEC lawsuit, which clarified that XRP is not a security when sold to retail investors. This ruling helped lift much of the legal uncertainty that had long suppressed XRP price predictions.
With fewer legal headwinds and an improving macro environment for crypto, many traders are now revisiting the question: Will XRP go up from here?
If XRP breaks above its July high of $2.35, analysts expect the next major test at $2.50, followed by resistance zones near $2.65 and $3.00. A successful breakout from there could set the tone for a much larger move toward $5 and beyond, especially if institutional adoption accelerates.
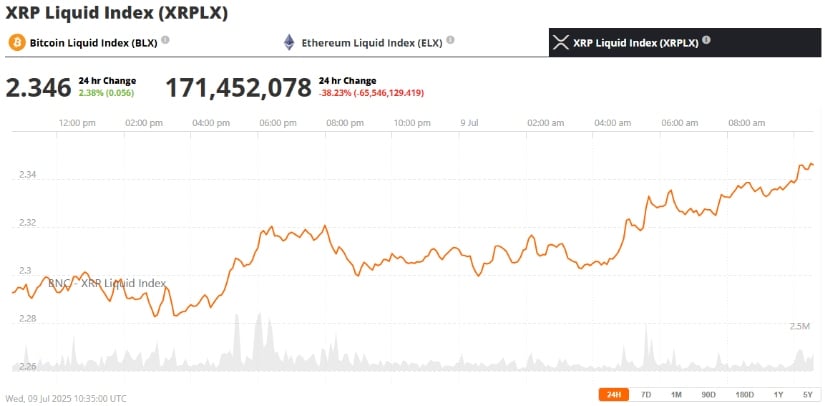
XRP was trading at around $2.34, up 2.38% in the last 24 hours at press time. Source: XRP Liquid Index (XRPLX) via Brave New Coin
Long-term XRP price prediction 2025 outcomes range from slight increases of around $5 to very optimistic situations crossing into double digits. Experts even say XRP price prediction 2030 goals exceeding $20 if international use and regulation clarity continue to improve.
While bullishness still prevails, investors should keep a close eye on the significant breakouts and confirmation of volume. In the extremely volatile crypto space, a technical setup is only half the story—macro conditions and sentiment also seem to play just as dominant a role.
XRP appears to be at a crucial inflection point. With technical indicators flashing bullish, a historic Wave 3 rally potentially in the making, and Ripple’s regulatory outlook improving, the stage may be set for significant upside—if price can clear resistance. Whether it fulfills the lofty 600% surge forecast or not, XRP today is firmly back in the spotlight.
As always, crypto markets remain unpredictable. But if the bulls are right, this may be just the beginning of a new era for XRP crypto price prediction models.
Solana price is trading near key resistance, with rising institutional interest and bullish chart patterns hinting at a potential breakout toward the $200 mark.
SOL Solana price is starting to turn heads again as fresh signs of strength emerge across both the charts and on-chain activity. Market participants now believe SOL could be setting up for a 20-30% rally ahead.
In a bold move, DeFi Dev Corp has significantly increased its exposure to Solana, now holding 690,420 SOL, representing a 64% increase from just two months ago. The acquisition of an additional 47,272 SOL brings their total stake to an impressive $103 million. This step signals a growing belief in Solana’s potential as DeFi Dev Corp joins other institutional players in the ecosystem.
With this much capital now committed to SOL, it’s clear that interest in Solana is strengthening, and DeFi Dev Corp’s growing position could add credibility to the network in the eyes of other investors.
DeFi Dev Corp boosts its Solana stake to $103M. Source: DeFi Dev Corp via X
The uptick in SOL holdings also coincides with a shift in the broader crypto space toward platforms with scalability and strong developer ecosystems. DeFi Dev Corp’s latest move not only highlights Solana’s continued relevance but also serves as a reminder of the increasing institutional confidence in the blockchain’s future. Such events typically have a positive impact on price as institutional interest grows, adding long-term value and supporting price momentum.
Solana price is showing signs of a potential bullish breakout, as the price consolidates within a symmetrical triangle formation on the 4-hour chart. As analyst Disrupt Yourself points out, SOL is primed for a push higher in the next 24 to 48 hours. The breakout from this pattern could lead to a substantial upward move, with the chart signaling that SOL is gaining strength after days of consolidation.

Solana forms a bullish symmetrical triangle on the 4H chart, with breakout potential targeting $170. Source: Disrupt Yourself via X
The recent technical setup aligns with growing interest in Solana, highlighted by DeFi Dev Corp’s increased exposure to SOL. With institutional confidence building in the ecosystem, Solana is positioning itself for stronger price action, especially if the breakout from this triangle formation materializes. Once Solana enters a breakout, it can quickly target the $170 mark, creating a strong recovery and a clear shift in momentum.
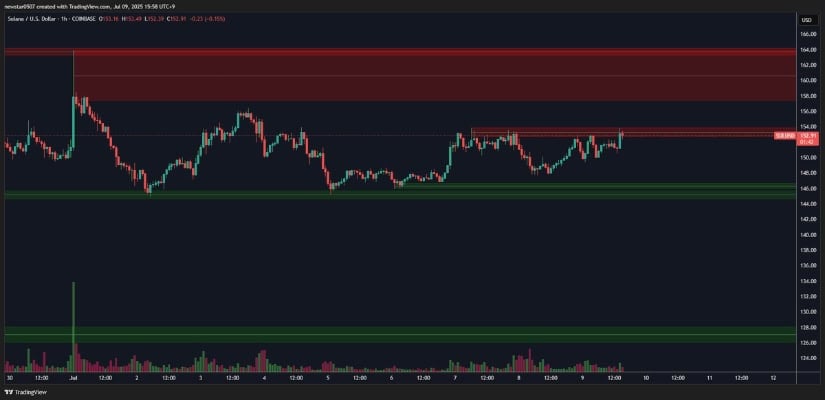
SOL Solana price is currently holding an important support level of $147.59, a price point that has consistently acted as a key point of interest according to recent data shared by analyst Ali Martinez. Although Solana currently trades at $153 but, this level of $147.59 represents a significant cluster in the UTXO realized price distribution, which indicates that many long-term holders are still underwater if the price slides back below this level.

Solana price holds firm above $147.59 support, a key level flagged to long-term holder cost basis. Source: Ali Martinez via X
However, the real challenge is whether SOL can maintain this support going forward. Holding the $147.59 level is crucial to prevent further downward pressure and set the stage for a potential rally. If SOL continues to hold this key level, it could establish a strong foundation for a move toward higher levels. As price action around this area is critical for SOL’s near-term outlook.
After days of tight range trading, SOL is once again eyeing the $164 resistance, a level that has been acting as serious resistance for the upside. As highlighted by CW, price has tested this level multiple times but hasn’t yet managed a convincing break. The repeated rejection zones in the $163–$165 band have created a thick supply wall. Unless SOL clears this with force and volume, it risks staying stuck in the volatile range.
Solana tests $164 resistance once again, with a breakout potentially paving the way towards $190–$200. Source: CW via X
Meanwhile, a clean breakout above $164 opens up the path to $190 and potentially even $200, which aligns with the next major inefficiency zones. Volume remains low for now, but a surge on breakout would confirm buyers stepping in. On the downside, $147 to $150 still acts as key support. As long as SOL holds that floor and continues pressing against resistance, momentum is building pressure for an eventual breakout.
Solana just landed another notch on the institutional credibility belt. The famous ETF analyst, Eric Balchunas, highlights that the newly filed Truth Social Crypto Blue Chip ETF will include SOL alongside BTC, ETH, and a few others, allocating 8% of its portfolio directly to Solana. While BTC still commands the bulk at 70%, Solana’s inclusion confirms that it’s no longer just a speculative bet.
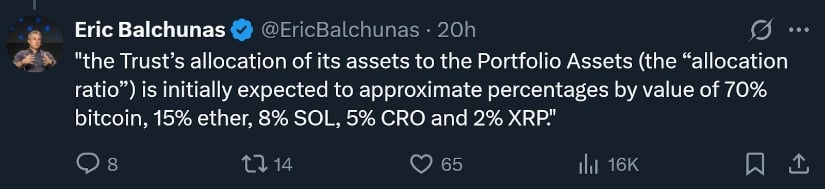
Solana secures 8% allocation in Truth Social’s Blue Chip ETF, signaling rising institutional trust. Source: Eric Balchunas via X
Zooming out, this ETF filing could act as a catalyst right as Solana attempts to break out the $164 level. A confirmed push above that range, fueled by increasing institutional flows and stronger ETF narratives, could set the stage for a swift rally toward the $190 to $200 zone. The technical setup is already in place. Now, with Wall Street backing, Solana price may finally have the momentum to turn breakout attempts into a sustained trend shift.
Solana isn’t just riding a wave of hype; it’s building a solid foundation of real momentum. From DeFi Dev Corp doubling down on its SOL holdings to new ETF exposure led by Wall Street names, the signals are getting harder to ignore. These aren’t just short-term headlines; they represent a larger shift in how institutions view Solana.
If Solana’s price manages to flip the $164 barrier convincingly, the road to $190 to $200 opens up much faster. What’s different this time is the convergence of technical strength and institutional narrative. The charts show a breakout waiting to happen, and now the headlines are starting to back it.
FTX is moving forward with customer repayments and legal settlements following its collapse in 2022, even as its native token, FTT, continues to struggle in the market.
With legal battles unresolved and trust eroded, the future of the FTX brand and the FTT token remain uncertain.
A month ago, former NBA star Shaquille O’Neal agreed to a $1.8 million settlement with FTX investors, according to documents filed in the U.S. District Court for the Southern District of Florida. The lawsuit, originally filed in May 2023, accused O’Neal of endorsing the now-defunct exchange in a 2022 television advertisement that allegedly misled retail investors.
Related: Shaquille O’Neal Agrees to a $1.8 Million Settlement in FTX Class-Action Lawsuit
This marks the first known celebrity settlement linked to FTX’s collapse. Other high-profile figures, including Tom Brady and Kevin O’Leary, were also sued but have not reached s…
The post Does FTX Still Have a Future — And What About FTT Token? appeared first on Coin Edition.
After weeks of accumulation, Ethereum price today is pressing into a crucial resistance zone near $2,640, a level that has consistently capped upside attempts since early June. The broader structure shows bullish intent, but a clear breakout above this supply zone is needed to confirm a trend continuation.
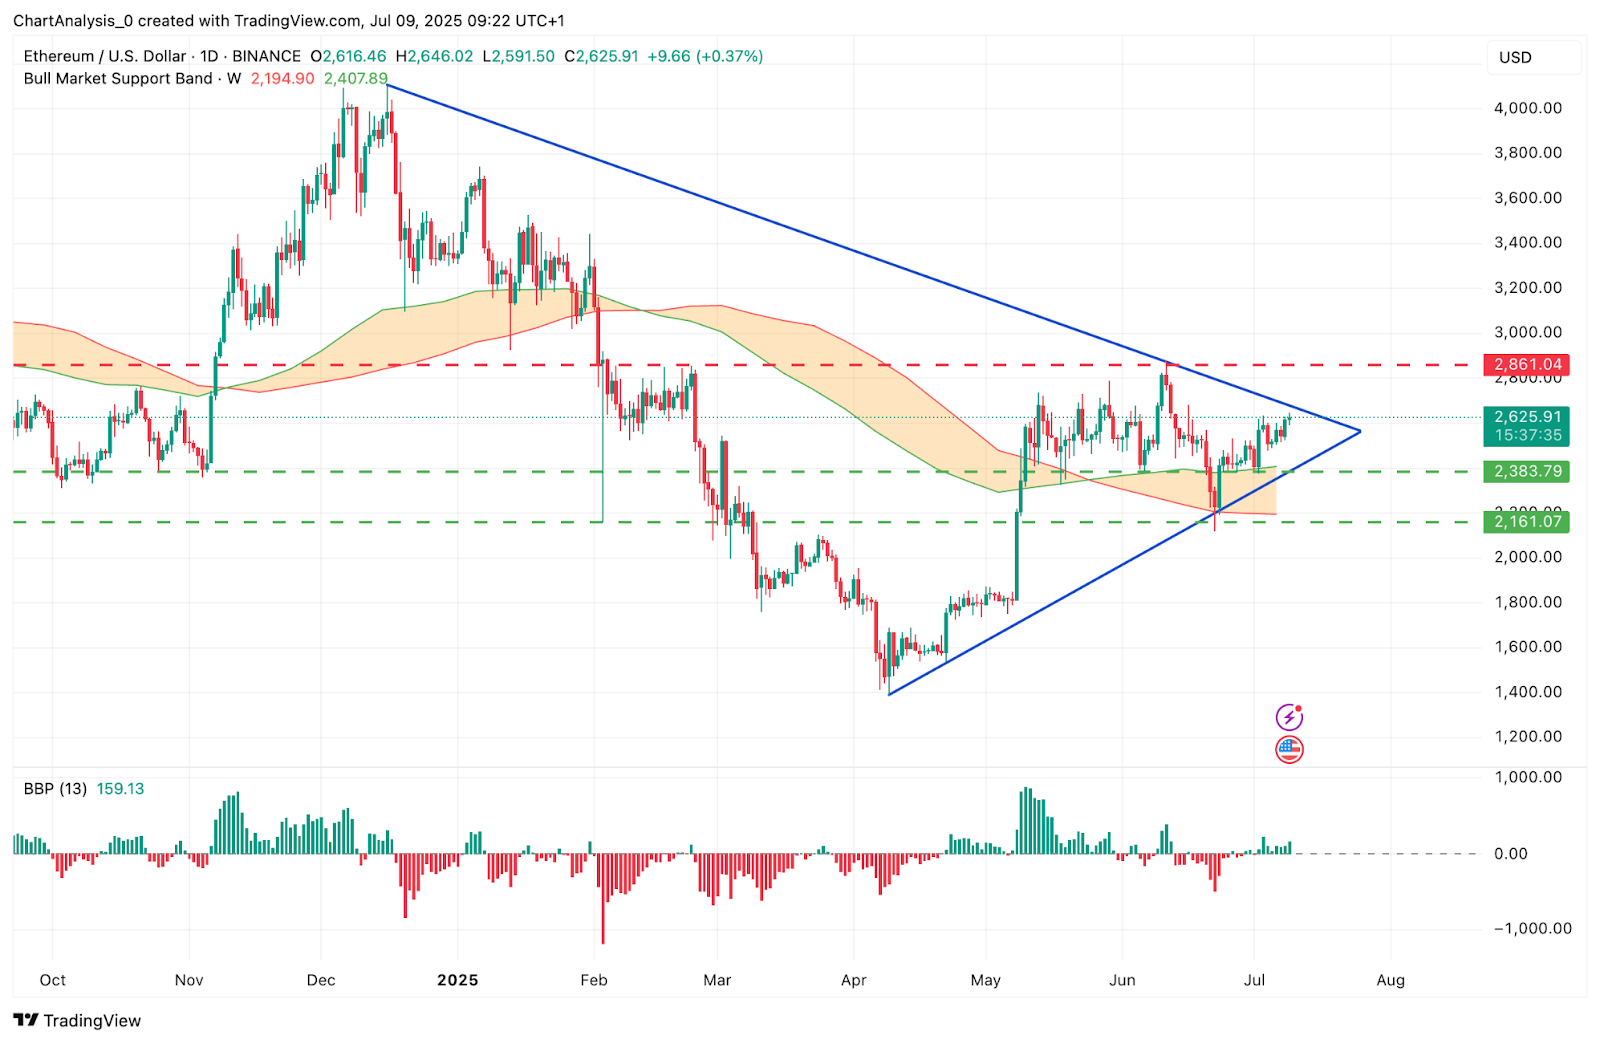
The Ethereum price action is approaching the apex of a large symmetrical triangle, visible on the daily chart. ETH is currently priced at $2,623.83, with intraday highs extending to $2,646.02. The structure has been coiling since April, with price consistently posting higher lows against horizontal resistance — forming what appears to be an ascending triangle within a broader consolidation phase.
Volume is rising gradually, and price continues to hold above the Bull Market Support Band (20-week SMA and EMA), currently between $2,194.90 and $2,407.89. This structure reinforces the mid-term bullish thesis.
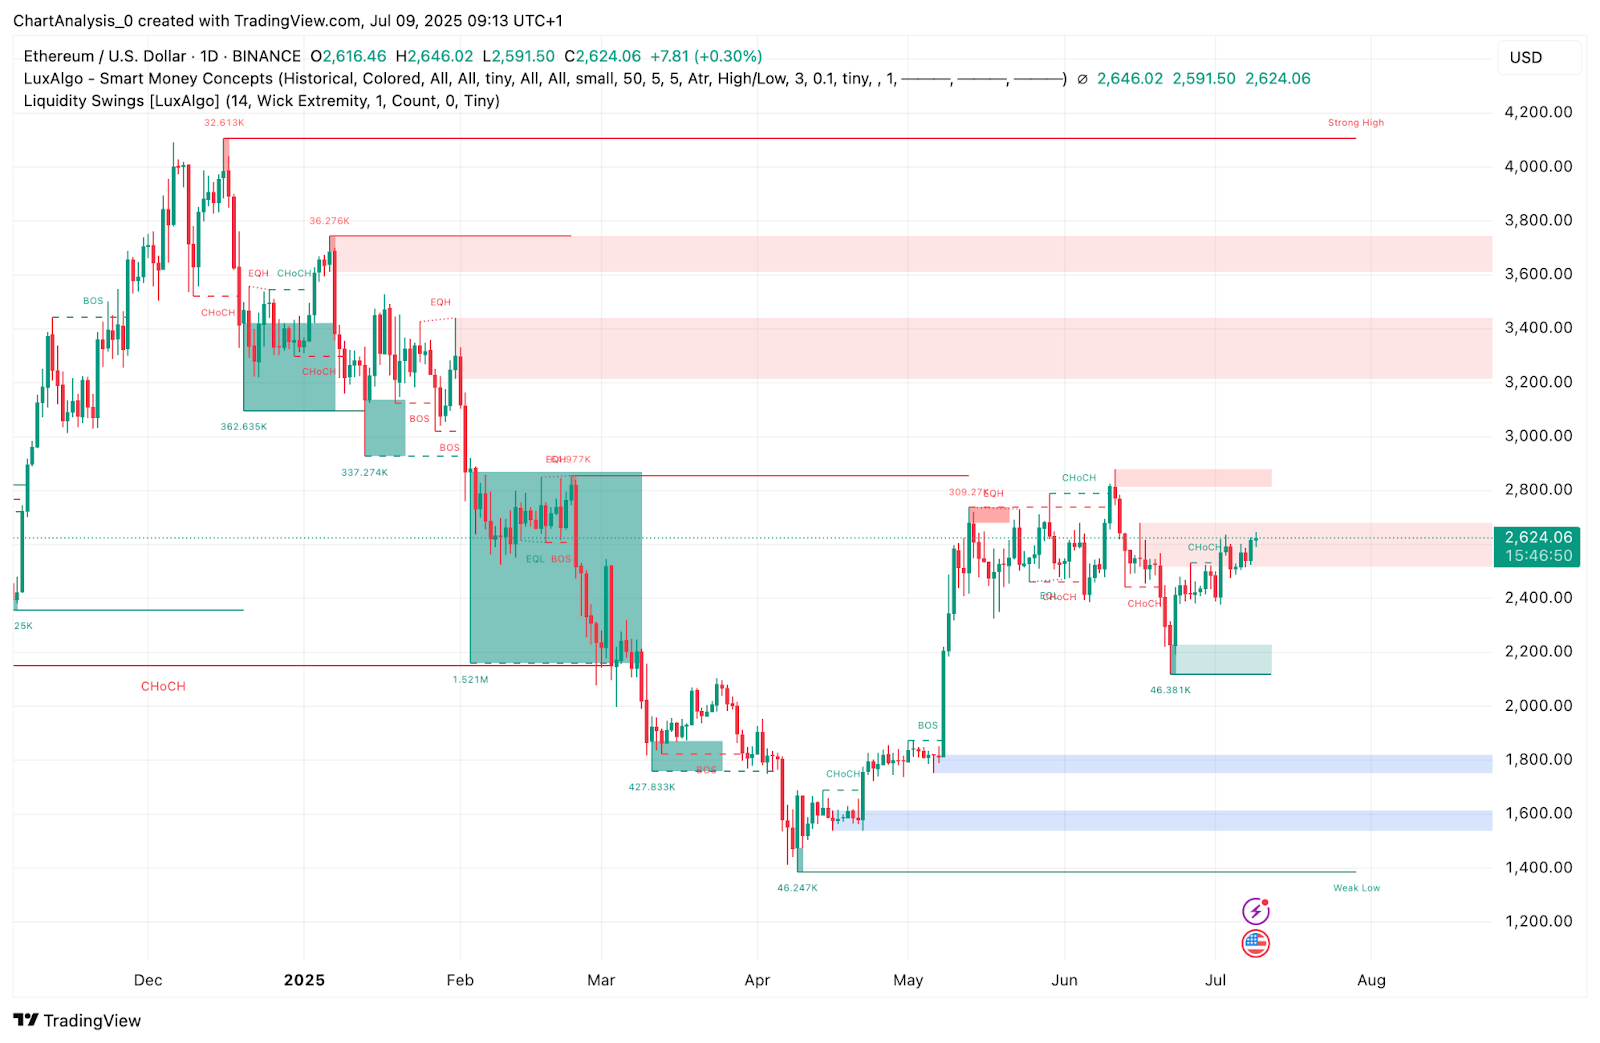
Smart Money Concept analysis shows multiple recent CHoCHs and BOS confirmations near $2,580–$2,600, adding weight to …
The post Ethereum (ETH) Price Prediction for July 10 appeared first on Coin Edition.