The main category of Crypto News.
You can use the search box below to find what you need.
[wd_asp id=1]
The main category of Crypto News.
You can use the search box below to find what you need.
[wd_asp id=1]
Ripple CEO Brad Garlinghouse is set to testify before the U.S. Senate on July 9, 2025, marking a significant shift from legal battles to leading policy discussions. His testimony emphasizes that XRP is not a security, highlighting that Ripple holds over 60 global licenses and that U.S. crypto policy is driving innovation offshore. With the hearing titled “From Wall Street to Web3,” Garlinghouse urges Congress to act, stating, “Money should move like information and XRP is the key.” This event places XRP at the center of crypto legislation debates, signaling a major turning point for Ripple.
Speculation is mounting that the SEC could announce the end of its case against Ripple this Saturday. If this happens, analysts believe it could signal a coordinated shift, including Fedwire adopting Distributed Ledger Technology (DLT) alongside ISO20022 standards. Such a move would align the U.S. financial infrastructure with blockchain-based systems, potentially positioning XRP at the core. Market watchers say this could lead to a massive price breakout for XRP, driven by utility, clarity, and institutional confidence. If true, XRP may soon reach levels the market hasn’t yet imagined.
Trump’s Truth Social is reportedly applying to launch a “Crypto Blue Chip ETF,” featuring XRP, Bitcoin, Ethereum, and Solana. This marks a dramatic shift in U.S. political alignment with crypto, especially XRP, which has long faced regulatory pressure. The move could legitimize XRP on Wall Street, offering institutional access and reshaping its narrative. Combined with Ripple’s push for a national bank charter and growing real-world XRPL utility, the ETF may open the door to broader adoption. As power circles embrace XRP, analysts warn its price may not stay retail-level for long.
The cryptocurrency market has seen significant developments surrounding Ripple (XRP) and its associated legal and regulatory landscape. The SEC’s recent rule changes aim to cut the number of spot crypto ETF approvals by 69%, indicating a more stringent regulatory environment. However, this move is seen by some as a strategic effort to suppress the XRP price, given the ongoing legal battle between Ripple and the SEC.
The Ripple vs. SEC lawsuit has been a focal point for XRP investors, with the Senate recently spotlighting the case. This legal battle has had a profound impact on XRP’s price, which has shown renewed bullish traction this week. XRP climbed to $2.30, backed by strong on-chain metrics, favorable technical indicators, and growing institutional interest. After consolidating for over a month, XRP has rallied more than 20% over the last 16 days, sparking renewed confidence in a potential move toward the much-anticipated $3.40 target.
The recent surge in XRP’s price comes after weeks of tight-range trading and signals a potential breakout. XRP is now showing firm support in the $2.25–$2.26 zone, an area that has consistently absorbed sell pressure and helped fuel the current upward momentum. A key resistance zone has formed between $2.33 and $2.38, which traders are watching closely. A clean break above this band could pave the way for further gains toward $3.04, and ultimately the $3.40 target, if bullish momentum sustains.
Several technical factors support the bullish XRP price prediction. The MACD recently flashed a golden cross for the first time since May, suggesting a shift back to mid-term bullish momentum. Meanwhile, the Relative Strength Index (RSI) has reclaimed the neutral 50 level, indicating strengthening buying pressure. However, repeated daily closes below the 170-day trendline and a looming gravestone doji suggest a potential downside reversal.
Institutional support and regulatory developments are also fueling confidence in XRP. The addition of XRP into Grayscale’s Digital Large Cap Fund and Ripple’s pursuit of a US national bank charter are seen as significant milestones. If successful, Ripple would be permitted to operate as a federal-regulated trust bank, further tightening the integration of its services with traditional finance and cementing the long-term case for Ripple XRP usage in cross-border payments.
The ongoing positivity regarding XRP spot ETF approvals is another key factor. Ten XRP ETFs are pending approval by the SEC, with a likely announcement within October 2025. Approvals of such ETFs would unlock a wave of institutional fund inflows, potentially further increasing the XRP price projection for 2025. Analysts are largely optimistic about XRP’s trajectory, predicting that if it can hold above the $2.25 support area, XRP would push towards intermediate resistance at $2.69 and $3.04, before taking on the longer-term target at $3.40. In a longer-term bull story, technical targets via Fibonacci extensions point to the possibility of a rally to $4.36, nearly a 90% rise from here. However, traders caution that momentum will have to be supported by either a regulatory spark like ETF approval or a significant rise in institutional demand.
The combination of positive technical patterns, growing institutional support, and long-term holder conviction is positioning XRP for a potentially explosive move. With regulatory clarity improving and the Ripple vs. SEC court saga largely behind it, XRP is emerging as one of the most structurally bullish assets in the current crypto cycle. Whether it reaches $3.40 or beyond may depend on how quickly the next wave of capital arrives—and how resilient buyers remain in the face of volatility.
SHIB has partnered with meme coin launchpad DegenSafe, adding fresh bullishness to the long-term Shiba Inu price outlook as a new touch point for adoption.
The news triggered a 5% price jump for the meme coin during Sunday trading in what appeared to be a buy-the-news event.
A Shibarium-based launchpad continues the project pivot away from its speculative origins by building an ecosystem anchored in real utility and fundamentals.
“From meme coins to mechanics, we’re reshaping what Web3 can be. DegenSafe is only the beginning,” Shiba Inu posted on X.
The partnership could attract fresh retail liquidity into Shiba Inu, following the success of LetsBONK.fun —the first Solana meme coin launchpad to flip Pump.fun in volume.
This may signal the start of a new meme coin trend, as speculative traders increasingly seek protection from the rug pulls, snipers, and bots that have become synonymous with Pump.fun.
That said, Shiba Inu faces tough competition, lacking Solana’s high performance and ultra-low gas fees—a core contributor to the rise of platforms like LetsBONK and Pump.fun.
If DegenSafe sees adoption similar to Solana-based meme coin launchpads, it could give Shiba Inu the fuel it needs to break free from its 6-month consolidation range.
With its latest bounce from the lower support of the consolidation zone around $0.00001, the emergence of a double bottom pattern could see SHIB retest the $0.0000177 upper resistance.
The MACD line is en route to surpass the signal line in a golden cross—the first since the Shiba Inu price last tested $0.0000177 in mid-May, suggesting a short-term uptrend may be forming.
However, the RSI highlights a lack of conviction from buyers. Despite an uptrend signaling accumulation, it remains stuck below the neutral line, currently hovering in the low 40s.
A fundamental catalyst like the DegenSafe launchpad could bring the adoption and fresh liquidity SHIB needs as the utility token of the Shiba Inu ecosystem.
If the double bottom breakout plays out, SHIB could see a 112% surge, targeting a higher resistance zone stretching back to early January at $0.000025.
However, its full potential hinges on a successful break above its neckline—the $0.0000177 resistance of the consolidation zone.
Before then, Immediate resistance at $0.000012 is the key level to watch—failure to break it risks a rejection and a 12% drop back to $0.00001, which would invalidate the pattern.
With Shiba Inu’s shift from pure speculation to real utility and fundamentals, it’s now the one creating the speculative plays.
The truth is, SHIB has faded into the background for months as traders chased fresher narratives—on the speculative meme coin scene, attention is the fuel that drives price moves.
Few stand to capitalize on this momentum as much as “mission coins”—the purest form of meme coin, fueled purely by a devoted community.
We are at a pivot point.
Dozens more launchpads will come.
Millions of gamble coins will come and go.
But only a handful of MISSION COINS will WIN. pic.twitter.com/rxsVfeux8A
— Murad
(@MustStopMurad) July 8, 2025
Token6900 ($T6900) is the latest chapter in that saga: no promises, no utility—because you are the utility. It offers nothing, and yet it is everything you are looking for.
This is your way out of the misery of a late-internet capitalist dystopia, to a fantasy where money is no longer in control of big institutions.
Instead, the masses can now print their own currency, one inspired by 2000s nostalgia and fed by nothing but a desire to escape the ritual of the financially doomed—the 9-to-5.
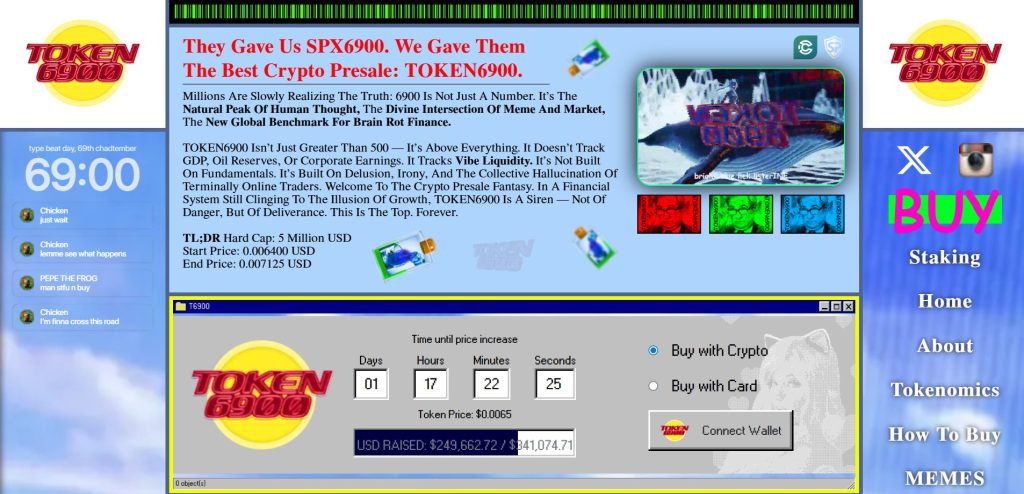
The community is already growing and fast, raising nearly £250,000 in the first weeks of presale as its earliest disciples are rewarded by a high APY on staking, currently at 193%.
You can assimilate with Token6900 on X, Instagram, or join the presale on the Token6900 website.
The post Shiba Inu Price Prediction: SHIB Launches Counter-Offensive Against Solana Rivals – New Meme Coin Trend Starting? appeared first on Cryptonews.
Some coins from the top 10 list have come back to the red zone today, according to CoinStats.CoinStats”>
The rate of Ethereum ![]() ETHUSD has risen by 1.19% over the last 24 hours.TradingView”>
ETHUSD has risen by 1.19% over the last 24 hours.TradingView”>
On the hourly chart, the price of ETH might have set a local resistance of $2,600. If buyers cannot seize the initiative by the end of the day, the correction is likely to continue to the support tomorrow.TradingView”>
On the bigger time frame, none of the sides is dominating as the rate of the chief altcoin is far from the support and resistance levels. If buyers want to keep the growth going, they need to restore the price above $2,646.
If that occurs, growth may lead to the test of the $2,700-$2,750 zone by the end of the week.TradingView”>
From the midterm point of view, the picture is similar. The volume keeps falling, which means neither buyers nor sellers are ready for a sharp move. In this case, sideways trading around the current prices is the most likely scenario.
Ethereum is trading at $2,567 at press time.
XRP is gaining renewed bullish traction this week as the token climbs to $2.30, backed by a mix of strong on-chain metrics, favorable technical indicators, and growing institutional interest.
After consolidating for over a month, XRP has rallied more than 20% over the last 16 days, sparking renewed confidence in a potential move toward the much-anticipated $3.40 target.
As of July 8, XRP price today hovers around $2.30, marking its highest level since late May. This recent surge comes after weeks of tight-range trading and signals a potential breakout in progress. XRP is now showing firm support in the $2.25–$2.26 zone, an area that has consistently absorbed sell pressure and helped fuel the current upward momentum.
XRP was trading at around $2.30 at press time. Source: XRP Liquid Index (XRPLX) via Brave New Coin
A key resistance zone has formed between $2.33 and $2.38, which traders are watching closely. A clean break above this band could pave the way for further gains toward $3.04, and ultimately the $3.40 target, if bullish momentum sustains.
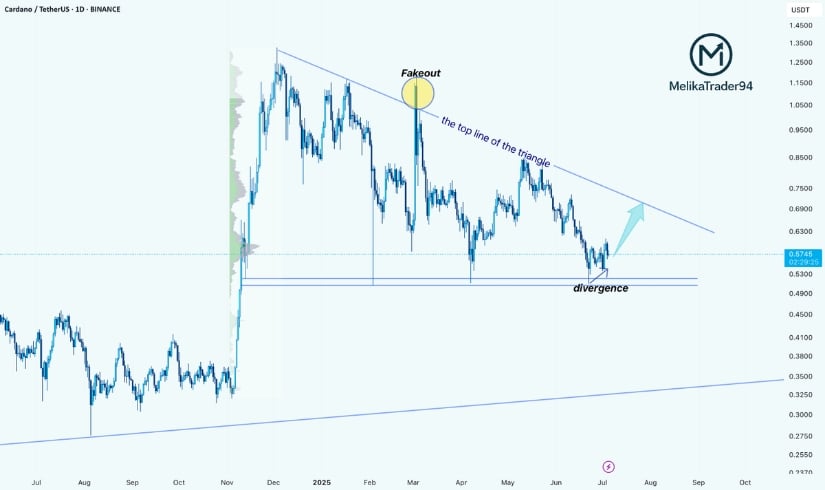
Additionally, XRP is forming a symmetrical triangle pattern that has been building since its $3.32 peak in March. With both trendlines nearing convergence, volatility tightening, and volume on the rise, a breakout appears increasingly likely.
Several technical factors support the bullish XRP price prediction. The MACD recently flashed a golden cross for the first time since May, suggesting a shift back to mid-term bullish momentum. Meanwhile, the Relative Strength Index (RSI) has reclaimed the neutral 50 level, indicating strengthening buying pressure.

While many anticipate a major XRP breakout, repeated daily closes below the 170-day trendline and a looming gravestone doji suggest a potential downside reversal. Source: VIAQUANT on TradingView
A crucial sign of market confidence lies in the trading volume. During peak activity on July 8, over 182 million XRP tokens changed hands, a clear signal that both retail and institutional investors are entering the market. This surge in participation comes as derivatives volume rose by 165%, with funding rates flipping positive—a traditional precursor to breakout rallies.
Renowned crypto analyst Ali Martinez pointed to a classic inverse head and shoulders pattern on the charts. If XRP successfully reclaims the $2.33 resistance, it could trigger a 12% rally, further reinforcing bullish expectations.
Beyond technicals, the XRP narrative is also being shaped by fundamental developments. Among the most impactful of these is the addition of XRP into Grayscale’s Digital Large Cap Fund, the asset’s return to institutions from prior regulatory limitations.
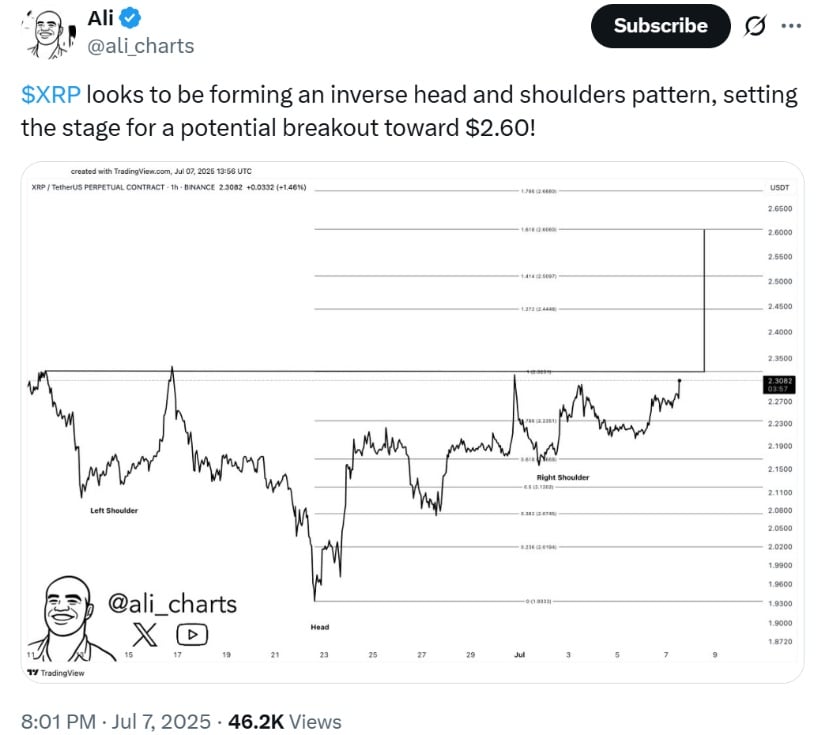
XRP appears to be forming an inverse head and shoulders pattern, indicating a potential breakout toward $2.60. Source: Ali Martinez via X
At the same time, Ripple’s pursuit of a US national bank charter is seen as a tipping point moment. If successful, Ripple would be permitted to operate as a federal-regulated trust bank, further tightening the integration of its services with traditional finance and cementing the long-term case for Ripple XRP usage in cross-border payments.
Following this bullish foundation is ongoing positivity regarding XRP spot ETF approvals. Ten XRP ETFs are pending approval by the U.S. Securities and Exchange Commission, with a likely announcement within October 2025. Approvals of such ETFs would unlock a wave of institutional fund inflows, potentially further increasing the XRP price projection 2025.
Looking ahead, analysts are largely optimistic about XRP’s trajectory. If it can hold above the $2.25 support area, XRP would push towards intermediate resistance at $2.69 and $3.04, before taking on the longer-term target at $3.40. A clear break above this level would place XRP in “blue skies” with minimal overhead resistance.
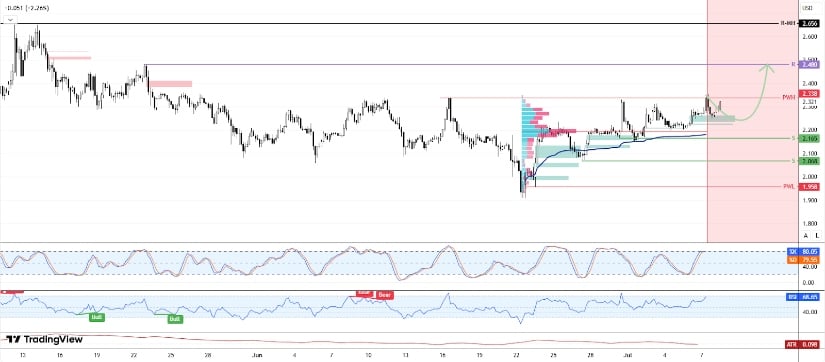
XRP price is likely to test the $2.33-$2.48 resistance zone following the current bullish momentum. Source: FenzoFxBroker on TradingView
In a longer-term bull story, technical targets via Fibonacci extensions point to the possibility of a rally to $4.36, nearly a 90% rise from here. Traders caution that momentum will have to be supported by either a regulatory spark like ETF approval or a significant rise in institutional demand, though.
The combination of positive technical patterns, growing institutional support, and long-term holder conviction is positioning XRP for a potentially explosive move. While resistance near $2.38 remains a hurdle, the broader setup—both on-chain and off—suggests that the current rally has deeper roots than speculative hype.
With regulatory clarity improving and the Ripple vs SEC court saga largely behind it, XRP is emerging as one of the most structurally bullish assets in the current crypto cycle. Whether it reaches $3.40 or beyond may depend on how quickly the next wave of capital arrives—and how resilient buyers remain in the face of volatility.
Solana (SOL) is back in the spotlight after blasting past $150, thanks to the launch of the first-ever SOL staking ETF. This major milestone has sparked a wave of institutional interest and triggered bullish Solana price predictions, with a few analysts speculating that SOL’s price could hit $500.
At the same time, JetBolt (JBOLT) is dominating headlines after selling more than 358 million tokens in its ongoing presale. This young altcoin is turning heads with cutting-edge features, including zero-gas technology and an AI-powered tool.
In this article, we’ll dive into the latest JetBolt presale surge and Solana price forecasts.
Solana Price Prediction: Will Solana Reach $500 After Staking ETF Launch?
On July 3, 2025, the first-ever Solana staking ETF debuted in the U.S. market. According to a Cointelegraph report by Martin Young, the REX-Osprey Solana Staking ETF recorded a jaw-dropping $12 million in inflows on its first day.
Chart showing Solana’s recent price trend. (Source: CoinGecko)
As a result, the SOL price surged past $153 before slightly pulling back to its current price of $152.64. The groundbreaking ETF launch also sparked bullish Solana price predictions, with some analysts eyeing a potential $500 rally.
While this recent development could catalyze a major SOL price surge, a jump to $500 appears unlikely in the short term. According to Arslan Butt’s analysis, SOL could break into the $180–$220 range if it maintains momentum above key moving averages.
Despite this, market watchers continue to await updates on a potential SOL spot ETF approval—another major catalyst that could potentially push the SOL price even higher.
JetBolt (JBOLT) Dominates Headlines with Over 358 Million Tokens Sold
As Solana’s $500 rally stalls, market observers are now closely watching the exciting developments surrounding a rising altcoin. JetBolt (JBOLT) is setting the market ablaze with its latest milestone. In a stunning display of early buyer demand, JetBolt’s presale has surged past 358 million tokens sold.
Fueling this explosive presale buzz are JetBolt’s state-of-the-art Web3 features, led by zero-gas technology. This Skale-powered innovation eliminates traditional gas fees on blockchain transactions—a total game-changer in today’s high gas fee environment.
But that’s not all. JetBolt is also drawing attention with its next-gen staking system. Beyond its easy-to-use interface, participants can earn additional tokens when they stake and connect with friends at the same time. This staking model adds a fun, social twist to traditional crypto staking.
JetBolt also boasts an AI-powered crypto insights and news tool. This intelligent utility delivers snippets of blockchain trends, crypto market updates, and other essential information about the Web3 space.
Early adopters are eagerly jumping into JetBolt’s presale thanks to its appealing perks. Presale buyers can score up to 25% extra tokens when they purchase Alpha Boxes or JBOLT tokens in bundles.
Overall, JetBolt’s tech-forward features and generous bonuses are why its ongoing presale is dominating the headlines.

Final Thoughts—Solana’s Price Direction and JetBolt Presale Frenzy
Solana’s ETF launch is a historic milestone—one that helped catapult SOL toward $150 amidst market uncertainty. While a $500 price prediction target may be far-fetched for now, it still positions Solana as one of the top altcoins to watch this cycle.
Meanwhile, JetBolt continues to impress the crypto community with its presale milestones. JetBolt’s user-centric features, such as gas-free functionality, social staking, and an AI-driven tool, are helping it stand out as one of the best new cryptocurrencies worth exploring.
Dive deeper into the JetBolt presale by visiting the official JetBolt website now.
This article does not offer financial or crypto trading advice. Crypto assets are volatile and come with risk. Conduct thorough and independent research before making a purchase.
Dogecoin price recently hit $0.1677, with a market cap of $25.16 billion and $1.03 billion in 24-hour volume. A modest 3.01% uptick over seven days has reignited interest in DOGE, especially among crypto analysts and retail traders. With whale wallets on the rise and transaction activity climbing, analysts are eyeing a possible breakout by July 2025. Amid slowing traction across other altcoins, Dogecoin remains attractive for its strong liquidity and loyal meme-powered community.
Meanwhile, Arctic Pablo Coin ($APC) is quietly building momentum with a bold and immersive narrative tied to exploration and mythical adventures. As it enters its 31st presale location, Frigid Fortress, Arctic Pablo has raised over $2.9 million, with a projected 1602% ROI from presale to listing. This meme coin is far from ordinary: it blends high-yield staking (66% APY), a gamified journey through frozen landscapes, and a roadmap focused on bridging myth and blockchain reality. Investors are taking note not just for the fun but for the fundamentals, built on Binance Smart Chain, accepting major cryptos, and driven by one of the most creative stories in the space. Arctic Pablo is quickly earning its place among the best crypto to buy today.
Dogecoin’s recent price movement to $0.1677 marks a fresh wave of optimism in a market that has been relatively subdued over the past month. With a market cap now sitting at $25.16 billion and a 24-hour trading volume of $1.03 billion, DOGE has re-entered the spotlight. Unlike earlier surges driven by hype and celebrity endorsements, this current upswing appears to have deeper roots. Analysts suggest that a convergence of factors: on-chain whale accumulation, increased retail interest, and macroeconomic stability, is driving the surge.
Additionally, sentiment on platforms like TradingView and LunarCrush is reflecting a bullish consensus, with social metrics hitting monthly highs. More than just a price pump, this 3.01% weekly uptick could be the prelude to a breakout attempt above the $0.1750 resistance. The question is whether Dogecoin has the momentum to sustain this bullish trajectory through July 2025.
Whales, wallets holding over 1 million DOGE, are rapidly expanding. According to blockchain intelligence platforms like Messari and IntoTheBlock, there has been a 5% increase in these wallets since May 2025, indicating renewed confidence from big-money players. These large holders aren’t in it for quick flips. Instead, they’re displaying accumulation behavior reminiscent of the 2021 rally, where institutional interest preceded DOGE’s parabolic rise.
A notable shift is also being observed in how these whales behave. They are engaging in long-term holding patterns and participating in governance conversations about DOGE’s roadmap, especially regarding potential Layer 2 implementations and developer activity. Some analysts believe this whale activity is preparing the ground for a much larger move, as these stakeholders tend to front-run major market cycles.
Daily trading volume exceeding $1 billion is no small feat in today’s market, and it speaks volumes (pun intended) about Dogecoin’s enduring popularity. Blockchain explorers such as Blockchair and Dogechain.info reveal a steady increase in wallet activations, averaging over 12,000 new addresses daily, and rising transaction throughput that’s beginning to challenge top-tier altcoins.
Developers are also pushing the ecosystem forward. Projects under development include DOGE Layer 2, which could drastically reduce transaction fees and increase scalability. There’s also increased chatter about DOGE being integrated into tipping systems on regional social media apps in Latin America and Southeast Asia. If implemented, these integrations could unlock new user bases in emerging markets, reinforcing DOGE’s daily utility and supporting price growth.
Technical indicators suggest that DOGE may be primed for a short-term rally. On TradingView, the Relative Strength Index (RSI) remains above 60, while the MACD lines are converging in a bullish pattern. These signals often precede strong breakouts in altcoins, particularly when supported by increasing volume.
If Dogecoin manages to close above $0.1750 in the coming weeks, it could ignite a FOMO-driven buying spree that pushes the price beyond the psychological $0.20 mark. However, this scenario depends heavily on macroeconomic stability, especially U.S. Federal Reserve decisions and general sentiment around crypto regulation. If external conditions remain calm, analysts forecast a 60% probability of DOGE hitting $0.20 before July ends.
Looking beyond July, many analysts believe Dogecoin could touch $0.25 to $0.30 by Q4 2025. This outlook is based on several factors: upcoming Layer 2 upgrades, rising social traction, and growing adoption in emerging economies. Some Latin American and Asian e-commerce platforms are reportedly experimenting with DOGE-based payment integrations, which could add tangible demand.
If developers meet roadmap deadlines and Layer 2 launches on schedule, Dogecoin’s speed and scalability could improve dramatically. That kind of infrastructure expansion, coupled with consistent meme engagement, might push DOGE into the top five cryptocurrencies by volume, reinforcing its value proposition as both a cultural and transactional asset.
Despite a nearly 3% weekly gain, many experts believe DOGE is still trading below its intrinsic value. Its $25B+ market cap, combined with high liquidity, decentralized adoption, and global meme culture integration, gives it a strong foundation for future growth.
Dogecoin’s no-frills model is exactly what makes it powerful: no complex tokenomics, no central team pushing updates, it simply works. And in a world overflowing with over-engineered projects, simplicity might be the smartest strategy. That’s why DOGE remains one of the best crypto assets to buy today.
Arctic Pablo Coin ($APC). Currently stationed at its 31st presale location, Frigid Fortress, APC has already raised over $2.9 million, with a jaw-dropping 1602% projected ROI from its presale price to a launch target of $0.008. This isn’t your average meme coin. Arctic Pablo is backed by an adventurous lore of exploration and powered by real utility on the Binance Smart Chain, making it one of the most compelling picks for anyone hunting the best crypto to buy today.
What sets Arctic Pablo Coin apart is its fusion of myth and mechanism. With 66% APY staking, gamified presale maps, and multi-currency support, it turns passive investment into an interactive journey. The project’s unique format isn’t just for show—it’s part of a broader mission to redefine what meme coins can be. For those seeking real returns and deeper engagement, Arctic Pablo makes a strong case as the best crypto to buy today, especially before the next presale launches.
According to its developers, Arctic Pablo is built with a community-first ethos, rewarding early believers through deep staking incentives and a deflationary token model. Its growing online traction and rapid presale momentum signal serious investor interest. As the crypto crowd begins to catch on, this frosty meme coin might just be the next one to melt the charts. Missed Dogecoin? Arctic Pablo could be your redemption story—and arguably the best crypto to buy today before it breaks out.

Dogecoin continues to evolve from meme to movement. The $0.20 mark is within reach as whales accumulate, institutions warm up, and global users engage with the coin’s culture and utility. It’s clear that DOGE, with its loyal community and growing use cases, remains one of the best crypto to buy today for both seasoned investors and newcomers alike.
At the same time, Arctic Pablo Coin is proving to be a dark horse in the meme coin space. With its narrative-rich roadmap, staking rewards, and explosive ROI potential, Arctic Pablo is climbing the ranks fast and earning recognition as another best crypto to buy today during presale season.
As July 2025 unfolds, all eyes are on the clash between the legendary DOGE and the mythical APC, two meme coins with different strengths but the same goal: becoming the most rewarding and talked-about investment in the market. Whether you’re betting on history or chasing the next big thing, both coins are positioned as top contenders among the best cryptos to buy today.
Dogecoin had its moment—Arctic Pablo’s is loading. Join the myth, stake for 66% APY, and claim your place in the next crypto legend today.

Arctic Pablo Coin: https://www.arcticpablo.com/
Telegram: https://t.me/ArcticPabloOfficial
Twitter: https://x.com/arcticpabloHQ
Dogecoin (DOGE) is gaining momentum again, trading at $0.1677 with rising whale activity, strong community support, and potential to hit $0.20 in July 2025. It remains one of the best crypto to buy today for stability and brand strength.
Arctic Pablo Coin (APC) is the rising star, currently in presale with a projected 1602% ROI. Built on Binance Smart Chain with 66% APY staking and a mythical theme, it’s drawing investor attention fast.
DOGE is the proven leader; APC is the high-potential newcomer. Both are top contenders among the best cryptos to buy today.
This article is not intended as financial advice. Educational purposes only.
Cardano is at a crucial juncture, testing key support at $0.58 with the potential for a breakout or pullback
Cardano is at a pivotal point, with the price testing key support levels and volume spiking. The next few moves could decide if ADA price pushes towards a breakout or faces a pullback.
Looking at Cardano’s short-term bubble risk, things aren’t as heated as they may seem. According to the latest data shared by Into The Cryptoverse, the bubble risk index for ADA is hovering at a moderate level, just under 1. This indicates that while the market is showing some signs of growth, it hasn’t reached an overheated state yet. For ADA, the absence of a red spike suggests there’s no immediate danger of a major correction or unsustainable rise.
Cardano maintains a healthy room for rally with moderate bubble risk. Source: Into The Cryptoverse via X
This presents a healthy situation for Cardano. The absence of excessive bubble risk means the current rally could be more sustainable. ADA is in a position where it can build on its momentum without triggering any sudden crashes. As long as price stability holds and the momentum continues in the current range, ADA has the potential to see steady growth, with buyers likely to continue positioning in anticipation of future upside.
ADA Cardano price is currently testing a critical weekly support zone at $0.58, which has held firm despite recent market pressures. The price is holding strong at this level, offering a solid foundation for a potential rebound. Analyst Cryptobutche highlights, while the MACD is not yet showing positive momentum, it is nearing a bullish crossover, suggesting that selling pressure could soon ease. This would pave the way for a potential surge, as the market sentiment shifts in favor of the bulls.

ADA price holds key support at $0.58, setting up for a potential bounce. Source: Cryptobutche via X
Adding to the bullish case, the short-term bubble risk for ADA is still within healthy limits, indicating that the current rally has room to run without the risk of overheating. With ADA holding key support and the bubble risk at moderate levels, the market seems in a good position for further upside. If the price stays above the $0.58 support and the MACD confirms the bullish crossover, ADA could be on track to challenge resistance levels and push toward the $1 range in the coming weeks.
In a recent development from TapTools, ADA Cardano price has recorded over $381 billion in trading volume over the last 12 months, marking its position as one of the most traded crypto assets globally. This surge in trading volume aligns with the ongoing interest in ADA. Cardano has managed to hold support at key levels, with the price testing the $0.58 range. The recent volume spikes further validate the strength of this support zone and suggest that ADA is seeing added activity around the support zone.
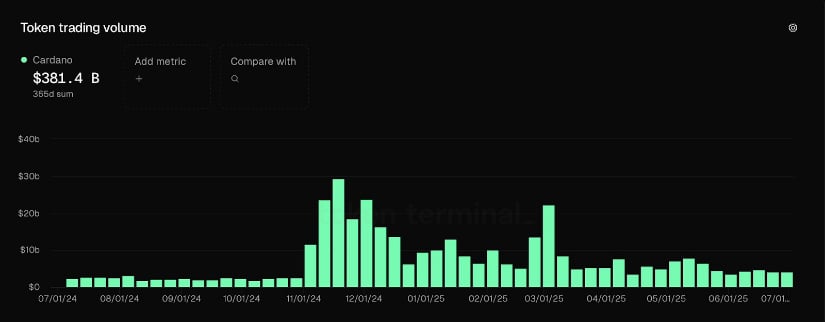
ADA Cardano records over $381 billion in trading volume. Source: TapTools via X
Building on this momentum, if ADA can continue to hold support and keep its trading activity high, it’s likely to gain momentum and challenge upper resistance levels, including the critical $1 mark. This positions Cardano for a possible bullish continuation for the rest of 2025.
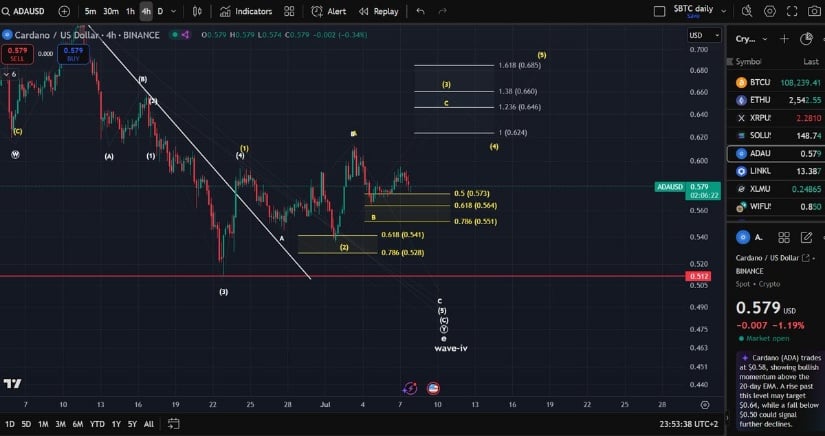
Building on ADA’s recent bounce from key support near $0.58, the daily chart shared by best_analysts now shows a well-defined descending triangle forming. Price has tested the lower boundary around $0.52 to $0.53 multiple times and continues to hold it, which lines up with the earlier support structure. A bullish divergence has also emerged, adding strength to the setup as momentum begins to turn.
Price eyes a breakout above $0.60, targeting $0.67-$0.70, with $0.52 as key support. Source: best_analysts via X
If ADA can break through the triangle’s upper resistance near $0.60, it opens up room for a push toward $0.67 to $0.70. However, the base must hold. A daily close below $0.52 would invalidate this breakout thesis and signal caution. For now, the technicals suggest ADA is nearing a make-or-break moment.
While Cardano continues to show resilience near the $0.58 support, a closer look at the wave structure from Manofbitcoin suggests there’s more going on under the surface. The current move higher is unfolding within a corrective wave, with the yellow bullish path still intact, but barely. The chart highlights that if ADA breaks and holds below $0.551, it could confirm the beginning of a wave-c leg to the downside, derailing the emerging bullish outlook.
ADA price faces hidden risk, with a break below $0.551 signaling potential downside. Source: Manofbitcoin via X
This stands in contrast to the recent triangle breakout potential and volume-led support. While other participants point to strength in trading activity and stable sentiment, this wave-based outlook is creating a sign of caution. If bulls lose grip on this zone, it would shift short-term momentum back toward sellers.
Cardano’s current market position presents a delicate balancing act. On one hand, the technicals and volume suggest ADA has solid momentum, particularly with the key $0.58 support holding firm. On the other hand, if the price breaks below $0.52, the bullish narrative could quickly unravel, giving way to a bearish shift in momentum.
ADA Cardano price is at the crossroads. Participants should stay alert to any signs of market pressure or price action that might signal a shift in momentum. Cardano has the room to run, but it needs to maintain its weekly support to keep the bullish scenario alive.
Crypto investors brace for the next major bull cycle, two high-potential projects are capturing attention for very different reasons—Solana (SOL) and Ozak AI (OZ). Solana, known for its lightning-fast transactions and scalable smart contract platform, is already a household name in the crypto world.
Ozak AI, by contrast, is an emerging force in the AI-blockchain sector, offering predictive analytics powered by decentralized intelligence. But when it comes to massive upside—like a realistic 100x gain—who holds the edge?
Solana Price Forecast 2025
Solana is currently trading near $145 after seeing a slight correction in recent weeks. Its infrastructure supports thousands of transactions per second, and it has built a robust ecosystem that includes DeFi protocols, NFT marketplaces, and even Solana Mobile. With developers actively building and institutional capital showing interest, SOL continues to be a blue-chip layer-1 blockchain.
However, while Solana’s tech is impressive, its path to a 100x return would require a market cap that rivals the entirety of today’s crypto market. For example, a 100x move from $140 would push SOL to $14,000 per token—an ambitious figure by any measure. While Solana may very well retest its all-time high of $294 or even double or triple that during the next bull run, it is unlikely to deliver the kind of explosive returns that early-stage investors crave.
Youtube embed:
Ozak AI: Smart AI for Smarter Investments
Ozak AI is currently in its fourth Ozak AI presale stage at just $0.005. It’s not a general-purpose blockchain but a specialized AI-powered data analytics platform designed for real-time financial forecasting. By fusing decentralized data infrastructure with machine learning models, Ozak AI offers investors a suite of tools including customizable Prediction Agents (PAs), a high-throughput data stream network (OSN), and secured analytics through DePIN technology.

The AI narrative is red-hot—and growing. As businesses and individuals increasingly rely on intelligent tools to parse complex data and predict trends, Ozak AI positions itself at the intersection of artificial intelligence and decentralization. This dual appeal could give it massive traction in 2025, especially as traditional DeFi and blockchain projects mature.
A move from $0.005 to $1 would represent a 200x return—and even a modest breakout to $0.50 is a 100x jump. With its low market cap, early-stage access, and strong utility narrative, Ozak AI offers asymmetric risk-reward that Solana can’t match from its current valuation.
Solana vs Ozak AI: Which One Has More Room to Grow?
Solana’s value lies in its network strength, broad adoption, and established reputation. It’s a solid investment for those seeking steady, high-cap projects. But for those aiming for massive ROI, Ozak AI presents a unique opportunity to get in before the crowd, especially as AI integration becomes the next big thing in crypto.

Solana remains a core layer-1 project and a strong long-term project, but its ceiling for explosive growth is limited due to its already significant market cap. Ozak AI, though riskier, brings innovation, AI-driven utility, and early-stage pricing—all the ingredients needed for a potential 100x breakout. For aggressive investors in 2025, smart AI may very well outperform smart contracts.
About Ozak AI
Ozak AI is a blockchain-based crypto task that provides an innovative platform that focuses on predictive AI and advanced data analytics for financial markets. Through machine learning algorithms and decentralized community technologies, Ozak AI enables real-time, accurate, and actionable insights to help crypto lovers and corporations make the perfect choices.
For more, visit:
Website: https://ozak.ai/
Telegram: https://t.me/OzakAGI
Twitter : https://x.com/ozakagi
Disclaimer: This is a paid post and should not be treated as news/advice. LiveBitcoinNews is not responsible for any loss or damage resulting from the content, products, or services referenced in this press release.
XRP is once again the center of market speculation, with bullish sentiment surging after a massive whale withdrawal from Coinbase sent ripples through the community.
Now trading above $2.27, XRP’s recent price action and on-chain developments are fueling expectations of a breakout—potentially leading to a 600% rally if historical patterns repeat.
Crypto analysts are now watching XRP closely as it emerges from a long consolidation phase, with tightening technical indicators and institutional interest aligning for what could be the biggest move in years.
A large XRP transaction on July 5 has caught the market’s attention. According to on-chain data, 779,321.94 XRP—worth over $1.7 million—was transferred from a Coinbase wallet to an unknown private address. While the fee was minuscule (just 0.00002 XRP), the timing and size of the move have led to speculation that a major player is preparing for a significant price breakout.
A transfer of 779,321 XRP from Coinbase to a private wallet has sparked speculation of a major upcoming move. Source: Captain Redbeard via X
Crypto commentators quickly flagged the move, with some calling it a signal that “smart money” is positioning ahead of a big market shift. Given XRP’s 32-week-long price consolidation and the narrowing of Bollinger Bands—now at their tightest in over eight months—this transfer is being interpreted by traders as more than a routine withdrawal.
“It’s not retail,” said one crypto commentator on X. “Someone’s gearing up for something major.”
This whale movement has reignited talk of a parabolic rally, especially as Ripple pushes forward with its U.S. banking license application and ETF speculation gains traction.
Adding to the momentum, XRP-related investment products saw $10.6 million in weekly inflows, according to CoinShares. That brings XRP’s total assets under management to $1.4 billion, part of a broader $1.03 billion influx into crypto markets last week—most of it from the U.S.
This institutional buying spree signals renewed confidence in XRP’s long-term prospects. “Price gains over the week pushed total assets under management to a new all-time high of $188 billion,” CoinShares noted, highlighting a wave of optimism across the digital asset sector.
Futures market activity is mirroring this optimism. Open Interest in XRP futures surged by 25% to $4.69 billion, while daily trading volume hit $4.72 billion. These spikes in derivatives activity typically reflect increased speculative interest and a bullish shift in sentiment.

XRP’s weekly chart shows a double bottom with hidden bullish divergence, suggesting a breakout toward $4.50–$5 is increasingly likely. Source: Juan-Wick on TradingView
Technically, XRP is showing strength. It’s printed two consecutive green daily candles, and the MACD has issued a bullish crossover. The Relative Strength Index (RSI) has climbed to 57, suggesting sustained upward momentum. Key resistance levels lie at $2.33 and $2.47, with a potential retest of the May high at $2.65 on the horizon.
However, traders should keep an eye on macro risks, including potential volatility from expiring U.S. tariff exemptions. In the event of a dip, XRP has solid support between $2.00 and $2.22, bolstered by the 100-day EMA.
The idea of a 600% rally isn’t pulled out of thin air. Analysts are pointing to XRP’s explosive history as evidence it could repeat such a move. During the 2017 bull run, XRP surged from $0.0055 to $3.80—a staggering 68,990% gain. More recently, from November 2024 to January 2025, XRP rallied 580%, moving from $0.50 to $3.40.
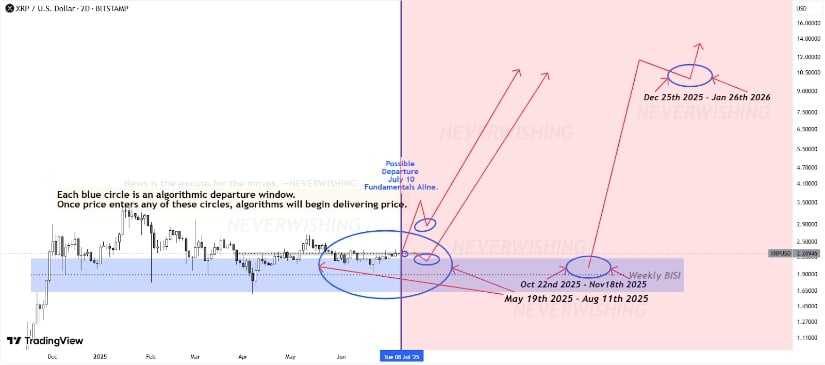
This XRP analysis identifies “algorithmic departure windows”—zones where price historically initiates explosive moves toward the $10-$16 zone. @Brett_Crypto_X on TradingView
Applying a similar growth model to the current price of $2.28, some analysts now project a possible move toward $16, while others see a more conservative target around $4.60, XRP’s previous all-time high.
Looking far ahead, forecasts for XRP’s long-term potential vary widely. According to Telegaon, XRP could reach $119 to $160 by 2040, turning a $5,000 investment today into $354,000. Changelly offers an even more bullish scenario, projecting XRP could hit $1,938 by 2040—transforming a $5,000 stake into over $4.28 million. Even Google’s Gemini AI predicts a more cautious but still impressive $64.20, which would grow $5,000 into $142,000.
These forecasts highlight the high-risk, high-reward nature of XRP as a long-term asset.
While the Ripple vs. SEC lawsuit is no longer front-page news, its resolution continues to shape sentiment. Any new update on the SEC appeal, XRP ETF approval, or Ripple’s regulatory progress could act as a major catalyst—or a stumbling block—for the token.
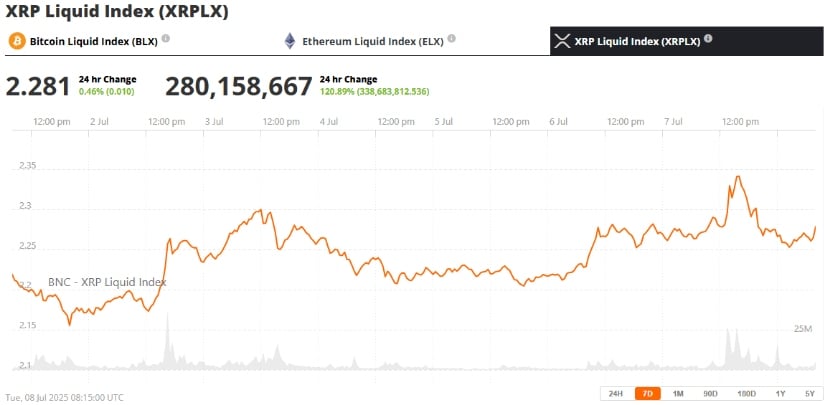
XRP was trading at around $2.28, up 0.46% in the last 24 hours at press time. Source: XRP Liquid Index (XRPLX) via Brave New Coin
For now, investor focus has shifted more toward capital flows, technical indicators, and real-world adoption. But legal clarity remains an essential part of XRP’s broader investment case.
With a major whale transfer, institutional buying on the rise, tightening technical patterns, and Ripple’s push into U.S. banking and ETF territory, XRP appears poised for a major move. A breakout above $2.65 could pave the way for a rally toward $4.60, or even higher.
Still, volatility remains a factor. Investors should stay tuned to macro headlines and XRP court case developments that could sway sentiment. For now, the outlook remains decidedly bullish, and XRP continues to position itself as a leading contender in the evolving digital asset space.
Key points:
Bitcoin is facing selling near $110,500, but the bulls are expected to aggressively defend BTC price at its key moving averages.
XRP is trying to break above its immediate overhead resistance level.
Bitcoin (BTC) continues to face selling near the $110,500 level, indicating that the bears are vigorously defending the level. A positive sign in favor of the bulls is that they have not allowed the price to dip below the moving averages. That suggests the bulls are hanging on to their positions and not hurrying to book profits.
Analysts point out that the bands in the Bollinger Bands indicator are getting squeezed, suggesting a sharp move may be around the corner. Bollinger Bands creator John Bollinger said in a post on X that Bitcoin could be “setting up for an upside breakout.”
Investors have not given up as they continue to pump money into Bitcoin exchange-traded products (ETPs), which recorded $790 million in inflows for the trading week ended Friday, per CoinShares data. There was a marginal slowdown in inflows compared to the previous three weeks, which witnessed $1.5 billion in inflows.
CoinShares head of research James Butterfill said the drop in inflows suggests a cautious approach from the investors as Bitcoin approaches its all-time high.
Will bears pull Bitcoin below the moving averages, or could buyers defend the level? How are the altcoins likely to behave? Let’s analyze the charts of the top 10 cryptocurrencies to find out.
The S&P 500 Index (SPX) extended its uptrend last week, indicating sustained demand from the bulls at higher levels.

Usually, after breaking out of a significant resistance, the price turns down and retests the breakout level. Therefore, a retest of the 6,147 level is possible. If the price turns up sharply from 6,147, it suggests the bulls have flipped the level into support. That increases the likelihood of the continuation of the uptrend. The index may then rally toward 6,500.
Sellers will have to yank the price below the 20-day exponential moving average (EMA)(6,099) to weaken the bullish momentum. The index may then plummet to the 50-day simple moving average (SMA) (5,904).
The US Dollar Index (DXY) turned up from the 96.37 level on Tuesday, indicating demand at lower levels.

The pullback could reach the breakdown level of 97.92, where the bears are expected to sell aggressively. If the price turns down sharply from 97.92, it suggests that the bears are trying to flip the level into resistance. That increases the risk of a break below 96.37. The index may then drop toward the 95 level.
Conversely, a break and close above the 97.92 level suggests the bulls are on a comeback. The index could then rise to the 50-day SMA (99.03). This is an important level to keep an eye on because a break above it could drive the index to the 100.54 level and then to the 102 resistance.
Bitcoin has been oscillating between the 20-day EMA ($107,211) and the overhead resistance of $110,530.

This tight range trading is unlikely to continue for long. Although a range expansion is around the corner, it is difficult to predict the direction of the breakout. If the price turns down and plunges below the moving averages, the BTC/USDT pair could descend to $104,500 and later to $100,000.
On the contrary, a break and close above $110,530 opens the gates for a rally to $111,980 and then to the neckline of the inverse head-and-shoulders pattern. A close above the neckline could start the next leg of the uptrend toward $150,000.
Ether (ETH) has been stuck inside the $2,738 to $2,323 range for several days, with attempts to break and sustain the price above and below the range being unsuccessful.

Buyers are trying to push the price above $2,635, clearing the path for a rally to $2,738. Sellers are expected to fiercely defend the $2,738 to $2,879 zone. If the price turns down from the overhead zone, the ETH/USDT pair could find support at the 20-day EMA. If the price bounces off the 20-day EMA, the bulls will again try to drive the pair above $2,879.
On the downside, a break and close below the 20-day EMA suggests the pair may extend its stay inside the range. Sellers will be back in the driver’s seat on a close below $2,111.
Buyers have managed to sustain XRP (XRP) above the 20-day EMA ($2.20) for the past few days, signaling a lack of aggressive selling by the bears.

The 20-day EMA has started to turn up, and the RSI has jumped into the positive zone, indicating the path of least resistance is to the upside. There is resistance at $2.34, but it is likely to be crossed. The XRP/USDT pair could climb to $2.48 and subsequently to $2.65. Buyers will have to overcome the barrier at $2.65 to start a new up move toward $3.
Contrarily, if the price turns down and breaks below the 20-day EMA, it suggests the pair may swing between $2.34 and $2 for a while longer.
BNB (BNB) bounced off the 20-day EMA ($652) on Saturday, indicating that the sentiment remains positive and traders are buying on dips.

The upsloping 20-day EMA and the RSI just above the midpoint indicate a slight edge to the bulls. If the $665 resistance falls, the BNB/USDT pair could rise to $675 and then to $698. Sellers are likely to pose a solid challenge at $698 because a break above it could propel the pair to $732.
This optimistic view will be negated in the near term if the price turns down and breaks below the moving averages. The pair may then drop to $636.
The bulls managed to push Solana (SOL) above the 20-day EMA ($149) on Sunday but are struggling to break above the 50-day SMA ($154).

The 20-day EMA has flattened out, and the RSI is just above the midpoint, indicating a balance between supply and demand. Buyers will have the upper hand if they push the SOL/USDT pair above $159. That opens the gates for a rise to $185. There is minor resistance at $168, but it is likely to be crossed.
The first support on the downside is at $145 and then at $137. A break below $137 tilts the advantage in favor of the bears. The pair may then tumble to $126.
Related: 4 signs that the Ethereum price uptrend to $5K is back in play
Dogecoin (DOGE) has broken above the 20-day EMA ($0.16), suggesting that the bulls are attempting a comeback.

If buyers maintain the price above the 20-day EMA, the DOGE/USDT pair could rise to the 50-day SMA ($0.18) and later to $0.21. Sellers are expected to defend the $0.21 level, but if the buyers prevail, the pair could soar to $0.26.
Instead, if the price turns down from the current level and breaks below the 20-day EMA, it suggests that the bears are selling on every minor rally. That could sink the pair to the $0.14 support.
Cardano (ADA) has been clinging to the 20-day EMA ($0.58), indicating that the bulls have kept up the pressure.

The flattening 20-day EMA and the RSI just below the midpoint suggest the selling pressure is reducing. If buyers drive the price above the 20-day EMA, the ADA/USDT pair could rally to the 50-day SMA ($0.64) and then to the downtrend line. The bulls will have to push and sustain the price above the downtrend line to signal a potential trend change.
Sellers will have to drag the price below the $0.50 support to complete the bearish descending triangle pattern. That may start a downward move to $0.40.
Buyers have managed to keep Hyperliquid (HYPE) above the 20-day EMA ($38.41) for the past few days, indicating demand at lower levels.

However, a negative sign is that the bulls have failed to drive the price above the near-term resistance of $41.23. If the price turns up from the current level or the 20-day EMA and breaks above $41.23, it signals that the bulls are back in the driver’s seat. The HYPE/USDT pair could surge to the $42.50 to $45.80 resistance zone.
The first sign of weakness on the downside will be a break and close below the 50-day SMA ($36.60). That opens the doors for a fall to $33.25 and later to $30.69.
This article does not contain investment advice or recommendations. Every investment and trading move involves risk, and readers should conduct their own research when making a decision.


 (@MustStopMurad)