The main category of Crypto News.
You can use the search box below to find what you need.
[wd_asp id=1]
The main category of Crypto News.
You can use the search box below to find what you need.
[wd_asp id=1]
Most of the coins keep setting new local peaks today, according to CoinStats.CoinStats”>
The rate of Bitcoin ![]() BTCUSD has gone up by 0.46% over the last day.TradingView”>
BTCUSD has gone up by 0.46% over the last day.TradingView”>
On the hourly chart, the price of the main crypto is going down after a breakout of the local support of $108,696.
If the situation does not change by the end of the day, the correction is likely to continue to the $108,000 mark by tomorrow.TradingView”>
On the longer time frame, bulls have failed to keep maintaining growth after yesterday’s bullish bar closure. If nothing changes by the end of the day, there is a chance to see a test of the $107,000 by the end of the week.TradingView”>
From the midterm point of view, bulls are more powerful than bears, as the rate of BTC is closer to the resistance than to the support. However, if sellers seize the initiative and the candle closes near $105,000, one can expect a correction to the $100,000 area.
Bitcoin is trading at $108,380 at press time.
As momentum builds across the crypto market, Bitcoin and Solana are emerging as two of the most closely watched assets due to their strong technical setups.
Recent chart patterns suggest both are forming a classic “cup and handle” formation on the monthly timeframe—a historically bullish structure known for signaling major upward moves. Traders are increasingly optimistic that if this pattern completes, it could trigger significant rallies for both assets.
While Bitcoin has already begun to break out of the handle portion of the formation, Solana is still in the process of positioning itself for a potential breakout. The setup is particularly compelling because it mirrors a pattern that previously led to explosive gains during prior bull cycles.
Bitcoin is currently exhibiting a classic cup and handle formation on the monthly chart, a well-known bullish technical pattern. If this pattern plays out fully, analysts predict a potential price target of $230,000.
This outlook is supported by Bitcoin’s recent consolidation phase, where it has spent seven weeks trading within a narrow range, fueling anticipation of a breakout.
A decisive move beyond the $110,000 level could trigger a powerful rally, with the long-term structure suggesting a continuation beyond its previous all-time highs from 2021.
While this forecast may seem ambitious, it aligns with some year-end 2025 predictions and reflects growing optimism among traders watching for confirmation of the breakout.
Source – ClayBro on YouTube
Solana is also forming a similar pattern and is considered by some to be mirroring Bitcoin’s bullish structure. If the breakout materializes, the projected upside for Solana is striking, with targets nearing $4,390 per coin—representing potential gains close to 3,000%.

However, unlike Bitcoin, Solana has yet to complete its breakout, and it must first surpass the key resistance near the $300 level. While such explosive growth may appear excessive, the possibility remains if overall market momentum supports another altcoin surge.
While exact targets remain speculative, the broader takeaway is clear: both Bitcoin and Solana are showing signs of bullish momentum building under the surface.
If both assets fulfill the potential of their technical patterns, the ripple effect on altcoins, particularly within the Solana ecosystem including meme coins and DeFi projects, could be significant.
One such project is Snorter Token (SNORT), which is gaining early traction as one of the newest entries in the Solana ecosystem, presenting itself as a Telegram-based crypto trading bot designed specifically for meme coin and on-chain traders.
Currently in the early stages of its presale, the project has already raised over $1.6 million, indicating strong initial interest. Its main appeal lies in its potential to offer a real, functional product that provides fast, low-cost trading capabilities directly within Telegram.
Snorter Token stands out with a comprehensive set of features designed for both new and experienced crypto traders. Its tools include automated sniping for new token listings, on-chain limit orders, copy trading, and protections against honeypots and rug pulls.

The platform also offers a user-friendly dashboard that works seamlessly with a simple wallet connection. It also supports seamless cryptocurrency swaps and aims to deliver robust front-end trading tools, giving users more control over their transactions without needing centralized exchanges.
The team is prioritizing early product development, aiming to achieve product-market fit—a crucial milestone for long-term sustainability. Although team and location details remain undisclosed, this is typical for early-stage crypto projects.
The project’s vision centers on delivering practical functionality and utility within the Solana meme coin trading space. By offering practical tools and an intuitive user experience, Snorter Token hopes to attract a growing audience looking for more efficient ways to navigate volatile meme coin markets.
As the product evolves, Snorter Token has the potential to generate actual revenue, opening the door for future incentives like revenue sharing or staking rewards. For now, early participants can purchase tokens at $0.0975 each using a bank card or crypto via the Best Wallet app.
The project’s focus on building a usable bot with real-time features positions it as one to watch among emerging Solana-based tools. With the right development and adoption, Snorter Token could find its place in the competitive landscape of Telegram trading bots.
This article has been provided by one of our commercial partners and does not reflect Cryptonomist’s opinion. Please be aware our commercial partners may use affiliate programs to generate revenues through the links on this article.
As the Ethereum network witnessed a substantial increase in user activity and the adoption of decentralized applications (DApps), the need for scalability became a prominent issue for the first Layer-1 smart contract blockchain. To tackle this challenge, various Layer-2 scaling solutions were introduced to mitigate scalability concerns.
Among these scaling solutions, the Build ‘N Build (BNB) Chain has emerged as a competitive player by offering asset-bridging capabilities across different chains. This has provided the BNB Chain with a distinct advantage over established platforms like Ethereum, enabling it to address the scalability limitations and cater to the growing demands of the DApp ecosystem.
The BNB Chain, established in February 2022, is a comprehensive modular system that combines the advancements of the Binance Chain (BC) and the Binance Smart Chain (BSC). The introduction of the BNB Smart Chain (BSC) was a response to certain limitations observed in the BC to complement its functionality.
While the BC was primarily designed to cater to decentralized exchanges (DEX) and focused on achieving high transaction throughput and delivering an enhanced user experience, it lacked smart contract functionality. Instead of incorporating additional functionality into the BC, which could have impacted network efficiency, the Binance community developed the BSC as a separate entity to address these concerns and provide the desired smart contract functionality.
After the merger of both chains, the BC assumed the role of a dedicated layer for governance, encompassing voting and staking functionalities. On the other hand, the BSC was specifically designed to execute Ethereum Virtual Machine (EVM) consensus and support Ethereum-compatible applications, including MetaMask. This strategic implementation allows for seamless integration with smart contracts on the BSC
The BNB team is led by Changpeng Zhao “CZ,” the founder of Binance, who introduced the BNB token and established the BNB Chain in 2017. Another key member of the team is He Yi, the co-founder and chief marketing officer. Before joining Binance, Yi served as Vice President at Yixia Technology, a leading mobile video tech company.
BNB, the native utility token of the BNB Chain, plays a pivotal role within the BSC ecosystem. As the governance token, BNB enables holders to actively participate in shaping the development and future of the ecosystem. Additionally, BNB is essential for developers seeking to participate in token sales conducted on the Binance Launchpad.
The BNB token operates under specific tokenomics. It has a maximum capped supply of 200,000,000 tokens, and a deflationary burning mechanism is in place to gradually reduce the supply to 100,000,000 coins. Currently, the total supply of BNB is 157,900,174, with 157,886,280 tokens currently in circulation.
In recent years, the use cases of BNB have expanded significantly, offering a range of functionalities. These include participating in governance proposals through voting, staking to contribute to the network’s security, utilizing BNB as collateral for loans on decentralized finance (DeFi) platforms, and covering transaction fees within the Binance ecosystem. Furthermore, BNB is accepted as a form of payment for credit card transactions at select merchants who support it.
BNB was introduced in July 2017, initially distributing 200,000,000 coins according to the following allocation:
The BNB community is dedicated to enhancing the BNB Chain by integrating side chains and implementing zk-rollups. These advancements aim to provide customized blockchain solutions and improve scalability, enabling efficient and high-performance operations. With these developments, there is optimism for a resurgence in interest and value for BNB, potentially approaching or surpassing its previous peak of $690.
Bitcoin (BTC) is a revolutionary virtual currency that supports a decentralized peer-to-peer (P2P) payment system free from the centralized control of any government or entity. Bitcoin was created in 2008 by an anonymous person or group of people known by the pseudonym Satoshi Nakamoto.
Although Bitcoin wasn’t technically the first cryptocurrency created, the asset and its ground-breaking blockchain technology are widely considered the catalyst for today’s flourishing digital asset industry. Bitcoin is currently the largest cryptocurrency by market capitalization.
Bitcoin is entirely digital and operates on a decentralized blockchain network — a virtual public ledger that records all transactions made on the Bitcoin blockchain. Bitcoin transactions are sent electronically to nodes that verify their validity. Once confirmed, a transaction is grouped with others to create a ‘block’ of information, which is then added to the blockchain. This process is known as Proof of Work, and it helps to protect the network’s security.
The blockchain ledger is immutable, making it virtually impossible to be removed or altered. The ledger is freely accessible to anyone, making it an open blockchain, and transactions can be made anonymously, bringing privacy and transparency to the network. Being decentralized, Bitcoin can be traded freely between anyone with an internet connection through P2P trading.
Bitcoin was created by the individual or collective group known as Satoshi Nakamoto as a response to perceived issues with the traditional banking system. Bitcoin was launched immediately after the global economic crash of 2007 and 2008, and its purpose was revealed to the world through a white paper titled Bitcoin: A Peer-to-Peer Electronic Cash System. Ultimately, Bitcoin was designed to help create a fairer, more equitable, and more democratic financial system for all — free from the control of banks and centralized entities.
Over the years, various figures have claimed to be Bitcoin’s creator, and some media titles have incorrectly identified individuals as such. But, to this day, Nakamoto’s true identity has never been revealed.
Bitcoin is considered by many to be a store of value, which is why some refer to the asset as “digital gold”. The currency also provides a decentralized payment system through which other digital assets can be traded and transferred.
Bitcoin is widely traded speculatively, and is growing in adoption as a form of payment for goods and services. What’s more, some companies allow their employees to be paid a portion of their salary in Bitcoin. Many people see Bitcoin as a hedge against inflation, given its historical resilience and alleged outperformance during inflationary periods.
Advancements to blockchain technology have brought about an evolution in what’s possible on the Bitcoin network. The ordinals protocol, for example, now allows users to inscribe data such as videos, images, and text onto individual satoshis — the smallest unit of Bitcoin — on the Bitcoin blockchain. This created a new way of storing and sharing digital assets using blockchain technology. Then, in 2024, Bitcoin Runes arrived. The protocol allows users to create new tokens directly on the Bitcoin network, and potentially provides Bitcoin miners with a new revenue stream.
One unique factor of Bitcoin is that the BTC price and value is ultimately determined by the collective opinion and actions of the community that trades it. Where fiat currencies are backed by physical commodities or government guarantees, Bitcoin is simply backed by data and shared beliefs.
Bitcoin’s price and value is also influenced by the demand for the asset relative to its available supply. From the asset’s inception, its supply was limited to 21 million Bitcoin to create scarcity and theoretically increase the asset’s value over time as demand increases. Factors outside of the asset’s controlled supply and scarcity also have an impact on BTC price. One major factor is the sentiment surrounding Bitcoin news and how it influences public opinion to either buy or sell the asset.
The supply of total Bitcoin is managed by a process known as ‘mining’, which is also decentralized and open to anyone with the required connectivity, knowledge, and resources. BTC mining involves using computers to solve complex equations to validate transactions and store them on the blockchain. Bitcoin miners earn BTC as a reward for solving these equations. Not only does this incentive increase the supply of Bitcoin, it also helps to strengthen the network’s security.
Bitcoin’s code has been deliberately designed to reduce the rewards given to miners through an event known as Bitcoin halving. The amount of Bitcoin awarded to miners for successfully adding blocks to the blockchain is reduced by half after every 210,000 blocks, or approximately every four years. To date, the Bitcoin network has witnessed a halving event in November 2012, July 2016, May 2020, and April 2024.
The Bitcoin halving progressively reduces the rate at which new BTC enters circulation until the total fixed supply of 21 million Bitcoin is mined. Bitcoin mining will end when the token reaches its maximum circulating supply around the year 2140. Since the latest halving event in 2024, the Bitcoin mining reward has been cut from 6.25 BTC to 3.125 BTC. The next Bitcoin halving is expected to take place at some point during 2028, although the exact date is difficult to estimate. Following the next halving event, the Bitcoin mining block reward will be reduced to 1.5625 BTC.
Historically, the BTC price has rallied following halving events, although the gains made have diminished with each successive halving. The Bitcoin price jumped by over 12,400% following the first halving event in 2012, 5,200% after the 2016 halving, and 1,200% following the 2020 halving.
‘Bitcoin mining’ refers to the process through which new Bitcoin are created and Bitcoin transactions are verified before being added to the blockchain. During the mining process, miners compete to solve difficult cryptographic problems. The first miner to solve the problem is rewarded with newly created Bitcoins — what’s known as the block reward.
Bitcoin mining has come under scrutiny for its environmental impact because the process is highly energy intensive. Research have shown that, in 2023, the electricity used to support Bitcoin mining represented around 0.2% to 0.9% of the total global demand for electricity. As a result, Bitcoin mining consumes a similar amount of electricity as some countries. And, as the difficulty of solving cryptographic problems during the mining process increases, so does the energy demanded. The environmental impact of Bitcoin mining is understandably a challenge for the crypto space. Today, organizations such as the Crypto Climate Accord (CCA) and Bitcoin Mining Council (BMC) are working to address the sustainability challenges facing crypto and provide transparency to mining operations.
Towards more sustainable Bitcoin mining methods, the activity has been adopted as a method of monetizing energy sources that would otherwise go to waste, providing a valuable source of income in developing nations in particular. In both Nigeria and Costa Rica for example, hydroelectric power is being repurposed to support crypto mining operations, generating income not only through mined BTC but also the hosting of mining infrastructure. Meanwhile, some Bitcoin mining operations have invested their BTC earnings into renewable energy sources to help offset the environmental impact of mining.
There are many ways to acquire and trade Bitcoin, and one of the most common is through an exchange. Although Bitcoin was built on the idea of decentralization, what’s known as a centralized exchange provides access to the currency. On a centralized exchange, you can purchase Bitcoin using traditional currencies such as USD and EUR, or using other cryptocurrencies including USDC or ETH. Alongside providing an avenue to purchase Bitcoin, centralized exchanges also match buyers to sellers so you can trade Bitcoin with ease.
Decentralized exchanges are an alternative to centralized services. On a decentralized exchange, buyers and sellers interact directly without the involvement of an intermediary to trade cryptocurrencies. This is known as P2P. Although decentralized exchanges may be hosted by a centralized entity, it has no influence over the transactions between users, and only provides the platform for exchanges to take place. As a result, you’ll need a Bitcoin wallet to safely store your BTC.
Alongside the trading of Bitcoin for other digital assets, it’s possible to obtain Bitcoin through mining and even by using Bitcoin ATMs. Like a conventional ATM but one that’s connected to the blockchain, Bitcoin ATMs allow you to effortlessly exchange BTC for cash or cash for BTC.
If you buy or trade Bitcoin through a centralized exchange, your chosen platform will hold your tokens on your behalf. However, it’s recommended that you use a self-custody Bitcoin wallet to manage your BTC yourself. With a secure and trusted Bitcoin wallet, you won’t need to rely on a third-party to keep your Bitcoin safe. You’ll keep full control of your private keys, while you also avoid the need to share personal details with a third-party, preserving your privacy. Whether you choose a hardware or a software wallet when selecting a Bitcoin wallet, it’s essential to understand how the tool works and how to manage your private keys, so you avoid errors that could compromise the security of your assets.
2024 has been a noteworthy year for Bitcoin. One major development for the currency came with the approval of a Spot Bitcoin ETF by the U.S. Securities and Exchange Commission (SEC), which was announced on January 10, 2024. Eleven proposals from issuers including Grayscale, Blackrock, ARK, and VanEck were approved, marking a major shift towards the mainstream adoption of Bitcoin. This was followed by the approval of six further Spot Bitcoin ETFs in Hong Kong on April 30, 2024 as the funds reached retail traders in Asia for the first time.
Around three months after the approval of the Spot Bitcoin ETF in the U.S., the virtual currency experienced its fourth Bitcoin halving since launch, which happened on April 19, 2024. The Bitcoin halving cut the reward granted to miners on the Bitcoin network from 6.25 BTC to 3.125 BTC. There’s much speculation around the impact the latest Bitcoin halving event will have on the asset’s value, and it’s still too early to assess how the 2024 halving will impact the Bitcoin price long-term.
Events such as the Spot Bitcoin ETF approval, the 2024 halving event, and bullish sentiment for the crypto market broadly helped Bitcoin to reach a new all-time high price of $73,787 on March 13, 2024. However, BTC prices pulled back as far as $56,825.40 on April 30, 2024, before reaching above $60,000 and entering a period of sideways movement.
Cardano is flashing bullish signals across multiple timeframes, with key support holding and upside targets now stretching as high as $1.41.
Cardano is starting to show real signs of life again after weeks of dull price action. ADA is currently trading at $0.57 as it confirms flipping green on the weekly chart, and market participants are now watching closely as key reversal signals start stacking up.
Cardano’s current price is $0.57.00, down -0.83% in the last 24 hours. Source: Brave New Coin
Cardano just flipped green on the weekly timeframe, marking a notable shift after weeks of downward pressure. As shared by analyst Av_Sebastian, the candle is closing firmly above $0.58. This weekly close is the first strong sign of buyer strength returning, and it opens the door for potential continuation in the coming sessions.

ADA flips its weekly candle green, signaling a potential trend reversal. Source: Av_Sebastian via X
On the chart, ADA has found support multiple times just above the $0.50–$0.52 zone, and now it’s pushing off that floor with rising volume. If momentum builds and price breaks above the $0.61 to $0.63 resistance cluster, it would confirm a short-term reversal and possibly target the $0.70 range next. For now, bulls will want to see the $0.58 level hold to keep the structure intact.
Building on its recent weekly strength, Cardano just made a significant move on the 2-week chart, breaking above the Ichimoku cloud in late 2024. As noted by Cantonese Cat, the breakout was followed by a textbook back-test of the cloud’s upper boundary, a move that often signals a shift in trend. The structure also shows a consistent pattern of higher lows and higher highs.
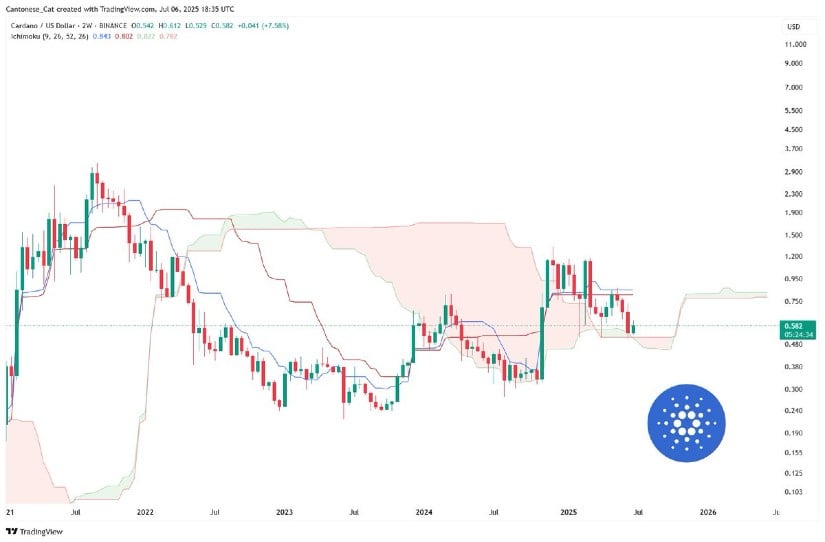
Cardano confirms a bullish Ichimoku breakout with a clean retest on the 2-week chart, eyeing the $0.70–$0.80 zone next. Source: Cantonese Cat via X
What makes this setup even more compelling is that ADA has historically respected Ichimoku signals on longer timeframes. With the breakout and retest in play, a continuation move toward the $0.70 to $0.80 region becomes a real possibility. For now, maintaining the structure above the cloud and pushing beyond the $0.63 resistance cluster would add further confirmation to the bullish case.
On top of bullish technicals, Cardano just posted a massive on-chain milestone. According to TapTools, the network processed 276 billion ADA worth of transactions over the past 67 days, equivalent to roughly $165 billion at market prices.
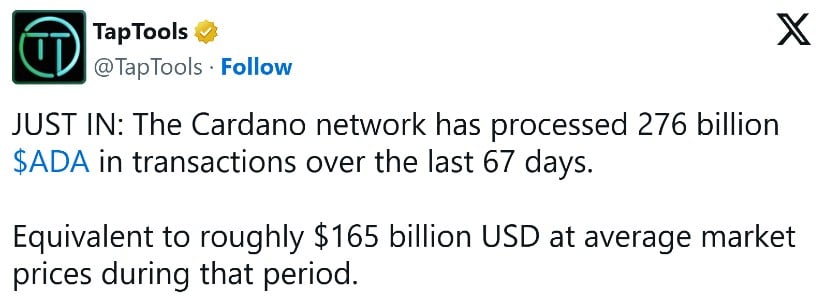
Cardano processes 276B ADA in just over two months, signaling growing network strength. Source: TapTools via X
This sustained throughput adds more weight to the recent technical strength. First came the weekly candle flip, then the Ichimoku cloud retest, and now this surge in network volume helps round out the bullish picture. If Cardano price continues to hold above key support levels and the usage numbers stay this elevated, the foundation for a stronger breakout toward the $0.70+ range becomes more likely.
Cardano is now sitting right at a major bounce zone on the weekly chart. According to analyst Claire, the $0.50 to $0.52 region has already seen two significant reactions, and this third touch could be the make moment. The chart outlines a triple bottom structure with a falling wedge pattern forming overhead. If bulls defend this support and push off convincingly, key upside targets emerge at $0.9024, $1.1281, and $1.4160.
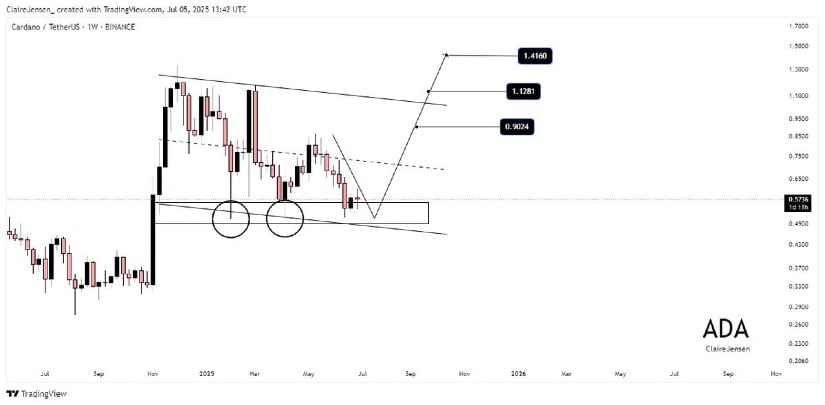
Cardano sits at a key bounce zone with a triple bottom forming, with targets set at $1.41. Source: Claire via X
The levels are clean, the structure is mature. The wider descending channel adds extra weight to this setup, as any breakout would shift ADA into a new bullish phase. While Cardano price has already started to post green candles on the weekly but, the next few weekly candles will be important.
Just like the weekly chart, the lower-timeframe setup for ADA price is starting to form a potential triple bottom. Analyst Ali highlights the $0.54 zone as a key level to watch; price has bounced off it multiple times, and it now lines up with a strong support region.
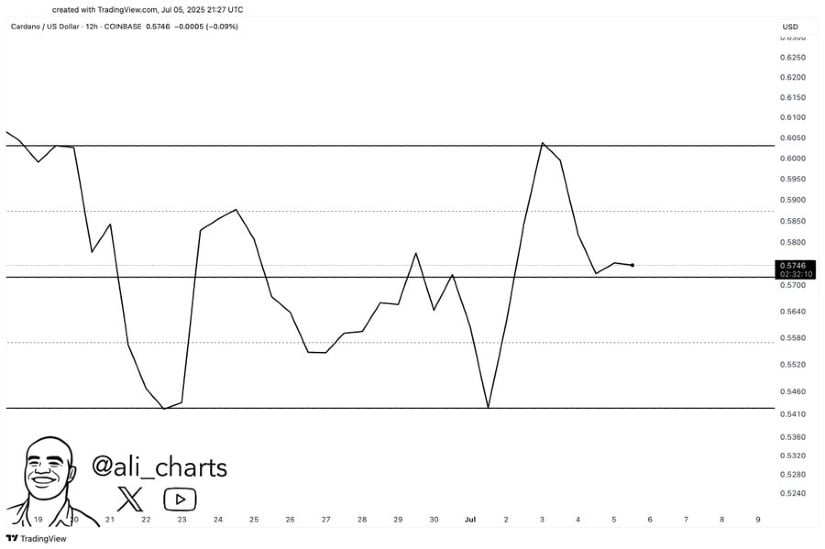
ADA forms a potential triple bottom near $0.54 on lower time frames. Source: Ali via X
If ADA revisits this area and holds, it could trigger a sharp rebound, especially with momentum building on the higher timeframes. This setup reflects a classic reversal structure, and a confirmed bounce here would further strengthen the broader bullish case.
Cardano’s recent bounce isn’t just another random green candle; it’s backed by solid technicals, strong on-chain metrics, and growing sentiment. From flipping the weekly chart green to retesting the Ichimoku cloud on the 2-week, ADA is quietly stacking signals that suggest bulls are about to take complete control.
If ADA holds its footing above $0.58 and breaks cleanly past the $0.63 resistance zone, things could move fast. With targets ranging from $0.70 to $1.41, Cardano may finally be ready to step back into the spotlight.

XRP, currently one of the top cryptocurrencies by market cap (excluding stablecoins), has shown remarkable price movement over the years. Its extreme volatility, while risky, has often opened doors to high returns.
Take this for example: In 2017, XRP traded for just $0.0055. By January 2018, it had skyrocketed to $3.80—a 68,990% increase in just 10 months. That means a $10,000 investment at that time would have grown to about $6.9 million. These numbers explain why Michael Saylor, Executive Chairman of MicroStrategy, calls volatility in crypto a “gift.”
More recently, in the late 2024 to early 2025 mini bull cycle, XRP jumped from $0.50 in November 2024 to $3.40 in January 2025, a 580% gain in under three months. These past rallies prove that XRP still holds serious upside potential.
As of now, XRP is trading at $2.26. Based on this price:
With these amounts in hand, the future value of your holdings entirely depends on how XRP performs over the next 15 years.Also Read: Massive XRP withdrawal from Coinbase sparks bullish breakout buzz — analysts predict up to 600% surge
Various analysts and platforms have shared projections for XRP’s long-term price, and the ranges are pretty wide.
According to Telegaon, XRP could:
At this peak price of $160.34:
Meanwhile, Changelly’s analysts are far more bullish. They project XRP could:
If this turns out to be accurate:
That kind of growth could change someone’s life completely—retirement, real estate, or even generational wealth could be on the table.
Even conservative estimates show solid growth potential. Google Gemini’s AI chatbot, for instance, gave a more cautious forecast:
Even at that price:
While this isn’t millionaire status, it’s still a strong return compared to traditional investments like stocks or savings accounts.
Ultimately, XRP’s future depends on several factors—regulatory clarity, adoption by financial institutions, and broader market conditions. However, based on the data and projections available:
But remember, this isn’t financial advice. As with any crypto investment, do your research, understand the risks, and never invest more than you can afford to lose.
If XRP hits even the lower end of these 2040 price targets, today’s investments could yield substantial returns. Whether it’s $142,000 or $12 million, XRP offers a rare opportunity in the crypto world—high risk, but potentially high reward.
So, is XRP worth adding to your long-term investment portfolio? The numbers speak for themselves, but the decision is yours.
Q1: How much could $5,000 in XRP be worth in 2040?
It could grow to $4.28 million if XRP hits $1,938.
Q2: What’s the 2040 XRP price prediction from experts?
Predictions range from $64.2 to $1,938 per XRP by 2040.
Solana is trading just below key resistance levels, with strong Q2 revenue, bullish chart patterns, and ETF momentum hinting at a potential breakout toward $200.
Solana looks like it’s gearing up for one of its biggest moves of the year. After topping all blockchains in Q2 revenue for the third quarter in a row, the charts are finally starting to catch up. The signs are getting clearer: strong fundamentals, steady demand, and now a price structure that’s hinting at a potential rally ahead.
Q2 numbers are in as shared by SolanaFloor, and Solana’s position at the top of the revenue chart is starting to look familiar. Solana just closed out its third consecutive quarter as the leading blockchain by network revenue, pulling in over $271 million in Q2 2025. That puts it comfortably ahead of Tron, Ethereum, and even Bitcoin, based on the latest data from Blockworks.
Solana leads all blockchains in Q2 revenue with over $271 million. Source: SolanaFloor via X
This kind of performance isn’t just about a single app or trend; it reflects growing consistency across the Solana ecosystem. When a network consistently generates this level of revenue, the price eventually starts to catch up. Strong fundamentals tend to draw sustained interest. As Solana keeps proving its ability to monetize real on-chain activity, the gap between utility and market value could start to narrow.
With Solana leading on fundamentals, the price chart is beginning to reflect that same strength. As pointed out by Nebraskangooner, Solana price appears to be forming an inverse head and shoulders. The neckline sits just below $155, and price is currently hovering around $152. A clean breakout above that level could shift short-term momentum and target a potential move toward the $165 to $170 range, aligning with the 200-day moving average acting as dynamic resistance.

Solana price forms an inverse head and shoulders, eyeing a breakout above $155 with targets near $170. Source: Nebraskangooner via X
The structure itself has been developing over the past few weeks, with higher lows forming the right shoulder and volume holding steady. In context with Solana’s recent Q2 revenue dominance, this technical setup adds weight to the idea that price may start catching up with on-chain momentum. If the neckline breaks with confirmation, it would be a strong technical follow-through to what the fundamentals have already been signaling.
After forming a potential inverse head and shoulders on the higher timeframes, Solana just reclaimed a key 4H support-resistance zone, as noted by VeLLa Crypto. Price pushed back above the $150–$152 area and held, flipping what was previously a cap into a short-term base.
Solana reclaims the $150–$152 zone on the 4H chart, setting the stage for a potential push toward $166. Source: VeLLa Crypto via X
This kind of S/R reclaim often acts as a trigger point if momentum follows through, and the chart is hinting at a possible run toward the $166 level if buyers stay active.
This reclaim could mark the transition from structure-building to trend acceleration. There’s still some overhead resistance to work through, but technically, the breakout above this local range puts Solana in a stronger position than it’s been in weeks.
With Solana reclaiming key levels across multiple timeframes, market watchers like 0xGumshoe are starting to map out what could fuel the next leg higher. Instead of hinging on a single catalyst, his view builds around a chain of developments, macro and micro, that could stack in Solana’s favor if momentum holds. The charts are improving, but so is the narrative behind them.
Here’s what’s on the radar:
The structure is now there, and with fundamentals backing it, the pieces are beginning to align.
Crypto analyst Alek_Carter points out that Solana is still stuck in a defined range, testing patience while consolidating just below resistance. The chart highlights $184 as the key level, until price closes above it, the move remains on hold.
Structurally, Solana has been holding a series of higher lows since May, showing steady demand, but hasn’t yet pushed through the ceiling that could open up new upside.
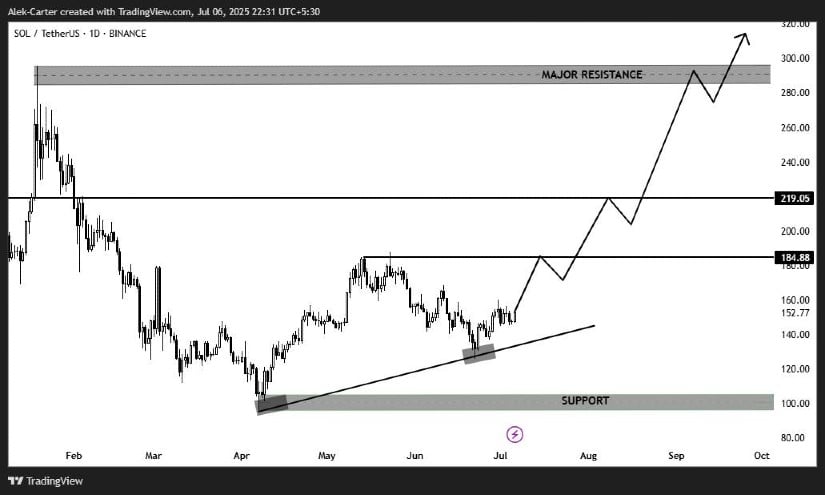
Solana consolidates below $184 resistance, with price eyeing $219 and $260–$300 as breakout targets. Source: Alek_Carter via X
If that breakout comes, the next major level on the radar is around $219, followed by the $260–$300 zone mapped as major resistance. Carter suggests that ETF inflows could provide the catalyst needed to flip this range, especially if momentum builds alongside broader risk-on sentiment.
Solana may still be stuck below major resistance, but the pieces are falling into place. From strong Q2 revenues to improving technicals and growing ETF speculation, the momentum is starting to lean bullish. Participants are not just throwing wild targets anymore; many are pointing to structured patterns and key levels like $160 and $184 that, if broken, could open the door to a run towards $200 and beyond.
Key points:
Bitcoin is facing selling near $110,500, but the bulls are expected to aggressively defend BTC price at its key moving averages.
XRP is trying to break above its immediate overhead resistance level.
Bitcoin BTCUSD continues to face selling near the $110,500 level, indicating that the bears are vigorously defending the level. A positive sign in favor of the bulls is that they have not allowed the price to dip below the moving averages. That suggests the bulls are hanging on to their positions and not hurrying to book profits.
Analysts point out that the bands in the Bollinger Bands indicator are getting squeezed, suggesting a sharp move may be around the corner. Bollinger Bands creator John Bollinger said in a post on X that Bitcoin could be “setting up for an upside breakout.”

Investors have not given up as they continue to pump money into Bitcoin exchange-traded products (ETPs), which recorded $790 million in inflows for the trading week ended Friday, per CoinShares data. There was a marginal slowdown in inflows compared to the previous three weeks, which witnessed $1.5 billion in inflows.
CoinShares head of research James Butterfill said the drop in inflows suggests a cautious approach from the investors as Bitcoin approaches its all-time high.
Will bears pull Bitcoin below the moving averages, or could buyers defend the level? How are the altcoins likely to behave? Let’s analyze the charts of the top 10 cryptocurrencies to find out.
S&P 500 Index price prediction
The S&P 500 Index (SPX) extended its uptrend last week, indicating sustained demand from the bulls at higher levels.

Usually, after breaking out of a significant resistance, the price turns down and retests the breakout level. Therefore, a retest of the 6,147 level is possible. If the price turns up sharply from 6,147, it suggests the bulls have flipped the level into support. That increases the likelihood of the continuation of the uptrend. The index may then rally toward 6,500.
Sellers will have to yank the price below the 20-day exponential moving average (EMA)(6,099) to weaken the bullish momentum. The index may then plummet to the 50-day simple moving average (SMA) (5,904).
US Dollar Index price prediction
The US Dollar Index (DXY) turned up from the 96.37 level on Tuesday, indicating demand at lower levels.

The pullback could reach the breakdown level of 97.92, where the bears are expected to sell aggressively. If the price turns down sharply from 97.92, it suggests that the bears are trying to flip the level into resistance. That increases the risk of a break below 96.37. The index may then drop toward the 95 level.
Conversely, a break and close above the 97.92 level suggests the bulls are on a comeback. The index could then rise to the 50-day SMA (99.03). This is an important level to keep an eye on because a break above it could drive the index to the 100.54 level and then to the 102 resistance.
Bitcoin price prediction
Bitcoin has been oscillating between the 20-day EMA ($107,211) and the overhead resistance of $110,530.

This tight range trading is unlikely to continue for long. Although a range expansion is around the corner, it is difficult to predict the direction of the breakout. If the price turns down and plunges below the moving averages, the ![]()
![]() BTCUSDT pair could descend to $104,500 and later to $100,000.
BTCUSDT pair could descend to $104,500 and later to $100,000.
On the contrary, a break and close above $110,530 opens the gates for a rally to $111,980 and then to the neckline of the inverse head-and-shoulders pattern. A close above the neckline could start the next leg of the uptrend toward $150,000.
Ether price prediction
Ether ![]() ETHUSD has been stuck inside the $2,738 to $2,323 range for several days, with attempts to break and sustain the price above and below the range being unsuccessful.
ETHUSD has been stuck inside the $2,738 to $2,323 range for several days, with attempts to break and sustain the price above and below the range being unsuccessful.

Buyers are trying to push the price above $2,635, clearing the path for a rally to $2,738. Sellers are expected to fiercely defend the $2,738 to $2,879 zone. If the price turns down from the overhead zone, the ![]()
![]() ETHUSDT pair could find support at the 20-day EMA. If the price bounces off the 20-day EMA, the bulls will again try to drive the pair above $2,879.
ETHUSDT pair could find support at the 20-day EMA. If the price bounces off the 20-day EMA, the bulls will again try to drive the pair above $2,879.
On the downside, a break and close below the 20-day EMA suggests the pair may extend its stay inside the range. Sellers will be back in the driver’s seat on a close below $2,111.
XRP price prediction
Buyers have managed to sustain XRP ![]() XRPUSD above the 20-day EMA ($2.20) for the past few days, signaling a lack of aggressive selling by the bears.
XRPUSD above the 20-day EMA ($2.20) for the past few days, signaling a lack of aggressive selling by the bears.

The 20-day EMA has started to turn up, and the RSI has jumped into the positive zone, indicating the path of least resistance is to the upside. There is resistance at $2.34, but it is likely to be crossed. The ![]()
![]() XRPUSDT pair could climb to $2.48 and subsequently to $2.65. Buyers will have to overcome the barrier at $2.65 to start a new up move toward $3.
XRPUSDT pair could climb to $2.48 and subsequently to $2.65. Buyers will have to overcome the barrier at $2.65 to start a new up move toward $3.
Contrarily, if the price turns down and breaks below the 20-day EMA, it suggests the pair may swing between $2.34 and $2 for a while longer.
BNB price prediction
BNB ![]() BNBUSD bounced off the 20-day EMA ($652) on Saturday, indicating that the sentiment remains positive and traders are buying on dips.
BNBUSD bounced off the 20-day EMA ($652) on Saturday, indicating that the sentiment remains positive and traders are buying on dips.

The upsloping 20-day EMA and the RSI just above the midpoint indicate a slight edge to the bulls. If the $665 resistance falls, the ![]()
![]() BNBUSDT pair could rise to $675 and then to $698. Sellers are likely to pose a solid challenge at $698 because a break above it could propel the pair to $732.
BNBUSDT pair could rise to $675 and then to $698. Sellers are likely to pose a solid challenge at $698 because a break above it could propel the pair to $732.
This optimistic view will be negated in the near term if the price turns down and breaks below the moving averages. The pair may then drop to $636.
Solana price prediction
The bulls managed to push Solana ![]() SOLUSD above the 20-day EMA ($149) on Sunday but are struggling to break above the 50-day SMA ($154).
SOLUSD above the 20-day EMA ($149) on Sunday but are struggling to break above the 50-day SMA ($154).

The 20-day EMA has flattened out, and the RSI is just above the midpoint, indicating a balance between supply and demand. Buyers will have the upper hand if they push the ![]()
![]() SOLUSDT pair above $159. That opens the gates for a rise to $185. There is minor resistance at $168, but it is likely to be crossed.
SOLUSDT pair above $159. That opens the gates for a rise to $185. There is minor resistance at $168, but it is likely to be crossed.
The first support on the downside is at $145 and then at $137. A break below $137 tilts the advantage in favor of the bears. The pair may then tumble to $126.
Dogecoin price prediction
Dogecoin ![]() DOGEUSD has broken above the 20-day EMA ($0.16), suggesting that the bulls are attempting a comeback.
DOGEUSD has broken above the 20-day EMA ($0.16), suggesting that the bulls are attempting a comeback.

If buyers maintain the price above the 20-day EMA, the ![]()
![]() DOGEUSDT pair could rise to the 50-day SMA ($0.18) and later to $0.21. Sellers are expected to defend the $0.21 level, but if the buyers prevail, the pair could soar to $0.26.
DOGEUSDT pair could rise to the 50-day SMA ($0.18) and later to $0.21. Sellers are expected to defend the $0.21 level, but if the buyers prevail, the pair could soar to $0.26.
Instead, if the price turns down from the current level and breaks below the 20-day EMA, it suggests that the bears are selling on every minor rally. That could sink the pair to the $0.14 support.
Cardano price prediction
Cardano (ADA) has been clinging to the 20-day EMA ($0.58), indicating that the bulls have kept up the pressure.

The flattening 20-day EMA and the RSI just below the midpoint suggest the selling pressure is reducing. If buyers drive the price above the 20-day EMA, the ![]()
![]() ADAUSDT pair could rally to the 50-day SMA ($0.64) and then to the downtrend line. The bulls will have to push and sustain the price above the downtrend line to signal a potential trend change.
ADAUSDT pair could rally to the 50-day SMA ($0.64) and then to the downtrend line. The bulls will have to push and sustain the price above the downtrend line to signal a potential trend change.
Sellers will have to drag the price below the $0.50 support to complete the bearish descending triangle pattern. That may start a downward move to $0.40.
Hyperliquid price prediction
Buyers have managed to keep Hyperliquid (HYPE) above the 20-day EMA ($38.41) for the past few days, indicating demand at lower levels.

However, a negative sign is that the bulls have failed to drive the price above the near-term resistance of $41.23. If the price turns up from the current level or the 20-day EMA and breaks above $41.23, it signals that the bulls are back in the driver’s seat. The HYPE/USDT pair could surge to the $42.50 to $45.80 resistance zone.
The first sign of weakness on the downside will be a break and close below the 50-day SMA ($36.60). That opens the doors for a fall to $33.25 and later to $30.69.
This article does not contain investment advice or recommendations. Every investment and trading move involves risk, and readers should conduct their own research when making a decision.
After a sharp climb last week, Ethereum price today is stabilizing just below the $2,600 mark. The short-term structure is forming a tight range as buyers attempt to hold key moving averages while watching volume signals for a potential breakout above local resistance.
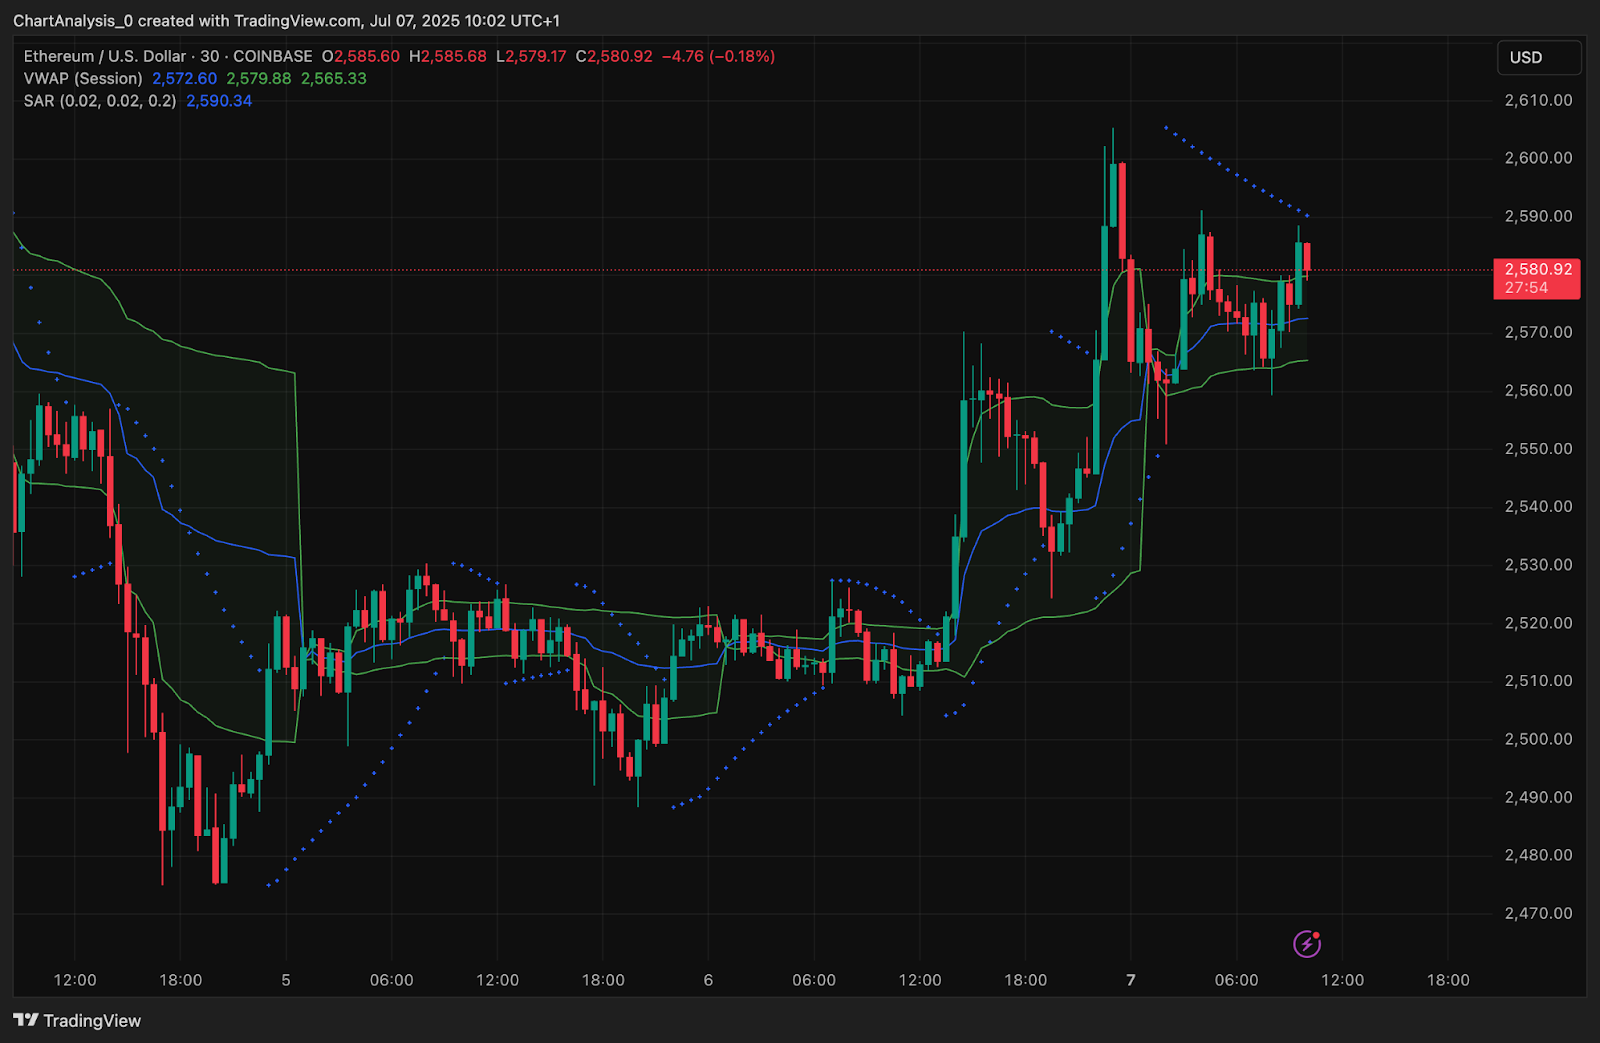
On the 30-minute and 4-hour charts, Ethereum price has been consolidating between $2,560 and $2,590 after a sharp breakout on July 6. Price is riding along the mid-line of Bollinger Bands while staying above the VWAP and Parabolic SAR flip levels near $2,572 and $2,565, respectively. This suggests ongoing buyer interest despite a lack of immediate momentum.
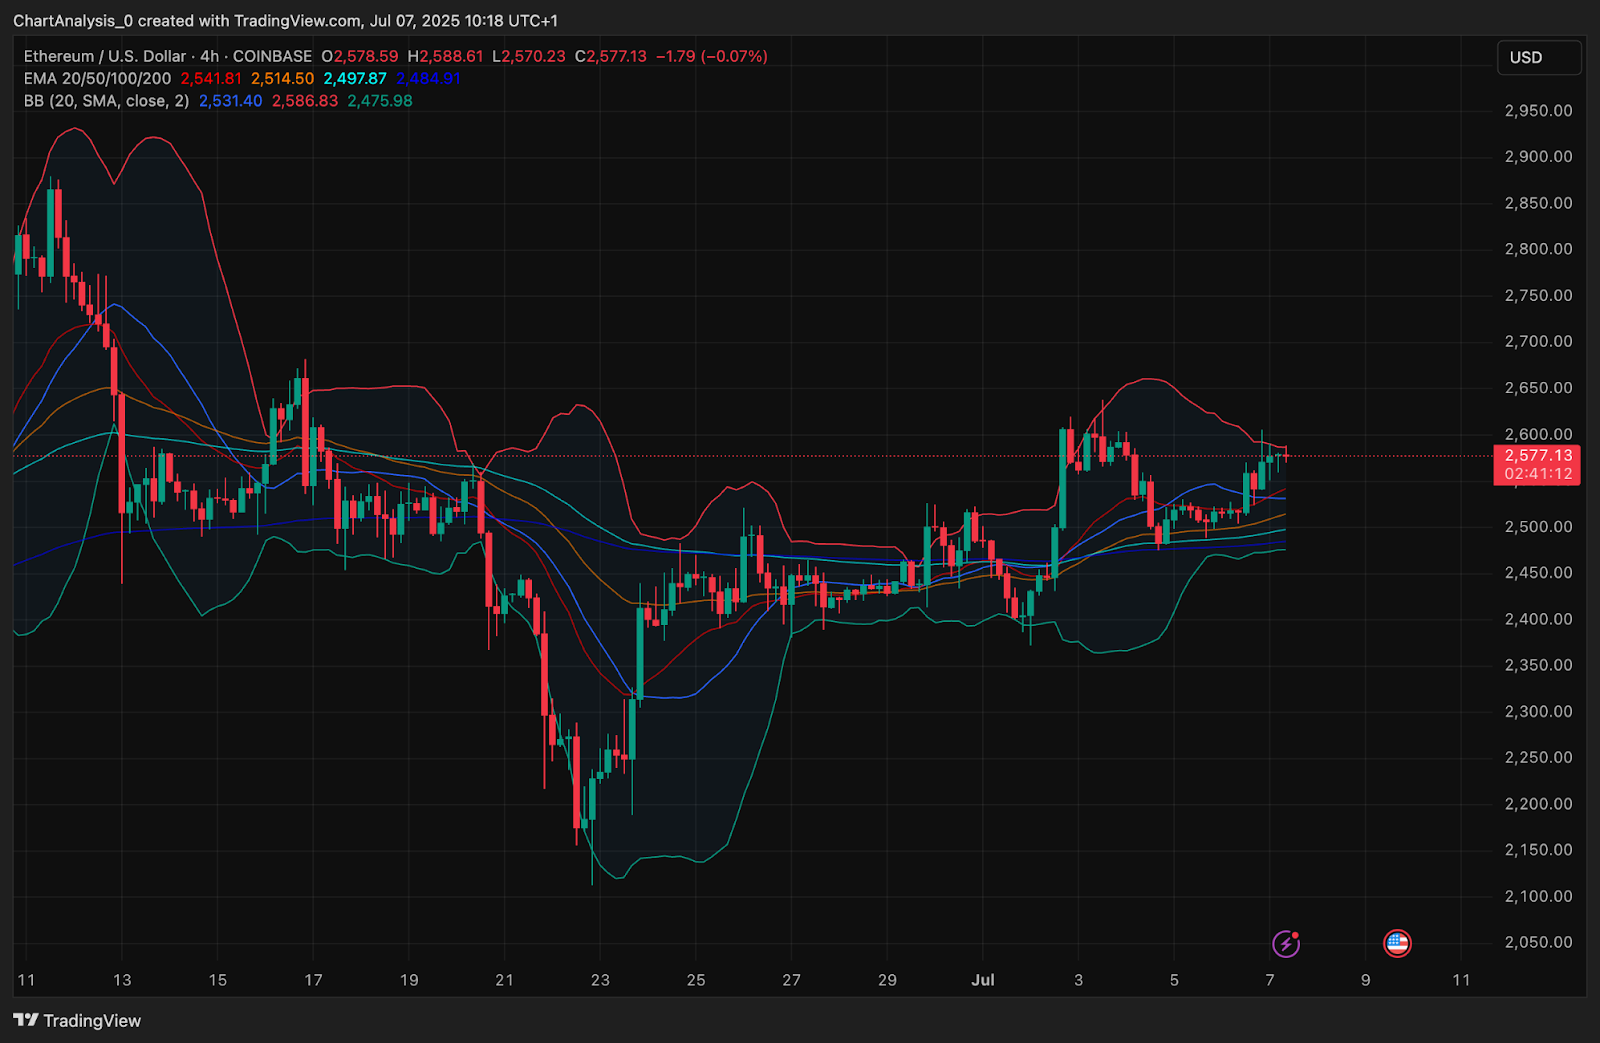
The 4-hour Bollinger Bands have slightly expanded, allowing ETH to stretch higher without immediate rejection. Notably, the price is holding above the 20, 50, 100, and 200 EMAs, which are now stacked in a bullish alignment between $2,541 and $2,497. This dynamic cluster reinforces support and hints at a potential continuation setup.
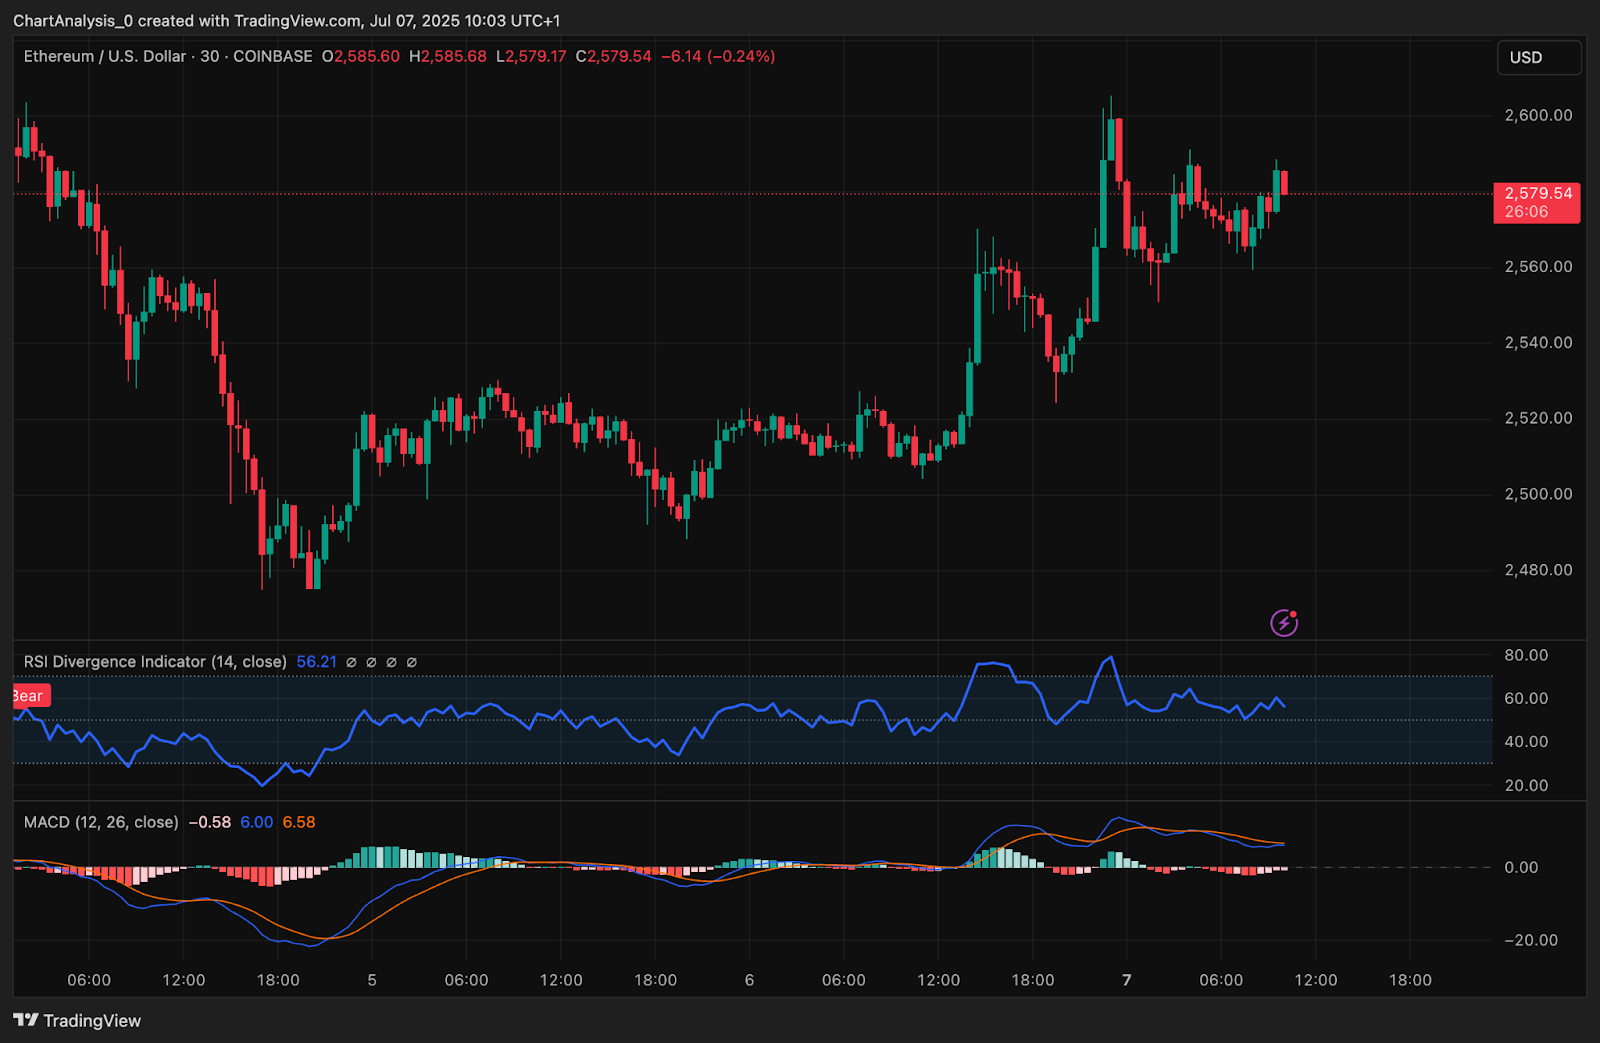
The post Ethereum (ETH) Price Prediction for July 8 appeared first on Coin Edition.
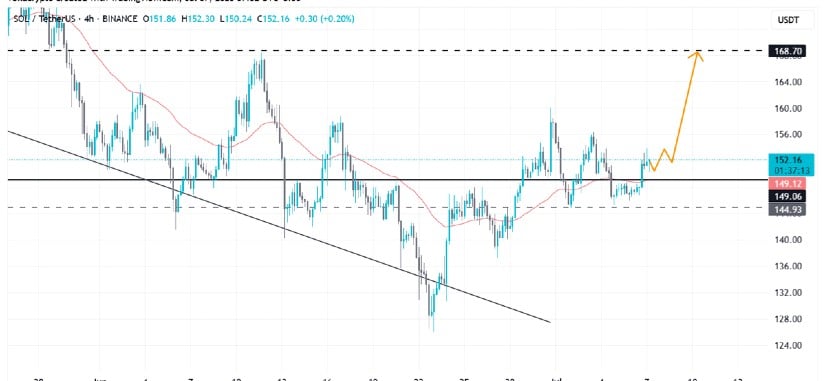
After bouncing from the $142 support cluster last week, the Solana price today is consolidating just below the $154 resistance level. The structure remains within a tightening wedge, where the battle between bulls and bears is intensifying. With funding rates positive and open interest rising, speculative momentum is building ahead of a potential breakout.
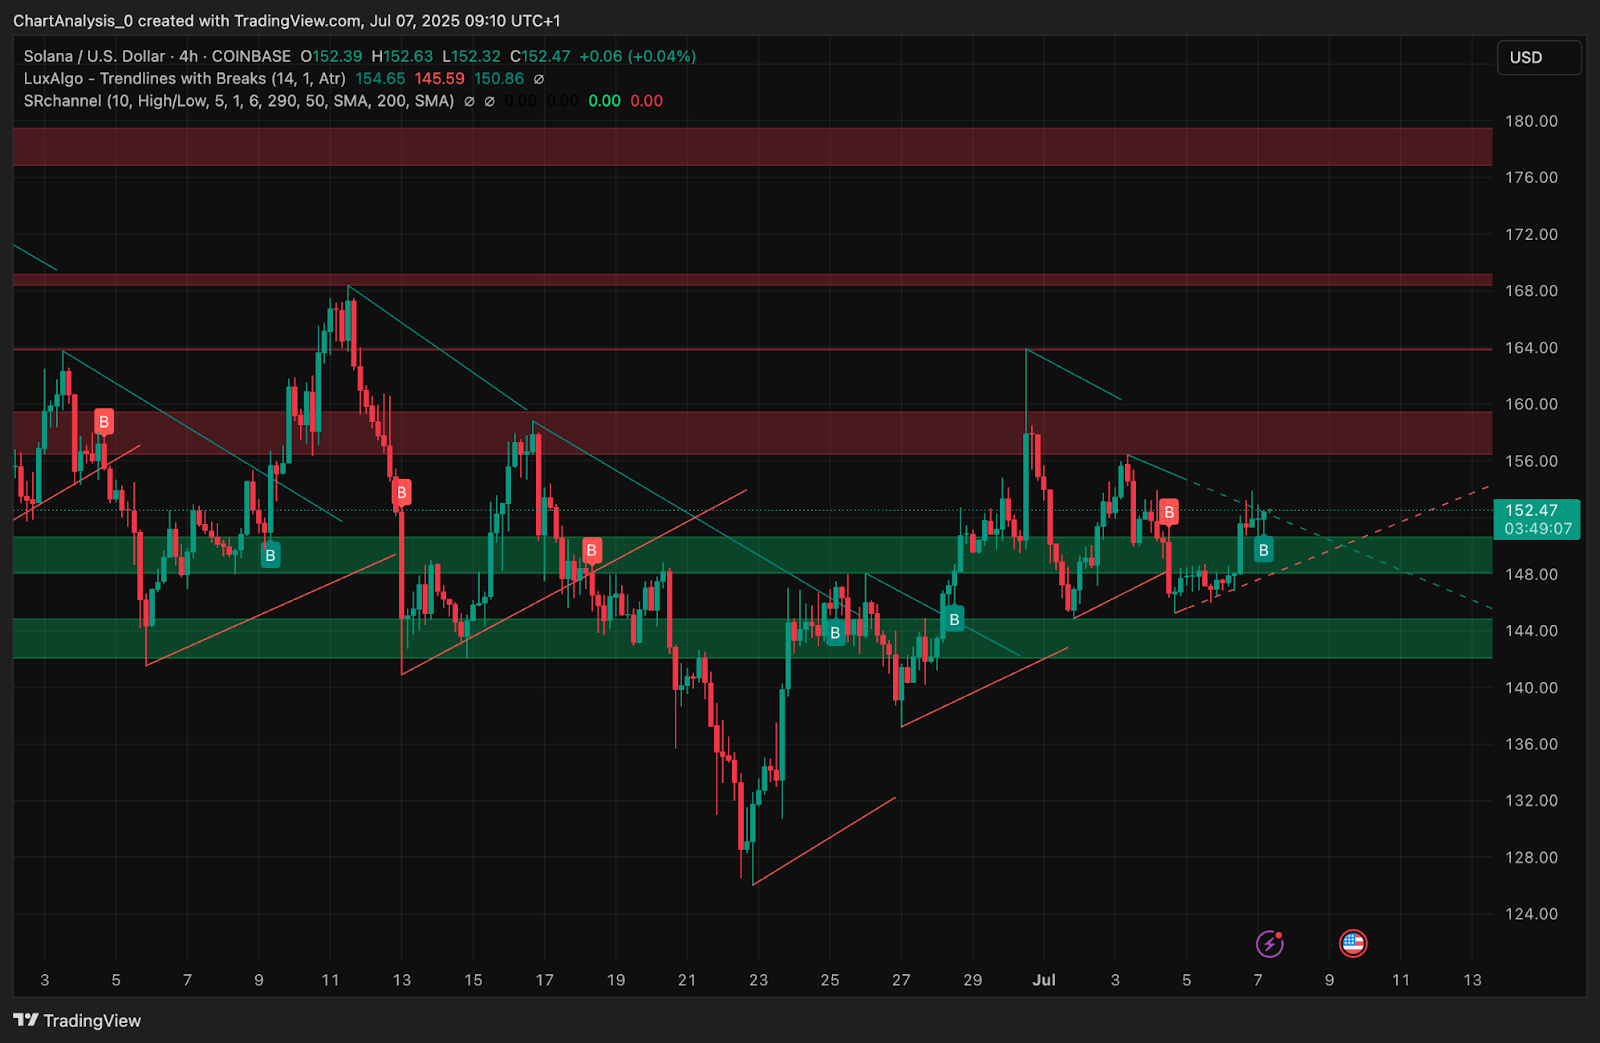
Solana has formed a symmetrical triangle on the 4H chart, with higher lows from $142 and descending highs from the June peak near $157. This wedge compression is now squeezing price into a narrow apex zone between $150 and $154.
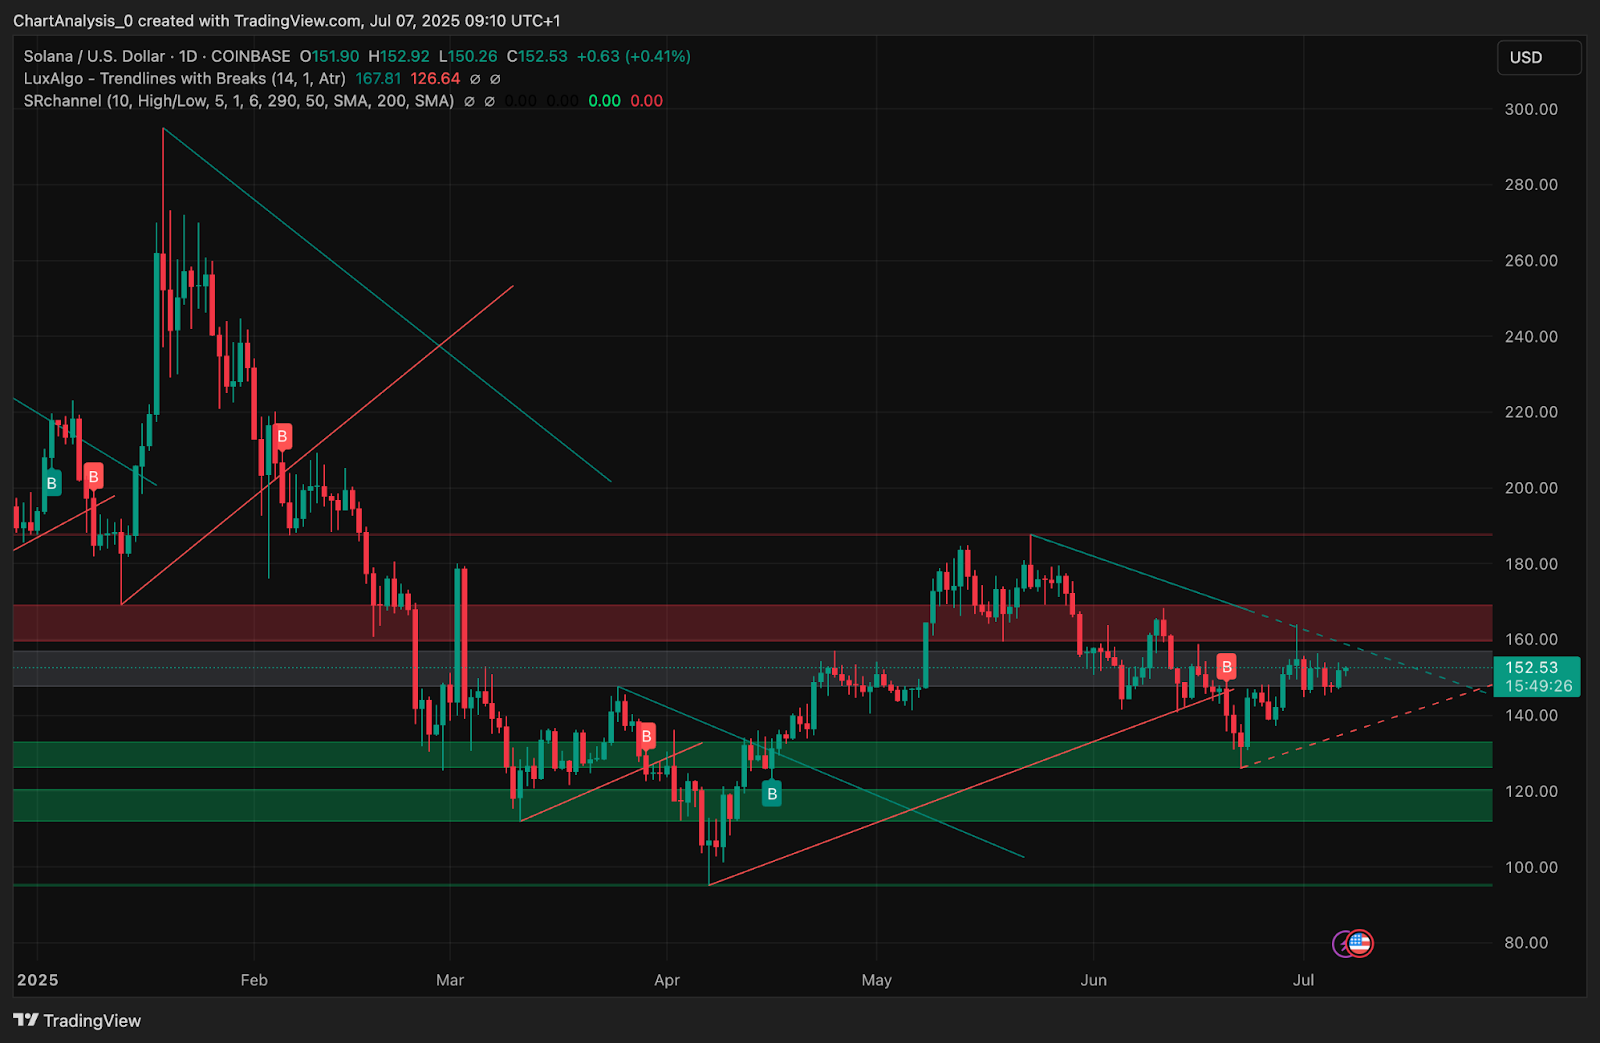
On the daily timeframe, SOL is also pinned below a descending trendline from April’s highs. However, price has reclaimed the mid-range of the recent structure and is now testing both the local trendline and a prior demand-turned-supply zone. The range between $154 and $157 is a confluence resistance that needs to be flipped for continuation.
If bulls break above this zone with volume, a revisit of $162 or even $171 is possible. But failure to clear …
The post Solana (SOL) Price Prediction for July 8 appeared first on Coin Edition.
