The main category of Crypto News.
You can use the search box below to find what you need.
[wd_asp id=1]
The main category of Crypto News.
You can use the search box below to find what you need.
[wd_asp id=1]
Ripple Labs has taken a decisive step to end its prolonged legal dispute with the U.S. Securities and Exchange Commission (SEC), signaling a new beginning for both Ripple and XRP.
By voluntarily dropping its cross-appeal, Ripple has accepted the $125 million civil penalty and agreed to uphold the permanent injunction. This strategic shift allows the company to move past the courtroom and focus on innovation.
While the legal saga began in December 2020 with allegations that Ripple raised $1.3 billion through unregistered XRP sales, the company’s latest move underscores a desire to avoid further litigation and uncertainty. Ripple CEO Brad Garlinghouse described the moment as “closing this chapter once and for all,” marking a pivotal turning point for the Ripple ecosystem.
For added emphasis, crypto commentator Scott Melker recently highlighted an insightful point made by CoinRoutes CEO Dave Weisberger: the pending lawsuit has no immediate legal effect on XRP itself. Weisberger’s assertion that XRP is no longer legally tied to Ripple’s actions is a key differentiation for investors and represents a new front of autonomy for the XRP coin.
There is no direct legal connection between Ripple Labs’ remaining lawsuit with the SEC and the XRP token. Source: @scottmelker via X
This disconnect, highlighted by sentiment within the industry, highlights growing optimism that XRP’s price and adoption will no longer be weighed down by the regulatory woes of Ripple. It also underlies broader optimism regarding XRP crypto news and upcoming ETF approval.
While Ripple has withdrawn its appeal, the SEC has yet to make its next move. A formal vote by the Commission is required to dismiss its appeal, which may take place in a closed-door session. Market watchers believe the SEC will follow Ripple’s lead to close out this high-profile case, especially as pressure mounts on the regulator to modernize its crypto-regulation framework.

Bloomberg’s James Seyffart estimates a 95% chance of a spot XRP ETF approval in 2025, as Ripple CEO Brad Garlinghouse highlights growing institutional recognition amid waning SEC pressures. Source: John Squire via X
When the SEC finally drops its pursuit, it could remove a long-standing cloud from the crypto market and accelerate further momentum for instruments like XRP. Legal experts contend it could influence the broader environment, especially for other digital assets in a similar position.
The XRP price saw modest gains following the announcement, with traders welcoming the move as a step toward long-term stability. Although the XRP lawsuit has largely been resolved in terms of XRP’s classification, the removal of any lingering legal friction adds clarity that investors have been craving.
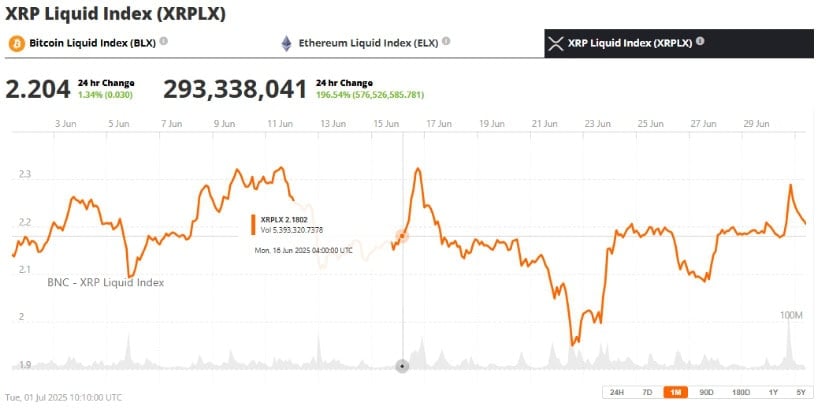
XRP was trading at around $2.20, up 1.34% in the last 24 hours at press time. Source: XRP Liquid Index (XRPLX) via Brave New Coin
As of today, XRP is trading around $2.24, with analysts predicting a potential test of higher resistance zones if broader sentiment remains positive. Some believe the developments could influence xrp price prediction 2025, especially if institutional interest picks up following the resolution.
With its legal issues nearly behind it, Ripple is now turning full attention to its mission of building the “Internet of Value.” This vision centers on enabling global, real-time value transfers using Ripple’s blockchain infrastructure and XRP ledger.
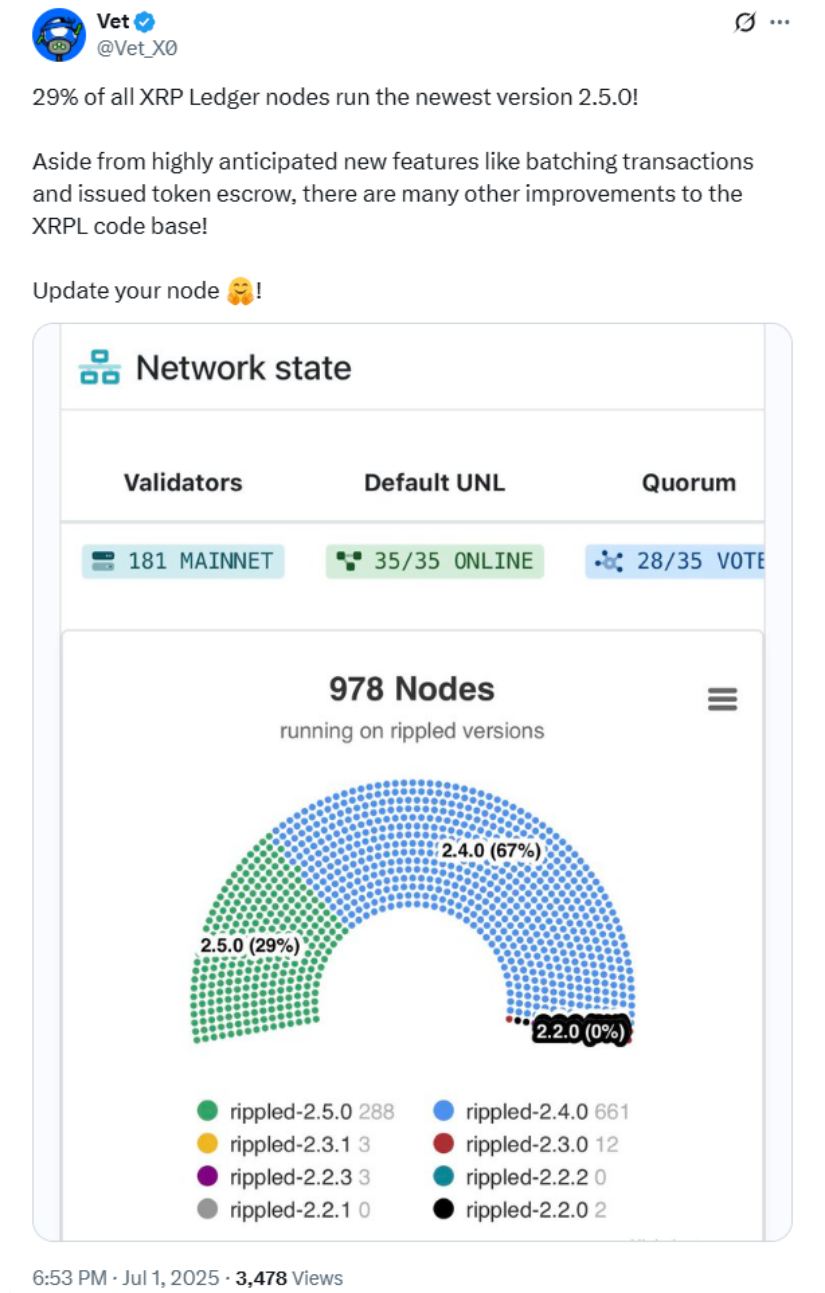
29% of XRP Ledger nodes now run version 2.5.0, introducing key features like transaction batching, issued token escrow, and multiple codebase enhancements. Source: Vet via X
The company has already made significant strides, including enhancing XRP ledger compatibility with Ethereum-based applications and driving adoption through cross-border payment partnerships. Ripple’s ability to now operate without legal distractions is expected to accelerate these efforts.
The Ripple vs SEC case has been a trendsetter for quite some time regarding how regulators in the U.S. view crypto. Its outcome affects Ripple and XRP, but more significantly, it sends a message to other projects that end up in similar legal waters. The outcome will affect ripple xrp price prediction models as well as regulatory strategies across the crypto landscape.
As David Schwartz, Ripple’s CTO, recently stated, “We’re entering a phase where clarity and utility will drive growth, not speculation.” With XRP legally untethered and Ripple freed from legal limbo, that phase may have just begun.
Ripple’s decision to drop its cross-appeal is more than a strategic decision—it’s a statement of readiness to move on and lead the way. For XRP holders, this may be the go-ahead that many have been waiting for. As the XRP news today shows, Ripple is no longer mired in courtroom drama, and XRP will pen its next chapter—a chapter of advancement, innovation, and a clearer path forward under the regulators.
Since XRP crypto price prediction scene shifts, and Ripple doubles down on expansion, everybody now wants to know what is next in this ongoing saga.
Solana is on the brink of a breakout, testing key resistance levels, with growing optimism and the upcoming ETF launch building momentum for a potential rally.
Solana is on the brink of a major price breakout, as it trades just beneath a crucial descending trendline that’s been capping its price since December 2024. With bullish headlines surrounding an upcoming ETF launch and market sentiment shifting toward optimism, SOL’s technicals are beginning to align.
Solana is hovering just beneath a crucial descending trendline that has capped its price since December 2024. As highlighted by Zeus, price is pressing up against the $154 to $155 zone, right at the edge of a potential breakout. With bullish catalysts like the upcoming ETF launch making headlines, SOL has the narrative support, but the technical confirmation is still pending.
Solana is testing key resistance levels, with a potential breakout in sight. Source: Zeus via X
The lack of a strong reaction so far, just a 1% gain on a day packed with bullish news, shows participants may be waiting for a clean breakout and follow-through before committing. If SOL manages to push above this resistance with volume, the next upside target lies near $183 and $260
Solana briefly offered a major spike through resistance and tagged $160 after REX Shares confirmed its staked ETF will go live Wednesday. The breakout triggered nearly $9 million in short liquidations, causing a massive panic. However, price has now cooled off, retracing back into the $155 range as the market digests the news.

Solana’s current price is $155.08, up 1.05% in the last 24 hours. Source: Brave New Coin
Following the pressure build-up under the multi-month downtrend, a new pattern is now catching attention: an inverse head and shoulders formation, as highlighted by analyst Gordon. This setup, developing over the past few months, signals a possible momentum shift from bearish to bullish. The neckline sits just above $158, and a decisive break above it would mark a strong confirmation of trend reversal.
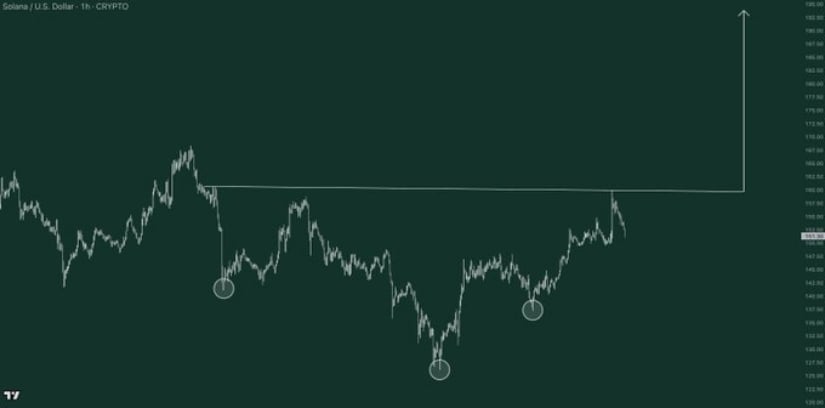
SOL is eyeing a breakout with an inverse head and shoulders pattern, targeting $192. Source: Gordon via X
Technicals continue to align. Starting with compression under resistance, bullish headlines in the background, and now, early signs of a potential breakout. If SOL can close above the neckline with conviction, the next major target sits near $192, right where the pattern’s measured move completes.
Solana’s ETF odds on Polymarket are leaving little room for doubt as the market now assigns a 99% chance of approval in 2025. The sharp 25% jump in conviction reflects how quickly sentiment has shifted following REX Shares’ announcement of the upcoming staked ETF.
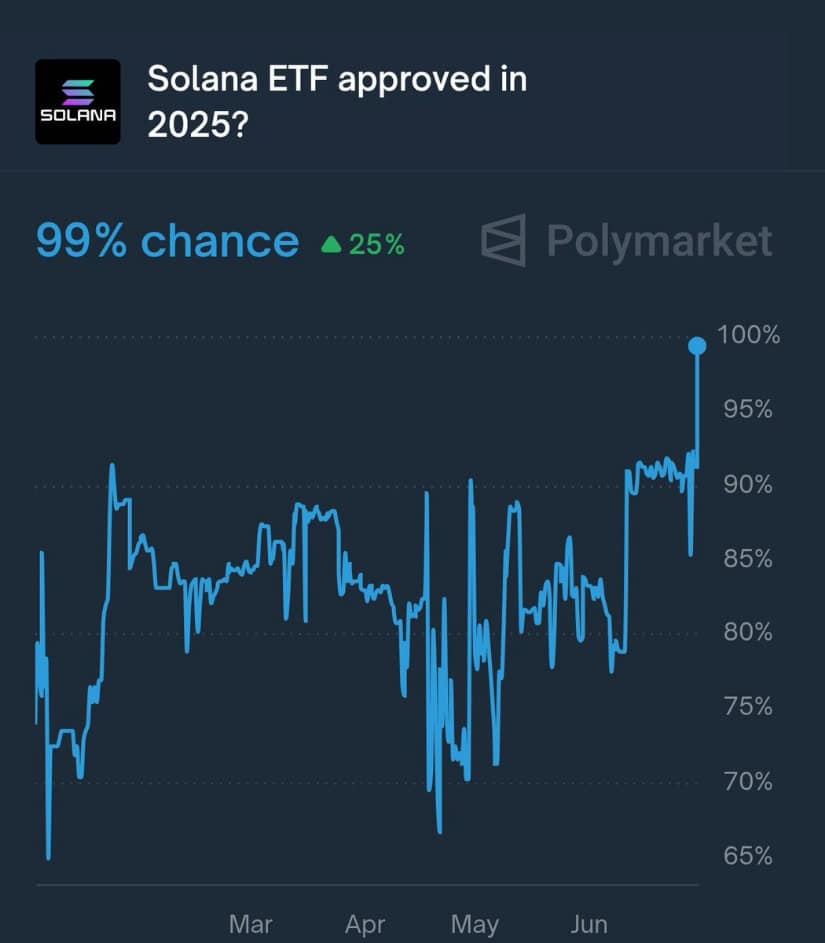
Solana’s ETF approval odds soar to 99%, fueling bullish sentiment. Source: The Solana Post via X
Coming off a sharp $160 spike and a quick pullback, this kind of data strengthens the underlying bullish foundation. It’s no longer just about charts or speculation; market participants are now actively pricing in regulatory clarity and growing institutional interest.
After tagging $160 on the ETF news, SOL has shifted into a local correction mode for the short term, but the structure on HTF remains intact. As highlighted by R. Linda, the recent pullback appears to be a liquidity hunt rather than a breakdown. Price action shows a clear change in character on the higher timeframes, with a breakout above descending resistance and the formation of a rising trendline. The current dip is testing this trendline and the liquidity pocket between $150–$149, a level where bulls may look to reload.
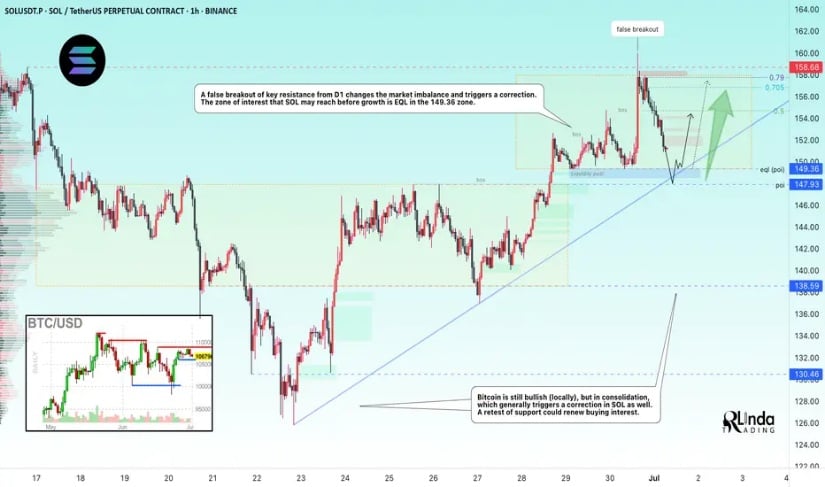
Solana is in a short-term correction, with key support between $149 o $147. Source: R. Linda via X
Technically, the $149.36–$147.93 zone is the key to watch short-term. A successful retest and bounce here could reset momentum for another leg up. Above, resistance levels sit at $154.75 and $156.8, which previously capped price. Until those are broken, SOL remains in a tight range. But given broader developments, from ETF optimism to shifting sentiment, this could simply be the pause before the next move higher.
Solana is clearly at a crossroads, with its price action signaling a major potential breakout. As technicals align and bullish catalysts, like the upcoming ETF launch, fuel optimism, SOL has set itself up for a promising move. However, the key to unlocking that upside lies in a clean break above the $154 to $155 resistance zone. Once the bulls gain control, the next targets lie between $183 and $192, marking a strong move to the upside.
Sellers are trying to get back in the game as more coins are in the red zone today, according to CoinMarketCap.
The rate of DOGE has dropped by 2.36% over the last 24 hours.

On the hourly chart, the price of DOGE is near the local support of $0.1607. If a bounce back does not happen by the end of the day, one can expect a level breakout, followed by a test of the $0.16 mark.

On the bigger time frame, the rate of the meme coin has broken the support of $0.1625.
You Might Also Like

If sellers can hold the gained initiative, the decline is likely to continue to the $0.1579 level soon.

From the midterm point of view, the price of DOGE is falling after the previous bullish bar’s closure. If the situation does not change by the end of the week, traders are unlikely to witness a further upward move.
DOGE is trading at $0.1602 at press time.
Expert predictions suggest XRP price could eventually reach double digits, as many suggest the imminent end to the SEC lawsuit could drive adoption.
The SEC’s 4-year lawsuit against Ripple is finally nearing its conclusion. Specifically, Ripple has already agreed to drop its cross-appeal, and signs point to the SEC doing the same soon.
Notably, a closed-door SEC meeting scheduled for July 3 has triggered expectations that the case could officially wrap up then. While the lawsuit no longer directly involves XRP, since a 2023 ruling confirmed that XRP isn’t a security, many still believe that ending the case for good could lift the last cloud of uncertainty hanging over XRP.
Although XRP got legal clarity two years ago, some U.S. institutions have remained cautious. Financial analysts and XRP proponents argue that a clean end to the case could finally unlock real momentum for XRP adoption.
Nasdaq analyst Trevor Jennewine made this point back in March 2025, when he suggested that a final ruling could encourage institutions to embrace XRP more openly. There’s even talk that BlackRock could be waiting for this moment before filing for an XRP ETF. However, this remains speculative.
Ripple’s move to settle the case by accepting the original $125 million penalty and dropping its cross-appeal indicates that it wants to close this chapter and focus on growth.
While the SEC hasn’t confirmed it will drop its own appeal, industry watchers expect that to happen soon. If it does, XRP could benefit from a clearer path forward, especially in the U.S., where regulatory uncertainty has held back broader adoption.
To explore how this could affect XRP’s value, we asked ChatGPT for its bullish price prediction one year after a final resolution, assuming the outcome drives strong institutional interest. At the time, XRP traded at $2.21.
ChatGPT suggested that if institutions like banks and payment firms begin using Ripple Payments and XRP for cross-border payments, then XRP could see a serious price boost. The chatbot predicted that XRP might reach between $8 and $15 within twelve months under those conditions.

Notably, ChatGPT explained that legal certainty would do more than just boost investor confidence. According to the chatbot, it could lead to real-world use of XRP. Interestingly, this could increase demand as financial firms begin using it for settlements.
In turn, that demand could push up the price. ChatGPT also pointed out that this wouldn’t just be a hype-driven rally. Instead, the price increase would likely reflect a mix of growing utility and serious investment.

The chatbot added that XRP already came close to $3 during earlier bull markets in 2017 and 2021, even without institutional adoption or legal clarity. With those pieces now falling into place, a price two to five times higher doesn’t seem out of reach.
DisClamier: This content is informational and should not be considered financial advice. The views expressed in this article may include the author’s personal opinions and do not reflect The Crypto Basic opinion. Readers are encouraged to do thorough research before making any investment decisions. The Crypto Basic is not responsible for any financial losses.
Solana (SOL) is currently trading at $149.05, down a minor 0.7% in recent hours. Despite that minor dip, however, the token’s volume has experienced an unprecedented spike in the last 24 hours to record a 78.7% increase at $5.07 billion. Over the last week, the SOL value experienced relative stability with a minor positive swing of 3.48%, hitting around $149.06.
This recent market trend can be described as a process of consolidation following past volatility, with traders and investors eagerly waiting for imminent triggers of prices and technicals. The strength recorded in trading volumes despite minimal price fall indicates ongoing interest in SOL, which suggests that market dynamics of the coin stand to experience significant events in the short run.
Crypto analyst Sonia S. identifies a bullish pattern in recent SOL price movement. The token has reportedly come out of a downtrend and now consolidates in the area of $148. Notably, the token remains supported by an upward trendline that analysts regard as an important point for continuing upward momentum.

Also Read | REX-Osprey to Debut First Staked Solana ETF on Wednesday; SOL gains 5%
Support that was registered has been at $138.25, and a breakdown through $159 could trigger a huge rally. In case SOL breaks through this breakdown trigger with heavy volume strength, the token can seek higher levels of prices in the region of $180 to $210. Unable to hold back the trendline, it can register a retreat to support of $138, pointing to a correction.
DigitalCoinPrice estimates that SOL has the potential to cross its previous all-time high and may cross anywhere between $295.67 and $327.74 in 2025. They highlight an important milestone at $289.36 that SOL crossed in early January 2025 but also highlight potential dips below $175.45 levels that have not been seen since early 2021.
Changelly’s technical prediction has a less exuberant forecast for 2025. Their forecast states that SOL will trade with an even smaller margin, with prices of $155.27 to $157.06 and an average of around $158.85. The prediction has a moderate ROI of around 4-5.2%, with prices rising incrementally in mid-2025.
Also Read | Backed Finance Launches 60 Tokenized Stocks on Kraken, Bybit, and Solana DeFi
The crypto market remains bullish, however, some cryptocurrencies are back to the red zone, according to CoinStats.CoinStats”>
The price of Bitcoin ![]() BTCUSD has gone down by 0.76% since yesterday.TradingView”>
BTCUSD has gone down by 0.76% since yesterday.TradingView”>
On the hourly chart, the rate of BTC has broken the support of $107,500. However, most of the daily ATR has been passed. In this case, there are low chances of seeing sharp moves by the end of the day.
If bulls cannot seize the initiative, the correction is likely to continue to the $107,000 mark tomorrow.TradingView”>
On the longer time frame, the price of the main crypto has bounced off the resistance of $108,833. If today’s bar closes below $107,200, the accumulated energy might be enough for a test of the $106,000 area soon.TradingView”>
From the midterm point of view, traders should pay attention to the previous bar’s peak. If the weekly candle closes above the $109,000 mark, there is a chance to see a test of the $112,000 resistance.
Bitcoin is trading at $107,332 at press time.
TradingView analyst says no reason for Dogecoin price rally to stop below the dollar valuation, citing bullish trend from historical price structure.
Dogecoin has experienced a short-term dip in sentiment, with its price action reflecting modest volatility in recent days. Beginning near $0.165 on June 25, the meme coin briefly climbed to just above $0.169 by June 30. However, the upward momentum failed to hold, and the price retreated to $0.162 today.
This movement occurs against a prediction for a higher target identified by TradingView analyst Master Ananda.
According to Master Ananda’s chart, Dogecoin continues to be supported by a price structure that started forming in June 2022. At the time, DOGE had fallen significantly from its May 2021 all-time high of about $0.74. Since then, a firm support level emerged, preventing further decline and acting as a launch point for a subsequent rally.

Notably, from the June 2022 bear market low, the analyst reports that Dogecoin surged over 880%, reaching a peak near $0.47 in December 2024. This move aligned with the 0.618 Fibonacci extension level. The Fibonacci-based structure, as interpreted by Ananda, shows future price projections and potential market top formations.
Building on this model, Master Ananda outlined the next target of $1.17 based on a Fibonacci level relating to the 2021 bull market and the 2022 bear market. From the current price of $0.1621, a move to $1.17 would reflect approximately 622% upside. When measured from the June 2022 bottom of $0.05, the growth potential to $1.17 reaches around 2240%, equivalent to over 23 times in value.
Despite this long-term projection, Ananda also noted that markets follow cycles, stating that corrections often follow bullish moves. With Dogecoin returning to what the analyst called “baseline levels,” resistance levels that were cleared in late 2024 will likely need to be tested again. These points include $0.59 and $0.74.
If the broader market does not perform well, several lower resistance levels remain relevant, according to the analysis. The $0.35 level sits just below the last major high and could become significant under declining momentum.
The analyst stated that the $0.70 level should be watched as it was breached in the December 2024 rally. He also identified $1.05 as a potential new all-time high. According to Ananda, there is no reason for the Dogecoin rally in this bull run to stop below $1.
Elsewhere, analyst WIZZ shared a projection for Dogecoin to reach $1, citing analysis from top market watcher Chris. In a June 24 tweet, Chris noted that Dogecoin had bounced from a multi-year support trendline after a 13% correction, suggesting the end of the downtrend.
He predicted a rally beginning in July, potentially pushing DOGE to $1 and even as high as $1.40, while advising holders to take profit at those targets.
DisClamier: This content is informational and should not be considered financial advice. The views expressed in this article may include the author’s personal opinions and do not reflect The Crypto Basic opinion. Readers are encouraged to do thorough research before making any investment decisions. The Crypto Basic is not responsible for any financial losses.
Cardano is currently trading around $0.5660 after a volatile June that saw it briefly dip near $0.50 before rebounding modestly. The Cardano price today is hovering near a confluence of structural supports, while indicators suggest a potential accumulation setup as we move into July.
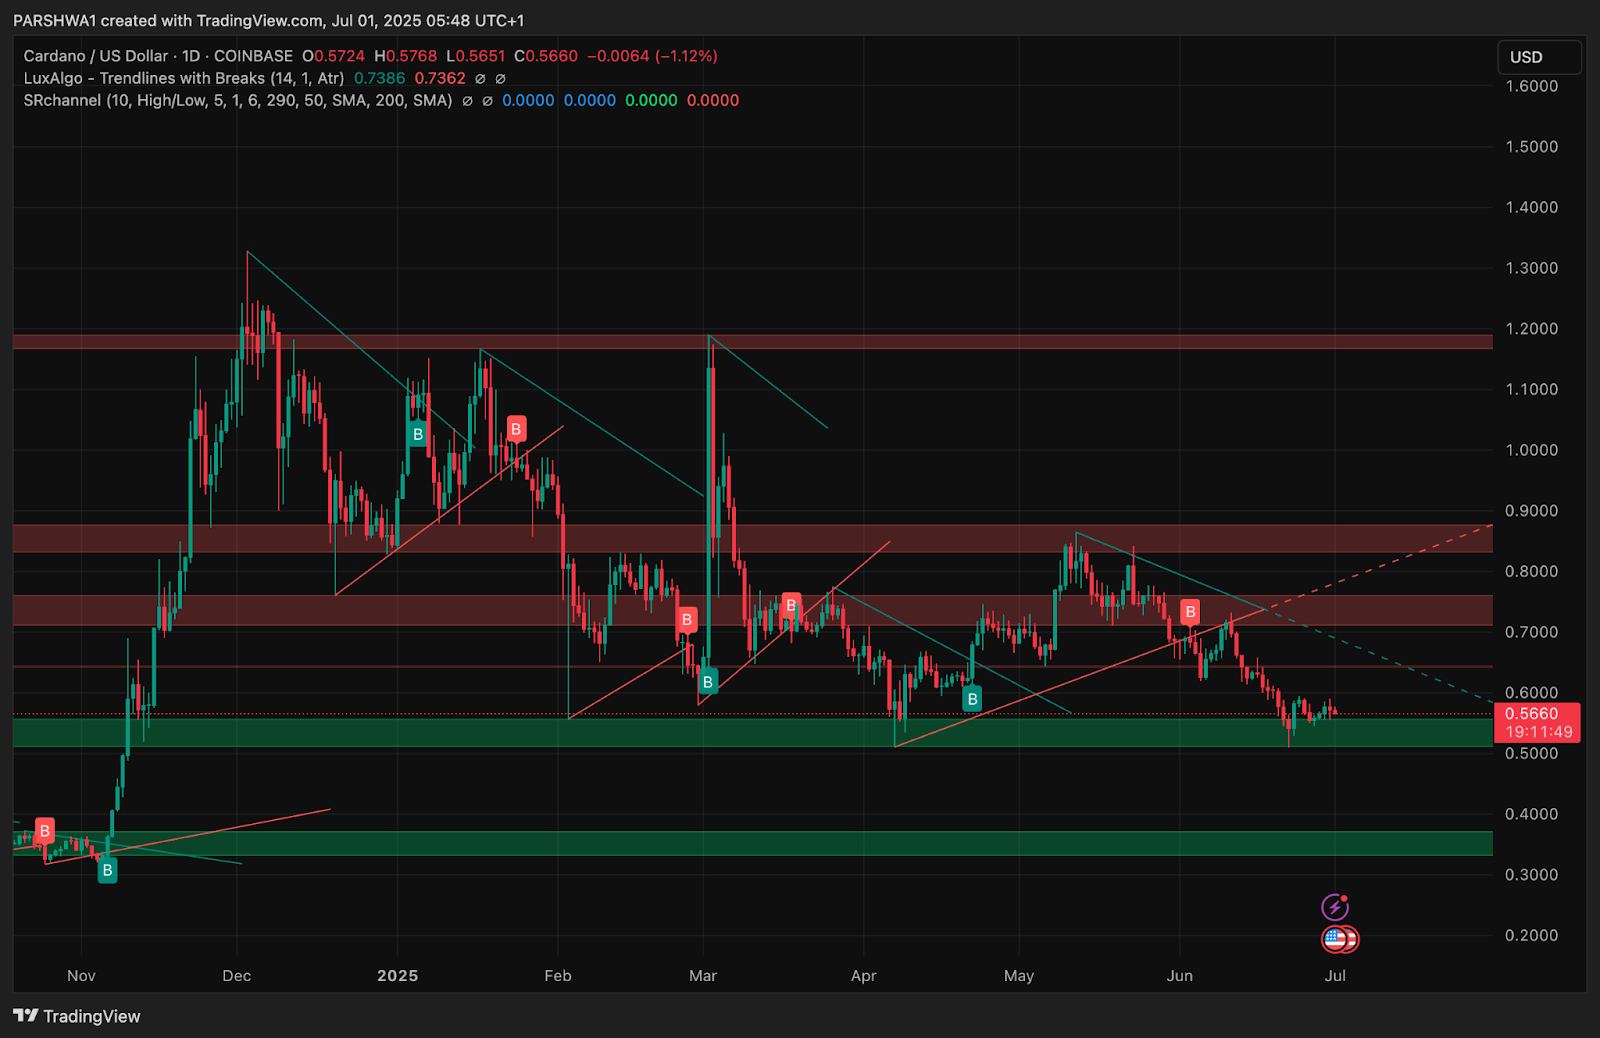
The broader trend on Cardano continues to show a bearish bias, with the daily chart reflecting persistent lower highs and repeated failures near the $0.73–$0.80 resistance range. After a breakdown below the $0.60 handle in June, ADA found support at the 0.786 Fibonacci level ($0.5022), which now serves as a critical zone for bulls.
Currently, the price is consolidating inside a demand block between $0.50 and $0.57, aligning with a historical support structure. A bullish reclaim of the $0.60 handle could be the first signal for a short-term reversal toward $0.65–$0.68, while failure to hold the $0.55 region risks another sweep of lows.
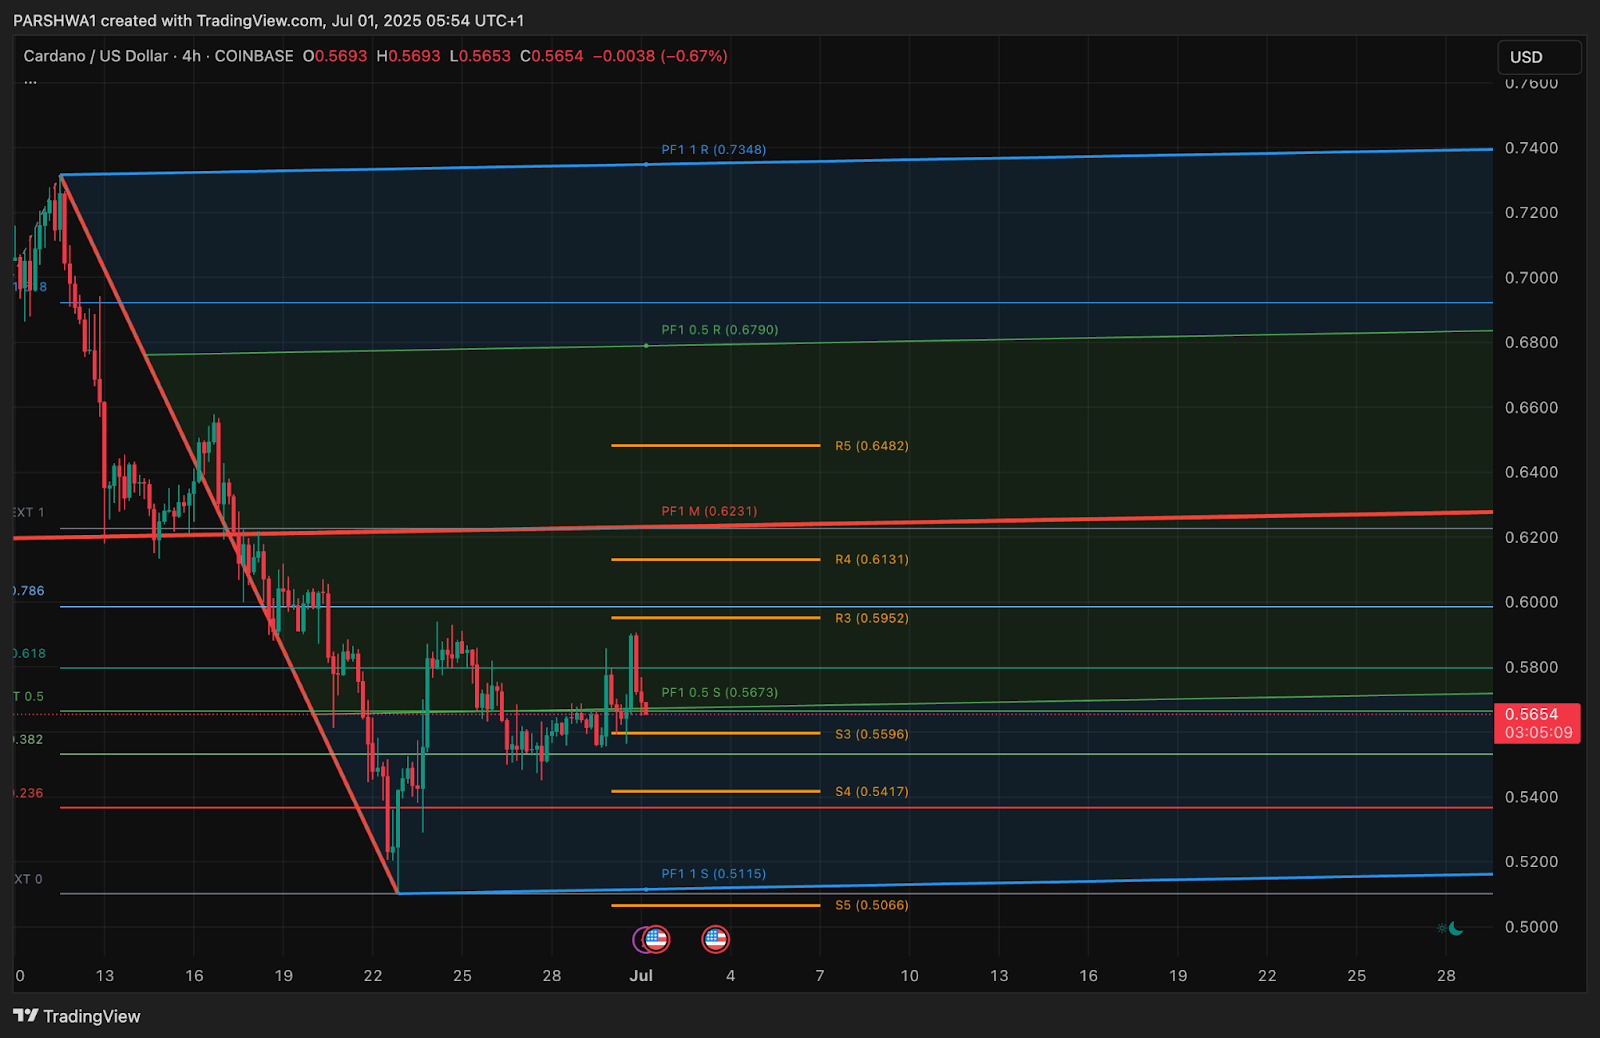
ADA’s structure on the 4H chart shows the asset trading near the PF1 0.5 S pivot at $0.5673, struggling to build momen…
The post Cardano (ADA) Price Prediction for July 2025 appeared first on Coin Edition.
Vincent Van Code, a well-known software engineer and XRP advocate, has shared his long-awaited price prediction for the digital asset.
He explained that while he typically avoids making XRP price predictions, persistent questions from the community prompted him to finally share his view. Specifically, Van Code believes XRP could eventually reach a price between $30 and $50.
For a coin currently trading at just around $2, this would require both its price and market cap to increase by approximately 25 times to reach the optimistic target.
The software engineer emphasized that he does not mean to convince others or generate hype with his opinion. Instead, it reflects his personal conviction.
“…And my opinion is $30-$50. And this is no shill, I don’t expect anyone to agree with me. I am not a prophet or a time traveller.”
According to him, his investment in XRP is based on the belief that XRP could ultimately reach a value of $50.
Notably, a price between $30 and $50 would imply a market cap of approximately $1.78 trillion to $3 trillion for XRP. In contrast, the coin currently has a market cap of only about $130 billion.
Van Code’s price outlook aligns with the popular belief among long-term XRP holders. While XRP has remained around $2 for over five months with little movement, many continue to hope that its value will eventually expand due to real-world utility.
Given the journey from the current price to $50, many wonder when this outlook might materialize. However, Van Code noted that predicting when XRP will reach its target range is not his priority.
“What I’m not so sure about is when. But that’s a minor point,” he noted.
Meanwhile, many other XRP market commentators have issued aggressive timelines for when a $50 price might materialize. A common belief is that XRP could hit that level within this year.
For instance, XRP influencer Dustin Layton went a step further, boldly predicting that 1,000 XRP could yield at least $50,000 in profit by the end of 2025. He urged followers to bookmark his claim, hinting at even greater gains beyond 2025.
In his post, Van Code encourages other XRP holders to share their views without fear of being mocked.
Responding, X user “XRPunkie” stated that his price targets for XRP have consistently ranged between $26 and $33, with potential wicks reaching up to $40. He noted that $27 aligns with the 1.618 Fibonacci extension level on the weekly chart.
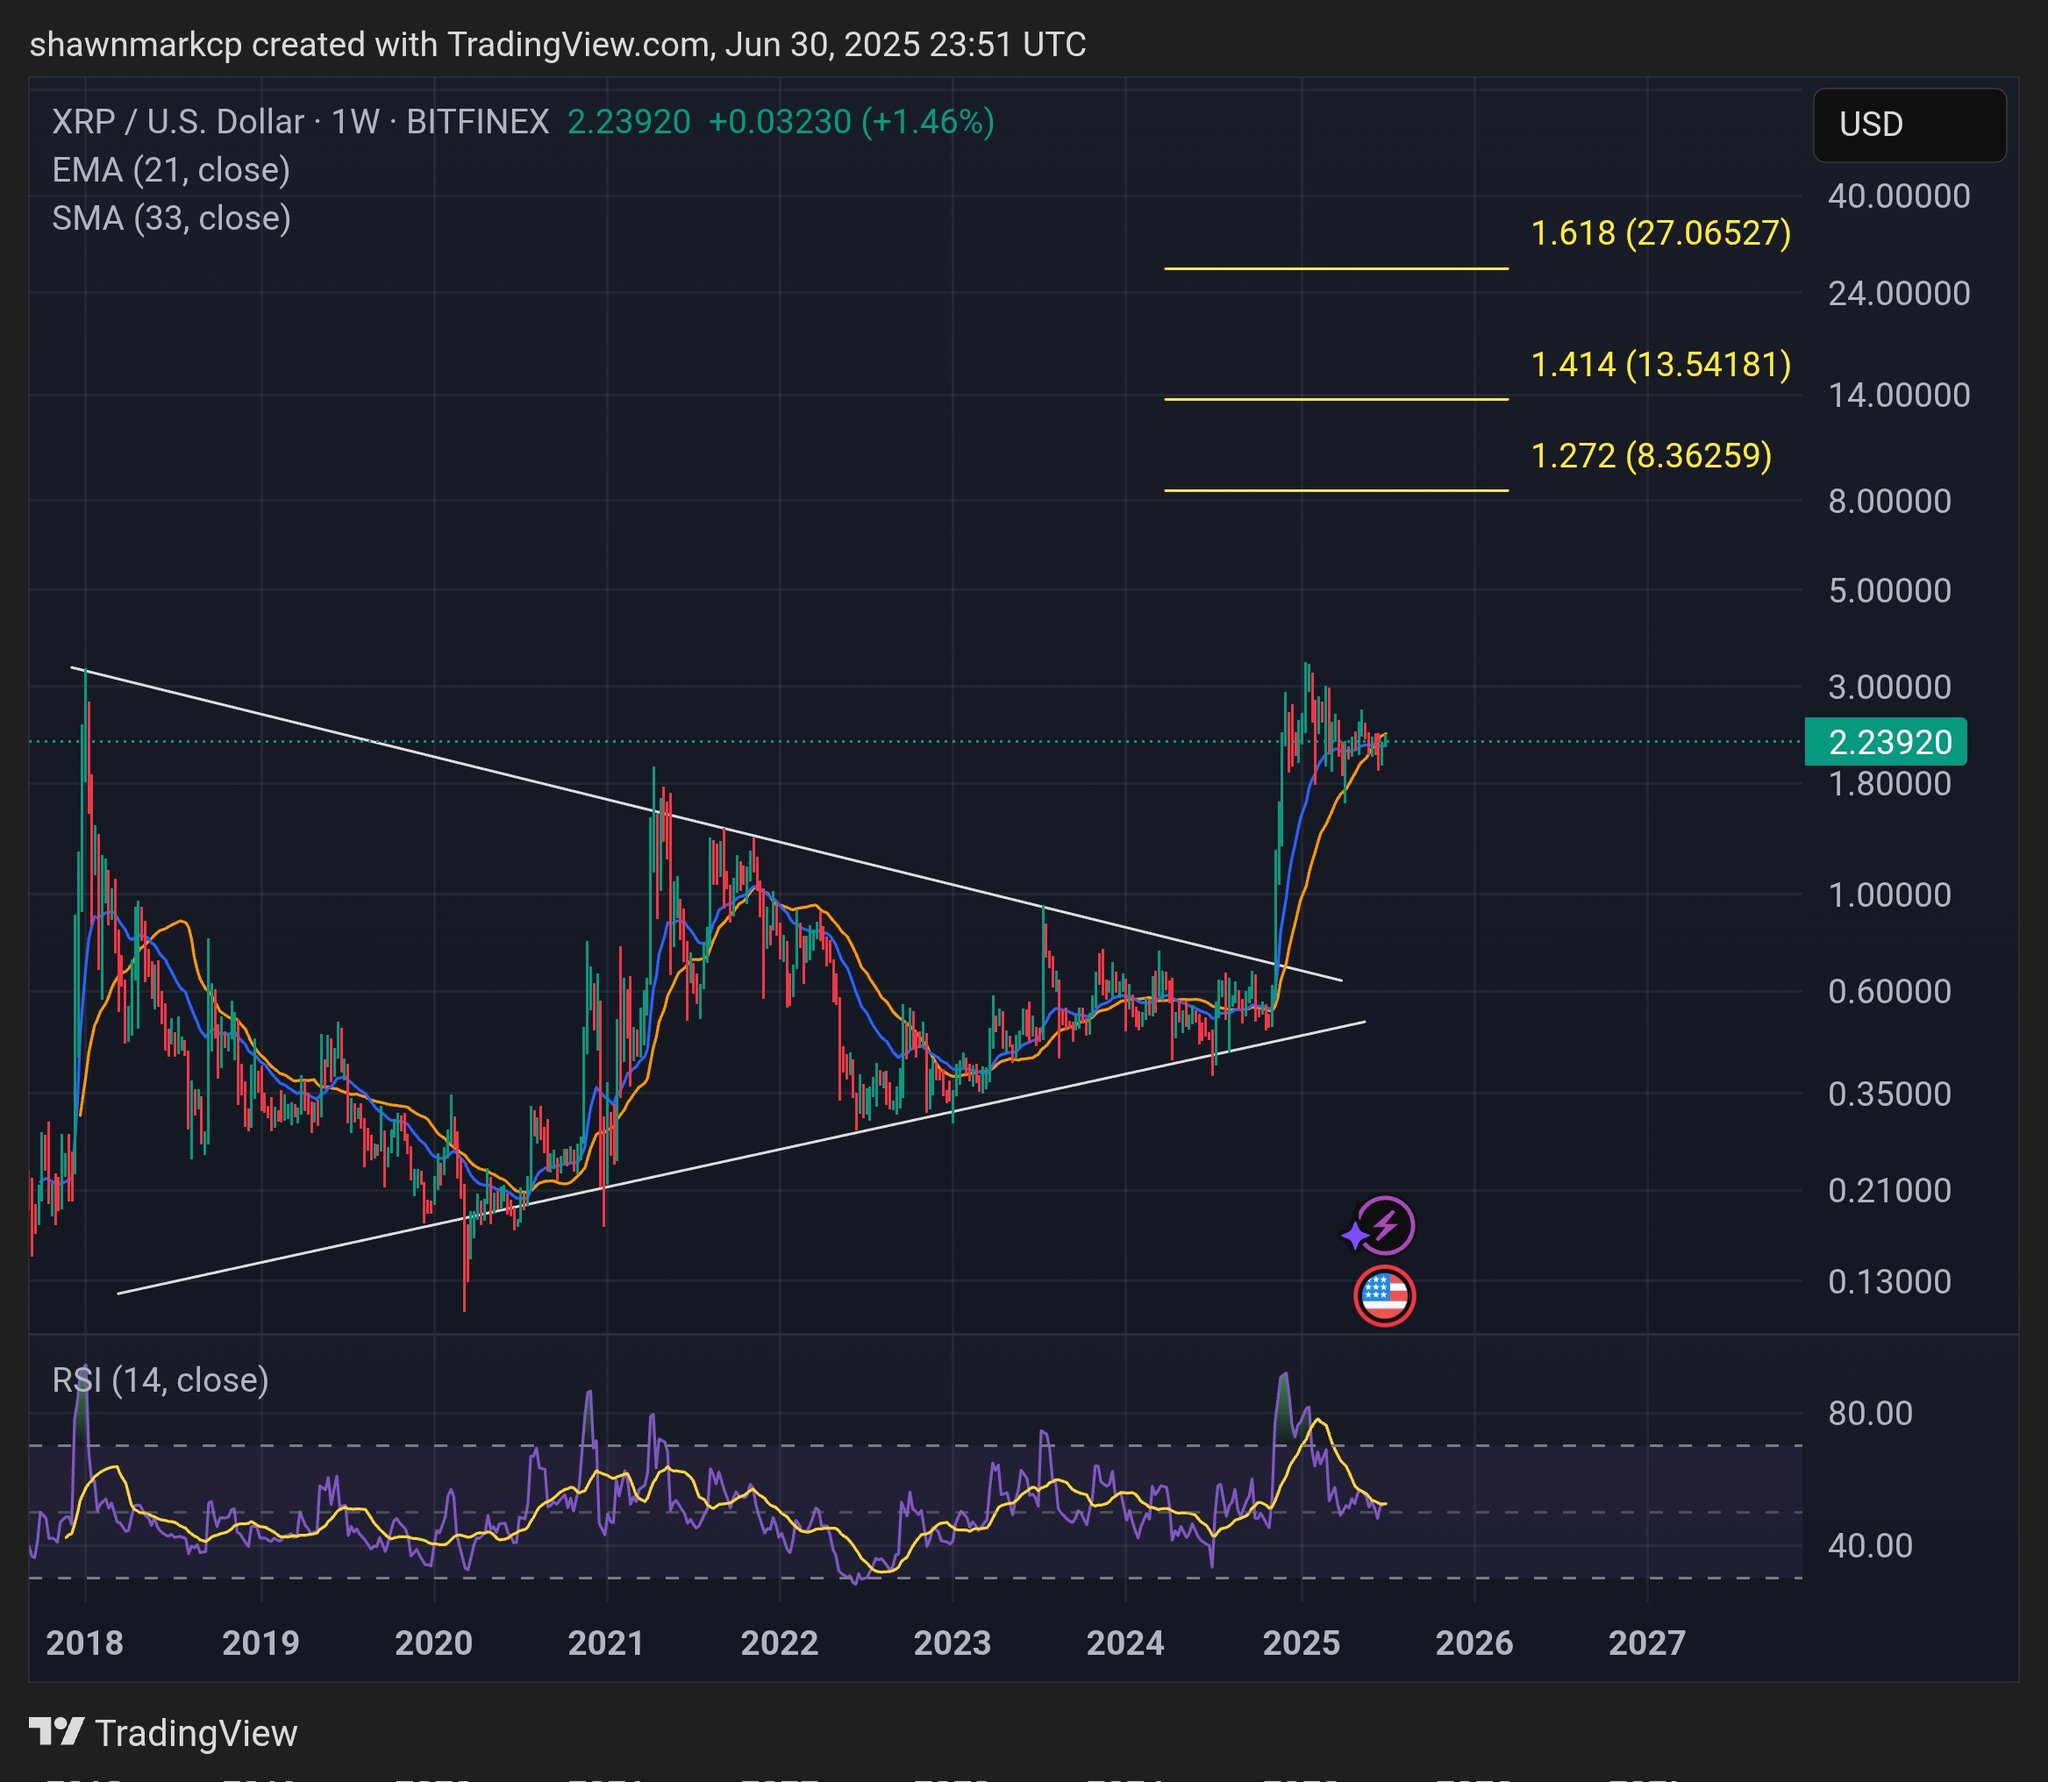
Additionally, he identified the $10–$15 range as a major take-profit zone. However, he suggested that the final wave could overextend, especially with a potential ETF announcement and the resolution of the ongoing lawsuit.
Interestingly, some market commentators argued that Van Code’s $30–$50 XRP target is too conservative, suggesting he may be underestimating XRP’s long-term utility.
One noted that while cashing out at that range may be enough to live comfortably or pay off debt, those aiming to help build the future should consider selling only a portion at that level, and remain patient, even if prices temporarily dip afterward.
DisClamier: This content is informational and should not be considered financial advice. The views expressed in this article may include the author’s personal opinions and do not reflect The Crypto Basic opinion. Readers are encouraged to do thorough research before making any investment decisions. The Crypto Basic is not responsible for any financial losses.
ChatGPT’s o3 AI model processed 42 live indicators and came up with a Solana price forecast as SOL surged 2.95% to $157.85, testing key 200-day EMA resistance. Meanwhile, REX-Osprey launched the first-ever U.S. staking ETF, and Robinhood introduced SOL staking.
Solana is breaking above the EMA support cluster with strong momentum, approaching decisive resistance at $159.65 as Bloomberg analysts upgrade ETF approval odds to 90% for 2025.Source: TradingView
The market cap reached $83.98 billion, and the volume surged explosively to $4.7 billion, 117.53%, indicating institutional positioning ahead of regulatory catalysts.
The following analysis was conducted using ChatGPT’s o3 AI model, synthesizing 42 real-time technical indicators, staking ETF developments, institutional adoption metrics, and ecosystem growth data to assess SOL’s 90-day price trajectory.
The predictions were then reanalyzed and edited together for enhanced readability while maintaining analytical precision.Technical Pulse: Powerful Breakout Momentum Tests Critical Resistance
Solana’s current price of $157.85 reflects a robust +2.95% daily gain from an opening price of $153.32, establishing an impressive trading range between $159.99 (high) and $149.45 (low), a 7.0% intraday spread that demonstrates major volatility expansion typical of breakout attempts.
The RSI at 56.99 sits in healthy bullish territory with substantial room for continued upside without reaching overbought conditions. This positioning indicates strong underlying momentum while maintaining capacity for further appreciation without immediate reversal indicators.Source: TradingView
MACD indicators show a robust bullish structure with the MACD line at 1.99 trading well above zero, confirming strong upward momentum. However, the signal line at -1.65, trading below the MACD line, and the negative histogram reading of -3.64 suggest potential momentum divergence requiring careful monitoring.
Moving averages reveal a powerful bullish alignment, with SOL trading above the 20-day EMA at $148.46, the 50-day EMA at $151.71, and the 100-day EMA at $154.31. Only the 200-day EMA, currently at $159.65, remains above the current price, representing the critical resistance level that determines the near-term trajectory.
The EMA support cluster between $148.46–$154.31 provides a strong technical foundation, with the current price positioning demonstrating a successful breakout above this consolidation zone. Breaking above the 200-day EMA would indicate a complete technical reversal and open pathways to higher resistance targets.Source: TradingView
Volume analysis reveals exceptional activity, with 2.61 million SOL traded daily, representing a 77% surge, indicating substantial institutional and retail participation during this breakout attempt. This volume expansion validates the technical move and suggests sustainable momentum.
ATR readings at 174.67 indicate a high-volatility environment, reflecting the price movements that are possible during directional breakouts. Current positioning suggests potential for continued large daily ranges as institutional positioning accelerates.Historical Price Context: Recovery from Correction Cycle
Solana’s 2025 performance demonstrates the volatile nature of high-growth blockchain assets, with dramatic swings from January’s all-time high of $294.33 to current recovery levels. The year began explosively with SOL closing January at $231.64, establishing new record highs.
February and March witnessed a sharp correction, with SOL declining to $236.30 and $112.00, respectively, representing a correction of over 52.19% from peak levels. This selling pressure established the base for current recovery patterns and created attractive accumulation opportunities.Source: TradingView
April-June showed consistent recovery momentum with SOL rebounding to $147.64, continuing to $186.66 in May, before settling at $150.93 in June.
Current price action above $157.85 represents the continuation of this recovery trend and potential for testing previous highs.
The current price sits 46.45% below the all-time high, though maintaining extraordinary gains of 31,098% from the May 2020 all-time low of $0.5052. This historical context demonstrates both the substantial upside potential and the transformative nature of Solana’s long-term appreciation.Support & Resistance: Critical Levels Define Breakout Success
Immediate support emerges at today’s low around $149.45, reinforced by the EMA support cluster between $148.46 and $151.71. This confluence of technical levels provides a strong foundation for any retracements during the current breakout attempt.
Key support zones lie between $140.00 and $145.00, representing major technical levels and historical accumulation areas. The strong support base spans $120.00–$130.00, corresponding to previous cycle lows and institutional buying zones.Source: TradingView
Resistance begins immediately at the key 200-day EMA at $159.65, representing the largest hurdle for continued bullish momentum. Today’s high at $159.99 essentially tests this level, making the current action pivotal for direction.
Major resistance lies within the $165.00–$170.00 zone, followed by strong resistance at $180.00–$190.00, which represents previous range highs. Breaking these levels would indicate sustained uptrend resumption toward historical resistance at $260.00–$270.00.
The current test of $159.65 resistance represents a make-or-break moment for Solana’s technical outlook, with a successful breakout potentially triggering momentum acceleration toward $180–$190 targets.Historic ETF Breakthrough: First U.S. Staking ETF Launches
REX Shares and Osprey Funds achieved a historic breakthrough with the SEC confirming “no further comments” on their staking Ethereum and Solana ETF filings, clearing the path for imminent launch.
The REX-Osprey Solana staking ETF will trade under ticker SSK, offering an unprecedented combination of SOL exposure and staking rewards.
🚨JUST IN: Nearly $9 million in short positions liquidated as jumped to $160 after the CEO revealed that the first-ever Solana staked ETF will begin trading on Wednesday. — SolanaFloor (@SolanaFloor)
This landmark development represents the first U.S. ETF providing both cryptocurrency price appreciation and yield generation through on-chain staking.
The fund will hold at least 80% of its assets in Solana, with a minimum 50% staked to generate additional returns for shareholders.
Bloomberg ETF analyst Eric Balchunas confirmed the regulatory breakthrough:
“Rex also filed an updated prospectus, which totally filled in. Add it all up, and it appears as though all systems go for imminent launch.”
Rex also filed an updated prospectus, which totally filled in. Add it all up and it appears as though all systems go for imminent launch. is the ticker. — Eric Balchunas (@EricBalchunas)
The unique C-corporation structure bypasses traditional ETF approval processes.
The staking feature addresses a critical limitation identified by institutional investors, with BlackRock’s Robbie Mitchnick previously describing crypto ETFs as “less perfect” without staking capabilities.
JUST IN: BLACKROCK VIEWS ITS ETH ETF AS A TREMENDOUS SUCCESS BUT ACKNOWLEDGES IT’S LESS PERFECT WITHOUT STAKING.“A STAKING YIELD IS A MEANINGFUL PART OF HOW YOU CAN GENERATE INVESTMENT RETURN IN THIS SPACE,” SAID ROBBIE MITCHNICK, BLACKROCK’S HEAD OF DIGITAL ASSETS.Source:… — Mario Nawfal’s Roundtable (@RoundtableSpace)
This innovation could accelerate institutional adoption and set a precedent for future crypto investment products.
Nine asset managers, including Invesco, Galaxy, VanEck, Bitwise, Grayscale, Franklin Templeton, 21Shares, Canary Capital, and Fidelity, have filed for Solana ETFs.
According to Bloomberg analysts, approval odds have been upgraded to 90% for 2025, with potential approval expected within 3–5 weeks.Institutional Adoption Acceleration: Robinhood Introduces Staking
Robinhood announced the launch of Ethereum and Solana staking for U.S. customers, marking a major milestone for mainstream cryptocurrency adoption.
You’ve been asking for this. and staking are now available to U.S. customers. — Robinhood (@RobinhoodApp)
The platform offers approximately 7.5% APY for SOL staking, compared to 2.5% for ETH, showing Solana’s competitive yield advantages.
CEO Vlad Tenev emphasized the strategic importance: “Our latest offerings lay the groundwork for crypto to become the backbone of the global financial system.”
This institutional validation provides direct access to staking rewards through regulated financial services.
The timing coincides with Robinhood’s expansion of its crypto perpetual futures offering, which includes micro contracts for Bitcoin, Solana, and XRP, lowering entry barriers for retail traders.
Robinhood’s European operations have already demonstrated success with Solana staking, opting for SOL due to its shorter bonding period of approximately two days compared to Ethereum’s weeks-long waiting periods.
This operational efficiency drives user adoption and platform engagement.Ecosystem Fundamentals: High-Performance Infrastructure Drives Growth
Solana maintains its position as the sixth-largest cryptocurrency, with a 2.59% market dominance, distinguished by processing over 65,000 transactions per second and achieving sub-second finality.
These technical capabilities support the rapid expansion of decentralized applications across DeFi, NFTs, and payment solutions.
Recent network upgrades, including the Alpenglow enhancement, have improved transaction finality and overall network performance, reinforcing Solana’s competitive advantages over Ethereum and other layer-1 blockchains.
These improvements support sustained ecosystem growth and developer adoption.
Application revenue exceeded $1 billion for two consecutive quarters, demonstrating the economic viability and productivity of Solana’s ecosystem. This revenue generation indicates sustainable demand for network resources and validates the long-term investment thesis.Source:
The network’s Proof-of-History consensus mechanism combined with Proof-of-Stake provides unique scalability advantages while maintaining decentralization.
These technical innovations position Solana as the infrastructure for next-generation financial applications that require high throughput.Market Metrics: Explosive Volume Indicates Institutional Positioning
Solana maintains a market capitalization of $83.97 billion with an extraordinary 24-hour trading volume of $4.65 billion, representing a volume-to-market cap ratio of 5.2%.
The 108.95% volume surge indicates massive institutional positioning ahead of regulatory catalysts.
The circulating supply stands at 601.46 million SOL, representing 88.5% of the total supply of 604.16 million tokens, with an unlimited maximum supply that provides controlled inflation through validator rewards. This tokenomics structure supports network security while maintaining the potential for value appreciation.Source: CoinMarketCap
The fully diluted valuation reaches $94.97 billion, indicating a modest premium to the current market cap, reflecting reasonable inflation expectations.
SOL’s market dominance of 2.59% positions it as a major cryptocurrency with substantial institutional recognition.
Current pricing represents a 46.45% discount to all-time highs, providing attractive entry points for institutional investors seeking exposure to high-performance blockchain infrastructure.
The combination of technical recovery and fundamental developments supports valuation expansion.Social Sentiment: Overwhelming Bullish Community Engagement
LunarCrush data reveals exceptional social engagement with Solana’s AltRank improving to 22, indicating top-tier social performance relative to other cryptocurrencies.
The Galaxy Score of 61 reflects positive sentiment momentum building around recent developments.
Engagement metrics show massive activity with 33.46 million total engagements, 159.57K mentions, and 34.14K creators contributing to discussions.
The social dominance of 12.25% demonstrates Solana’s ability to capture considerable attention relative to its market cap.
Sentiment registers at 83% positive, reflecting community optimism regarding ETF developments, institutional adoption, and improvements in technical performance.
Recent social themes focus on staking ETF launches, Robinhood integration, and ecosystem growth metrics.
Bounced nicely over the past week but is still yet to turn the low timeframe trend back around.Right above we have the Daily 200MA/EMA coming in between $159-$167. I would want to see price trade back above that to start targetting the $180-$200 region again.The SOL Spot… — Daan Crypto Trades (@DaanCrypto) Polymarket Predictions: 92% ETF Approval Odds Drive Optimism
Polymarket data shows strong confidence with a 98% probability of Solana ETF approval in 2025, representing an 18% increase over recent weeks. These prediction market odds reflect sophisticated investor assessment of regulatory and political developments.Source: Polymarket
Specific timing predictions indicate a 68% chance of approval by July 31, 2025. This concentrated timeline creates urgency for institutional positioning.
The high conviction levels reflected in prediction markets indicate institutional analysts expect favorable regulatory treatment under current SEC leadership.Three-Month SOL Price Forecast ScenariosETF-Driven Breakout (Bull Case – 50% Probability)
Successful ETF approvals within 3–5 weeks, combined with continued institutional adoption, could drive sustained appreciation toward $220–$250, representing 39–58% upside from current levels. This scenario requires breaking above $159.65 resistance with volume confirmation.Source: TradingView
Key catalysts include multiple ETF approvals, continued strong adoption metrics by Robinhood, and sustained ecosystem growth. The daily volume would need to be maintained above 3 million SOL to support momentum toward the previous resistance zones, which are around $180–$200.
Technical targets include $180, $200, and $230 based on historical resistance levels and ETF-driven institutional flows. The staking component could attract yield-focused institutional investors seeking alternatives to traditional fixed income.Consolidation Below Resistance (Base Case – 30% Probability)
Failure to break decisively above $159.65 could result in consolidation between $145 and $170, allowing technical indicators to reset while awaiting regulatory clarity. This scenario presents opportunities for accumulation with minimal downside risk.Source: TradingView
Support at the EMA cluster between $148–$154 would likely hold during consolidation, with volume normalizing around 2-2.5 million SOL daily. This sideways action could extend 4–8 weeks pending ETF decision timelines.
Risk management involves monitoring daily closes above $160 for bullish confirmation or below $145 for bearish breakdown signals, indicating a potential move toward deeper support levels.Regulatory Disappointment (Bear Case – 20% Probability)
ETF rejections or extended delays could trigger selling toward $120–$130 support levels, representing 20–25% downside from current levels. This scenario would require unexpected regulatory complications or broader weakness in the crypto market.Source: TradingView
A breakdown below $145 with volume expansion would indicate a potential deeper correction toward major support zones. However, the strength of current institutional adoption trends limits extreme downside scenarios.SOL Price Forecast: Infrastructure Excellence Meets Institutional Validation
Solana’s current position reflects a unique convergence of technical breakout momentum, revolutionary ETF developments, and accelerating institutional adoption.
The 42-signal analysis reveals a cryptocurrency positioned at the forefront of high-performance blockchain adoption.
The launch of the first U.S. staking ETF represents more than incremental progress; it establishes Solana as institutional-grade infrastructure capable of bridging traditional finance and decentralized systems.
Combined with Robinhood’s staking integration, these developments provide mainstream access to Solana’s ecosystem.Critical Levels to Monitor
Resistance clearing above $159.65 remains key for validating bullish breakout potential, while defense of support at $148–$154 provides a foundation for continued upside attempts. Daily closes above $160 would confirm technical reversal completion.
Over the next 90 days, investors should monitor ETF approval timelines, institutional adoption metrics, ecosystem growth indicators, and broader regulatory developments.
