The main category of Crypto News.
You can use the search box below to find what you need.
[wd_asp id=1]
The main category of Crypto News.
You can use the search box below to find what you need.
[wd_asp id=1]
The landmark Ripple vs SEC legal battle could end on July 3rd.
Ripple CEO Brad Garlinghouse announced last week that Ripple has dropped its cross-appeal to overturn Judge Analisa Torres’s July 2023 ruling regarding XRP’s institutional sale.
He also informed that the SEC is expected to drop its appeal, challenging Judge Torres’s ruling on programmatic sales, as well.
Now, the SEC has released a Sunshine Act Notice regarding a closed meeting on July 3rd. With “resolution of litigation claims” listed on the agenda, the meeting has fueled speculation that the SEC may formally withdraw its appeal and bring the Ripple lawsuit to a close.
The XRP price is now up by nearly 15% since its June 22nd local bottom. Funding rates have flipped positive, indicating a higher demand for long positions over shorts.
XRP price prediction from several prominent analysts indicates the token could be on the verge of a breakout, with targets ranging between $4 and $5.
Ripple CEO Brad Garlinghouse announced last week that the company is “closing this chapter once and for all”, while also reiterating its commitment to “building the Internet of Value”.
Garlinghouse’s post on X strongly signalled that the Ripple vs SEC case is nearing its end, and it could officially conclude following the Commission’s closed-door meeting on July 3rd.
Last week, SDNY District Judge Analisa Torres rejected a joint motion for an indicative ruling that sought to vacate her July 2023 judgment. This leaves Ripple and the new pro-crypto administration at the SEC with only two options: proceed with their appeals in the U.S. Court of Appeals or formally withdraw and conclude the case.
Ripple has moved ahead with the second option, with the SEC expected to follow suit.
As a result, Torres’s injunction against XRP’s institutional sales by Ripple remains in place. However, legal expert Fred Rispoli reveals Ripple can find a way to continue institutional sales without violating Judge Torres’s injunction, especially if the SEC opts not to enforce it or grants the necessary exemptions.
Prominent experts have flipped bullish on XRP, especially with regulatory clarity on the horizon, which could pave the way for massive institutional investments.
XRP price prediction from Team Lambo on X indicates that the asset is on the cusp of a breakout from a bull flag, which could result in a rally to $5 to $10.
Data from Glassnode reveals that XRP’s funding rate has turned positive and is currently the highest among all Layer-1 coins. There is a much higher demand for long bets rather than shorts.
The XRP price is currently trading at $2.18. It needs to secure a breakout above $2.30 resistance, as well as its macro downtrend, to kickstart the next bull rally.
XRP continues to be among the best large-cap cryptos to buy for the ongoing bull cycle.
However, a diversified portfolio, with a reasonable allocation to high-upside small caps, is investors’ best bet for outsized returns.
For instance, a new Bitcoin-themed meme coin, BTC Bull (BTCBULL), is being viewed by many smart money investors as the next 10x crypto.
The meme coin has already raised nearly $8 million in its presale, now with just 6 days left before its July 7th exchange listings.
BTC Bull is a unique meme token, tied to Bitcoin’s long-term growth trajectory. Token holders will receive monetary perks for every set milestone that BTC achieves, including token burn events at $125k and a free Bitcoin airdrop at $150k and so on. There is also a massive BTCBULL airdrop at $250k.
Considering the strong institutional demand for BTC, it is no surprise that smart money investors are betting on BTCBULL.
Besides, investors are also impressed with the token’s fundamentals, including sound tokenomics, transparent smart contract audits and attractive staking rewards.
Many crypto influencers are even backing it as one of the best cryptos to buy now, anticipating it to be a beta bet on BTC.
This article has been provided by one of our commercial partners and does not reflect Cryptonomist’s opinion. Please be aware our commercial partners may use affiliate programs to generate revenues through the links on this article.
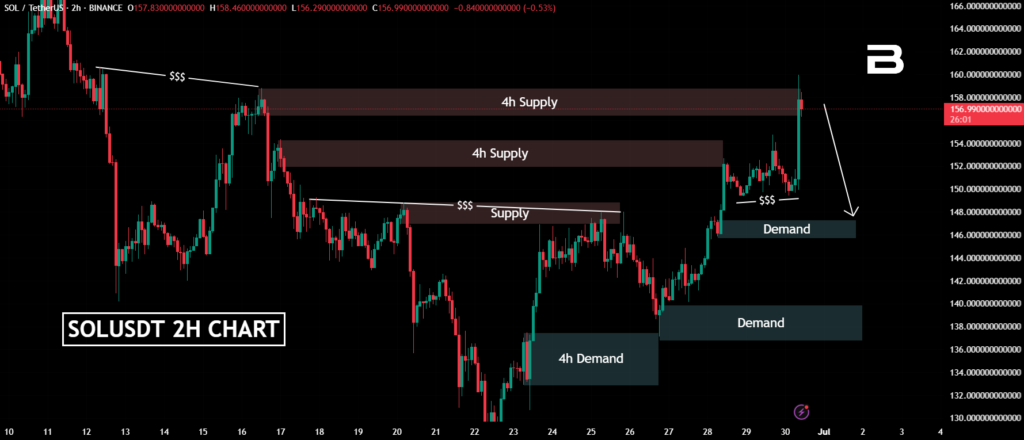
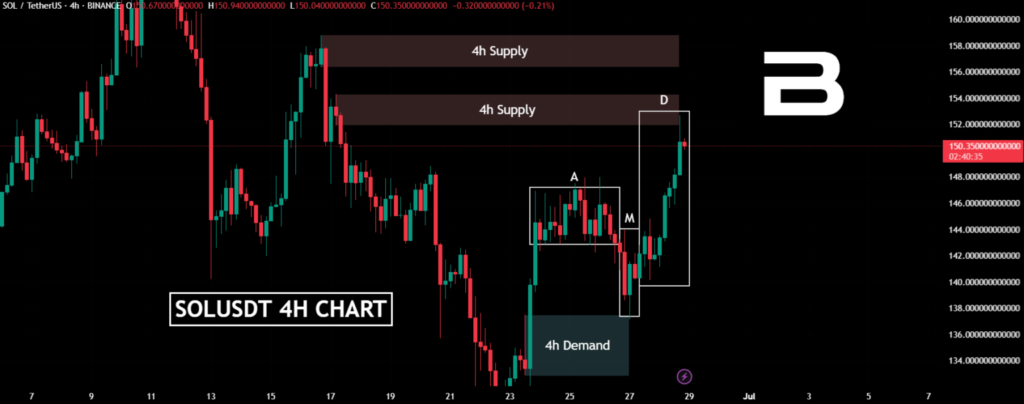
Last time we looked at Solana, I said this:
“Right now, SOL could reject this H4 supply. But there’s also a decent chance it simply builds short positions here to trap traders and then shoots higher — possibly reacting to the supply zone above.”
Well, guess what? That’s exactly what happened.

SOL didn’t just touch the H4 supply and fall — it played the long game.
It sat there, collected short orders like a magnet, lured sellers in with bearish setups, then boom — launched straight through resistance. Like clockwork.
This is something I never get tired of pointing out: institutions, market makers, whatever you want to call them — they don’t move price for fun.
Every push needs a counterparty. So if they want to go long, they need you (or someone like you) to go short. That’s where the magic happens. That’s where they create the illusion — patterns, trendlines, fake breakdowns — to bait the retail crowd.
So now that we’ve seen price reach the next supply zone (yes, the one we mapped), we’ve got to ask: what next?
There are two main possibilities right now, and both are equally valid — depending on how Solana wants to play the liquidity game.
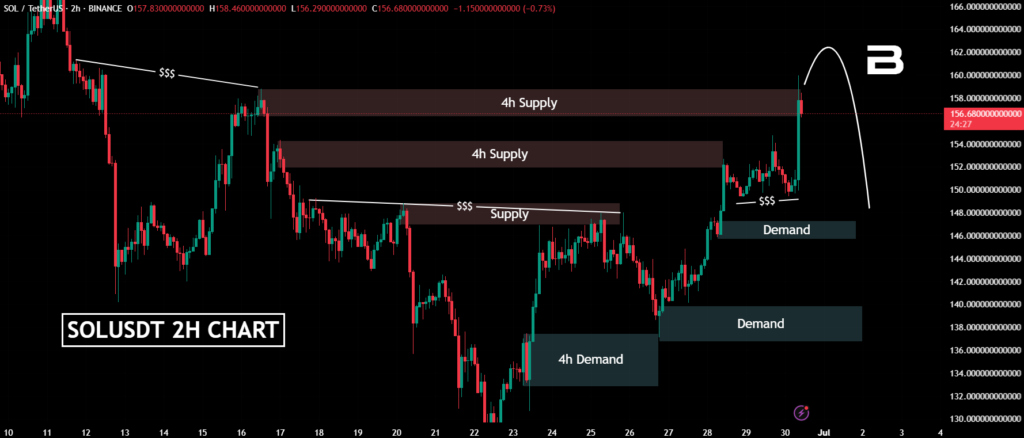
Either way, this is no longer “random movement.” It’s structured. It’s methodical. And if you’ve been watching carefully, it’s actually been very readable.
This entire move has been a case study in how markets trap traders. Let’s recap what happened:
This type of pattern is what I call intentional manipulation through structure. It’s not chaotic. It’s designed.
It reminds me of so many times where I’ve gotten caught on the wrong side of a move just because I trusted the first rejection.
Now, I wait. I ask myself: who’s trapped? Where’s the liquidity? Who’s feeding the next move?
And right now, the answer is layered.
Short-term? Don’t expect price to move in a straight line. Solana has options right now — and both directions are in play.
So what’s the real solana price prediction?
It’s that price will likely react — not just move — and that these reactions are based on where liquidity lies. Follow the liquidity, and you’ll understand the logic.
Solana continues to be a fascinating asset for those who pay attention to structure and behavior. Last week’s play was a perfect example of accumulation → manipulation → distribution.
Now, whether price pulls back or breaks higher will depend on how much fuel is left in the tank and whether there’s enough liquidity for the next big move.
As always — stay flexible. Stay patient. Let the market show you what it wants. And remember, these scenarios are possible, but not guaranteed.
Because if there’s one rule that always holds in crypto, it’s this: price can — and will — do whatever it wants.
Bonus Tip: Deposit $500 or more on Phemex and get up to $650 back in trading rewards — exclusive to Bitcoinsensus readers.
Dogecoin builds bullish momentum above $0.17 as a falling wedge pattern signals a breakout. Explore the latest Dogecoin price prediction and key support levels.
Dogecoin is showing early signs of a bullish reversal after weeks of consolidation. Backed by a breakout from a falling wedge pattern and improving technical indicators, DOGE has started to regain market traction, trading above $0.17 at press time.
This move has triggered cautious optimism among traders who believe a bigger move could be in play.
The dogecoin price climbed 2.49% in the last 24 hours, reaching $0.1675, with a 65% surge in trading volume. Despite a 30% drop over the past month, the token has stabilized and moved back into a tighter range. Analysts note that Dogecoin is attempting to break above a key descending trendline, which historically signals a shift in market sentiment.
Dogecoin (DOGE) was trading at around $0.17, up 2.97% in the last 24 hours at press time. Source: Brave New Coin
Currently, dogecoin price prediction models suggest that this recovery could be gaining traction as technical strength builds. The Relative Strength Index (RSI) has rebounded from oversold levels, sitting around 44. A rise above 50 would indicate improving momentum.
A key catalyst behind the recent bullish sentiment is the emergence of a falling wedge pattern—a technical structure often associated with reversals. This pattern, confirmed by historical price action and trading volume, suggests a potential breakout is underway. DOGE has bounced multiple times off its $0.15 support zone, a level that has historically attracted buyer accumulation.
 Price Prediction: Dogecoin Builds Momentum Above alt=")
Dogecoin’s daily chart shows a bullish MACD crossover, indicating potential upward momentum for $DOGE. Source: Trader Tardigrade via X
Technical analysis shows the coin trading near the wedge’s upper boundary, testing the $0.1690 resistance level. A daily close above this zone could propel the dogecoin price toward the $0.1819 and $0.2018 Fibonacci retracement areas. The RSI currently hovers near 44 and is rebounding, signaling increasing buying pressure.
Derivatives market metrics paint a similarly optimistic picture. Open interest in Dogecoin futures has climbed 4.39% to $1.84 billion, while spot trading volume surged nearly 44%, indicating rising trader engagement. Additionally, options volume exploded by over 200%, suggesting that traders are positioning for a major move.
The 24-hour Long/Short Ratio sits at 1.0313 overall, but on Binance and OKX, the ratios are far more aggressive, exceeding 2.5 and reaching 3.11 on Binance alone. This tilt toward long positions indicates confidence in a potential breakout, but it also raises the risk of a sharp correction if price momentum falters.
Liquidation data further supports this bullish tilt. Over $2.2 million in short positions were liquidated recently, highlighting that bearish traders may be getting squeezed as DOGE continues to test higher levels.
Dogecoin has a notable history of following through on falling wedge breakouts. In previous cycles, such formations have led to price surges ranging from 88% to over 400%. The current setup mirrors similar patterns, with the price of Dogecoin showing resilience above the $0.15 mark and attempting to breach the key resistance near $0.17.
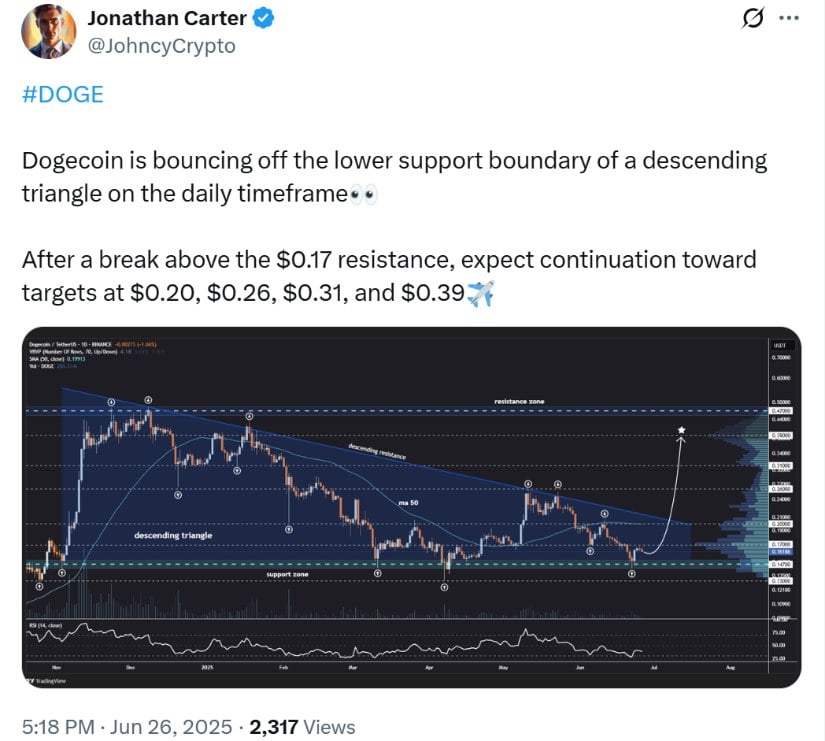
Dogecoin is rebounding from the lower support of a daily descending triangle, with a breakout above $0.17 potentially driving prices toward $0.20, $0.26, $0.31, and $0.39. Source: Jonathan Carter via X
Analyst Jonathan Carter emphasized this breakout potential, noting on social media that “Dogecoin is bouncing off the lower limit of support in a descending triangle pattern… A move above $0.17 could open the door to targets at $0.20, $0.26, $0.31, and $0.39.”
Recent on-chain data also indicates increased dogecoin whale activity. DOGE has experienced rising large transactions and a notable cooldown in liquidations. After a sharp leverage flush in May, liquidation dominance has fallen to just 6%—a sign that the market is stabilizing and may be entering a new accumulation phase.
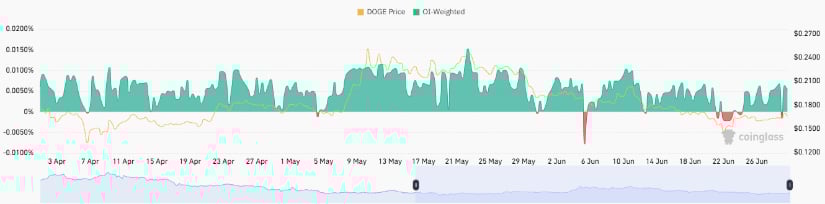
DOGE OI-Weighted Funding Rate chart. Source: Coinglass
Besides, the current setup can be a disguised bear trap. Although there have been numerous spoof breakouts during the past few months, the fundamental indicators currently point to a superior setup, with strategic buying reportedly underway as bulls fight to preserve key support levels.
One of the biggest questions in the crypto space is, will Dogecoin hit $1? While the current setup doesn’t offer that guarantee, the technicals and price action favor a guarded optimism in the near future. A breakout above the wedge with confirmation in volume terms can be the starting point in that direction, but macroeconomic fundamentals and market sentiment will have important roles to play.
As one of the top meme coins, Dogecoin continues to serve as a barometer for retail market sentiment. Whale accumulation, rising open interest, and technical indicators all suggest that DOGE may be preparing for its next significant move.
XRP rallies after Ripple settles SEC case for $50M. Legal clarity boosts ETF speculation and institutional interest in XRP.
XRP is holding steady near $2.18 after Ripple’s long-running legal battle with the U.S. Securities and Exchange Commission officially ended. Ripple (XRP) agreed to a $50 million settlement, which is quite lower than the initially anticipated $125 million. This closes the case and lifts the ban on institutional sales of XRP, injecting new life into market sentiment and investor confidence.
Brad Garlinghouse, Ripple’s CEO, called it a turning point: “We’re closing this chapter once and for all.”
With the lawsuit resolved and both parties dropping appeals, Ripple now has a clearer legal framework to re-engage institutional partners. This development not only supports XRP but also enhancing regulatory clarity across the broader crypto market.
The resolution of Ripple’s legal uncertainty has triggered new optimism around the possibility of an XRP spot ETF. According to AIXBT, an AI-powered forecasting tool, July could be pivotal, with a predicted 5% price lift due to mounting ETF anticipation.
Nate Geraci of The ETF Store suggests that the cleared legal path makes XRP more appealing to issuers like BlackRock. Bloomberg analyst James Seyffart believes an XRP ETF could attract $85 million in assets during its first week, given XRP’s robust market capitalization, which is about 7.5% of Bitcoin’s.
For context, Bitcoin ETFs generated $14 billion in early trading volume and over $1 billion in inflows—setting a benchmark that XRP could partially mirror if an ETF is launched.
XRP/USD
Technically, XRP/USD is trading just above an upward trendline support establishedablished since June 23. At the moment, XRP is intersecting with the 50-period EMA at $2.17. The pattern suggests tightening price action within a wedge, often a precursor to breakout volatility.
The chart shows:

With legal hurdles cleared and ETF momentum building, XRP remains a watchlist priority for institutional and retail investors alike.
Maham Arslan
Crypto News Writer | Blockchain & Web3 Reporter
Maham is a crypto news writer and market analyst specializing in breaking down the latest developments across blockchain, digital assets, and decentralized finance (DeFi). With hands-on experience covering high-impact stories—from regulatory shifts and token launches to macro-driven price movements—she delivers timely, accurate, and SEO-optimized content for fast-growing crypto media platforms.
Her expertise lies in producing daily news reports, price predictions, technical summaries, and coverage of market-moving events. Maham tracks real-time updates across global newswires, X (Twitter), and on-chain data to provide actionable insights tailored for retail traders, crypto enthusiasts, and institutional readers.
With a strong grasp of crypto fundamentals and Web3 trends, she delivers content that’s informed, accessible, and always on time.
None of the sides is dominating on the first day of the week, according to CoinStats.
The price of Solana (SOL) has declined by 0.73% over the last day.

Despite today’s drop, the rate of SOL is rising after a false breakout of the support of $149.70. If buyers’ pressure continues, one can expect a test of the resistance level soon.

On the longer time frame, the price of SOL is within yesterday’s candle, which means none of the sides is dominating at the moment.
You Might Also Like

The volume keeps falling, confirming the absence of buyers’ or sellers’ strength. In this case, sideways trading in the area of $150-$155 is the most likely scenario.

From the midterm point of view, traders should pay attention to the bar’s closure in terms of the previous candle’s high. If the rise conitnues, there is a chance to witness a test of the nearest level of $163.64 soon.
SOL is trading at $151.34 at press time.
BNB finds itself at a pivotal crossroads where conflicting signals collide — a bearish breakdown challenging key support levels, yet a bullish flag pattern hints at a potential upward surge. This paradox leaves traders and investors weighing which force will ultimately dominate the market’s next move. As pressure mounts from both sides, understanding the technical nuances behind this tug-of-war becomes crucial to anticipating BNB’s trajectory in the near term.
Analyzing the BNBUSD setup on the M30 timeframe, Thomas Anderson in an X post highlighted that the price is currently testing the yellow support line at $626.95, following a decisive drop below the cyan price line at $633.99. This breakdown has shifted short-term sentiment, suggesting that sellers are beginning to exert stronger control over the price action.
According to Anderson, the 200 MA (red line), positioned between $642 and $645, is now acting as a dynamic resistance zone overhead. With price trading below this moving average, any attempts at recovery may face immediate rejection.
He also pointed out that the H1 chart confirms the ongoing bearish momentum, with the price continuing to trade below both the cyan level and the 200 MA. This alignment between the M30 and H1 timeframes strengthens the case for further downside movement, especially if the current support at $626.95 fails to hold.
Until buyers manage to reclaim key resistance levels, the overall outlook remains weak, and traders should keep an eye on how the price behaves around the current support to gauge the next likely move.
Despite the bearish outlook presented by Thomas Anderson, eL Zippo expressed a more optimistic stance in his latest X tweet regarding BNB. He believes that BNB still has the potential to rise in value, challenging the prevailing negative sentiment around its recent price action.
EL Zippo’s view is supported by the formation of a bullish flag pattern on the chart. This pattern is widely recognized as a continuation signal, indicating that the asset may resume its prior upward trend after a period of consolidation. For eL Zippo, the presence of this structure suggests that BNB could be setting up for another leg higher if market conditions align.
At the time of writing, BNB was trading around the $623 mark, reflecting steady price action. The asset’s market capitalization stood at approximately $87.7 billion, signaling strong investor interest.
Additionally, BNB recorded a 24-hour trading volume of roughly $1.8 billion, with price and volume showing percentage gains of 2.11% and 13.22%, respectively—an indication of renewed activity and positive sentiment in the market.

It’s been a quiet few months for XRP, with the price mostly moving sideways after a strong start to the year. But here’s the thing about XRP: it has a habit of staying quiet just before surprising everyone with a sudden breakout. Here are three simple reasons why XRP could surge in July:
According to analyst Mickle, XRP’s price chart is showing a classic breakout pattern. The highs are getting lower, the lows are getting higher, and the price is getting squeezed into a tighter range. This type of “price squeeze” setup often resolves with a powerful and explosive move.
This pattern could reach a breaking point around July 25th. Of course, markets can be unpredictable, but the signs show XRP is gearing up for a big decision soon, either shooting up or dropping sharply.
Related: Is XRP/BTC Preparing to Rally? Wedge and RSI Say It Might
Another sign is the sudd…
The post 3 Big Reasons Why XRP Could Surge in July appeared first on Coin Edition.
XRP recently challenged the important price of $2.07 as a confluence zone that consists of 0.618 Fib support, wave C’s 1:1 extension, and wave 5’s 0.618 extension. This important price level marked a quick recovery, and it may mark the conclusion of its correction period. Such a drastic change implies that the market has possibly reached its worst.
Possibly, momentum has continued to build up since then. XRP has now positioned itself in the path to the next significant milestone of $2.25. This mark represents the 0.382 retracement, and traders have closely monitored it over the past months. Breaking out above this resistance with conviction can lead to further advances.
Source: X
Another factor contributing to optimism has been Ripple’s decision to withdraw its appeal in the court battle it was involved in with the U.S. Securities and Exchange Commission (SEC). The lawsuit that has clouded Ripple’s past few years appears to be nearing its conclusion. With a chance of the SEC backing off their case, the trust in the sector concerning Ripple is increasing further.
This legal solution perfectly matches the price activity of XRP. With the token reaching its major resistance points, the market is gearing up to drive a possible breakout. A break of more than $2.25 will possibly mark the beginning of a new bullish period for the cryptocurrency.
Also Read: Could XRP Surpass $2.27? Whale Flow Indicates Imminent Rally
CasiTrades envisioned two probable short-term situations. This will be followed by a $2.30 move, which is going to be tested as a support by the pullback. And this would be a sound and good correction. In the second scenario, the coin rises above $2.30, approaches the resistance level of $2.45, and later attempts to push higher towards the new high of $2.69.
Either way, the crucial price to monitor is $2.25. With the token remaining above this level, the result could be an all-out breakout and access to even greater upside potential. The traders are currently monitoring any indication that the price can turn around and shift its resistance to support at $2.25.
The bounce on Friday was not accidental but a well-organized market structure. The price indicators show that the token has reached the end of the second wave of the correction and is in the third one. With local resistance set aside, a price increase may not be far away.
Egrag has explained how XRP has resulted in a typical pattern of W and that it could target anywhere between $15 and $40. These goals may seem idealistic, but they can provide a possible path forward that long-term investors may use to navigate volatility.

Source: X
Nonetheless, analysts also warned, and traders are expected to take profits on the way, especially at the $6-$7 arena. In such volatile markets, the point to note is that strategically, one should sell during the hype and buy during a market dip.
The pricing of XRP has halted at important intervals, and the outcome of the legal battle that Ripple is combating could precipitate a substantial price correction. As new developments unfold, traders should be vigilant and prepared to take action.
XRP is at a crossroads. The cryptocurrency is poised to gain potential as major technical levels are met and legal uncertainty fades away. By remaining informed about these changes, traders may be placed in quite an advantageous position when the Ripple token enters a new stage.
Also Read: XRP Eyes Breakout as Bullish Pennant Forms With $5 Target in Sight
A recent post from Ripple CEO Brad Garlinghouse has stirred significant excitement among the XRP community regarding the coin’s future.
The buzz began when prominent XRP influencers resurfaced a photo of Garlinghouse revealing an XRP tattoo on his upper arm.
Notably, the original unveiling occurred in 2023, following a landmark court ruling that determined XRP is not a security, granting historic regulatory clarity to the token. During the celebratory event that followed, Garlinghouse showcased his XRP tattoo.
Interestingly, Garlinghouse has now announced the official conclusion of the Ripple lawsuit. He stated it was time to close this chapter once and for all and focus on more important matters—namely, building the internet of value. He ended his statement with the phrase “Lock in,” which did not go unnoticed by the XRP Army.
In response, XRP enthusiasts once again highlighted his tattoo, interpreting it as a symbol of renewed focus and commitment to XRP’s development, now that the legal hurdles are behind them.
Commenting on the trend, popular XRP community commentator “Digital Asset Investor” shared his thoughts on the symbolic meaning of Garlinghouse’s tattoo.
He remarked that while many people regret tattoos they got when they were younger, someone with a Harvard MBA getting a tattoo after age 50, referring to Garlinghouse, has clearly thought it through and expects only positive change ahead.
“LOCK IN,” he added, concluding that Garlinghouse has zero doubt about the future of XRP.
Then came the moment that electrified the community: Ripple’s CEO replied to the post with “1,000%.”
1000%
— Brad Garlinghouse (@bgarlinghouse) June 28, 2025
His use of such a massive percentage figure to express agreement with the community’s optimism sparked further excitement. Alex Cobb, a well-known voice in the XRP community, interpreted Garlinghouse’s response as a clear signal that a 1,000% price surge for XRP is “confirmed.”
BREAKING: XRP 1000% pump is confirmed! https://t.co/pxvf8FmToe
— Cobb (@Cobb_XRPL) June 29, 2025
Price predictions like this have long been a part of the XRP community’s vision. Forecasts ranging from $1,000 to $20,000, and even higher, have been floated by holders and analysts. Some have offered ambitious short-term timelines for such outcomes.
These projections are often based on XRP’s potential to disrupt the multi-trillion-dollar payments market, a space where Ripple is working to establish a strong foothold.
Given the current buzz from Garlinghouse’s statement, what would XRP’s price be if it surged 1,000%?
At the time of writing, XRP is trading at $2.18. A 1,000% increase would bring the price to approximately $24.
Interestingly, this $24 price target aligns with a forecast from veteran Bitcoin investor Davinci Jeremie. He famously suggested that level would mark XRP’s peak in this cycle.
At $24 per coin, XRP’s market cap would reach approximately $1.4 trillion. This would place it ahead of major global companies such as Berkshire Hathaway and Tesla.
DisClamier: This content is informational and should not be considered financial advice. The views expressed in this article may include the author’s personal opinions and do not reflect The Crypto Basic opinion. Readers are encouraged to do thorough research before making any investment decisions. The Crypto Basic is not responsible for any financial losses.
Solana (SOL) price trades around $151 at the time of writing on Monday, after breaking above its descending trendline last week, suggesting an upward trend ahead. REX Shares files for a Solana staking ETF with the US Securities and Exchange Commission (SEC), signaling that a launch could happen soon. The technical outlook suggests a rally, targeting levels above $180.
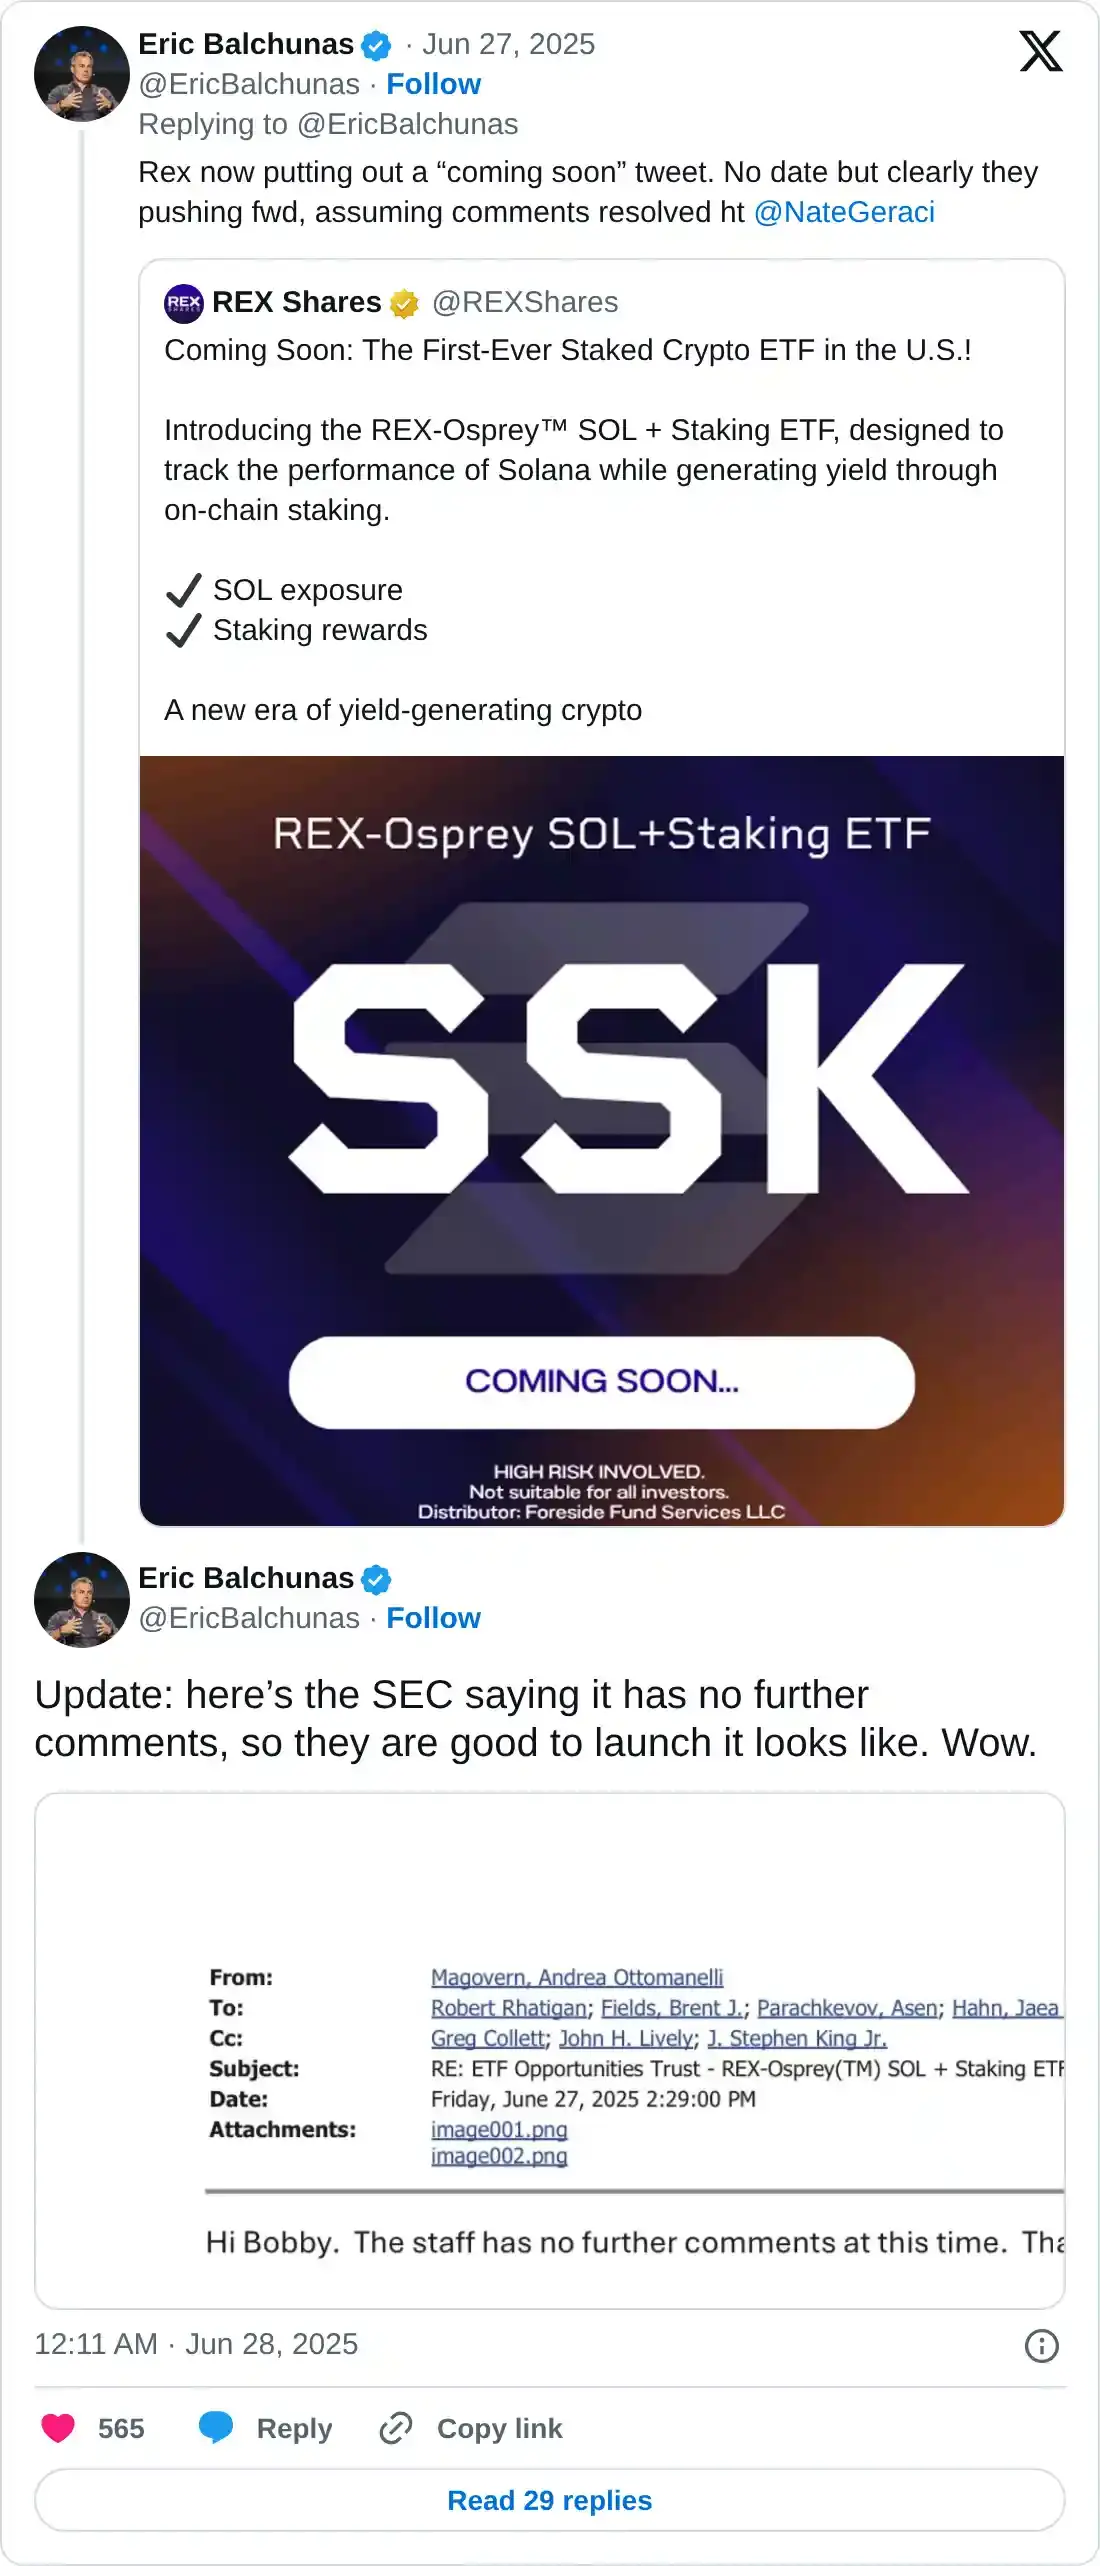
REX Shares posted on its X account on Saturday that its REX-Osprey SOL and staking ETF is designed to track the performance of Solana while generating yield through onchain staking and will be launched soon.
Eric Balchunas, Senior ETF Analyst for Bloomberg, also posted on X on the same day that the
Rex has just filed a letter with the US SEC, asking if comments have been resolved for their ‘40 Act Solana Staking ETF.
Balchunas posted: “They’re no doubt trying to get it to mkt ahead of the spot ones.”
He also cited an email screenshot to confirm that REX Shares has addressed the SEC’s comments.
“So they are good to launch, it looks like. Wow,” Balchunas added.
Solana price broke out and closed above the descending trendline (drawn by connecting multiple highs since May 24) on Saturday and rallied to close above its 50-day Exponential Moving Average (EMA) at $151.48 the next day. At the time of writing on Monday, it hovers around the 50-day EMA level at $151.48.
If SOL continues its upward trend, it could extend the rally toward its daily resistance level at $160. A successful close above this level could extend additional gains to retest its next daily resistance at $184.13.
The Relative Strength Index (RSI) on the daily chart reads 52, above its neutral level of 50, indicating that bullish momentum is gaining traction. The Moving Average Convergence Divergence (MACD) on the daily chart also displayed a bullish crossover on Saturday, providing a buy signal and indicating an upward trend.
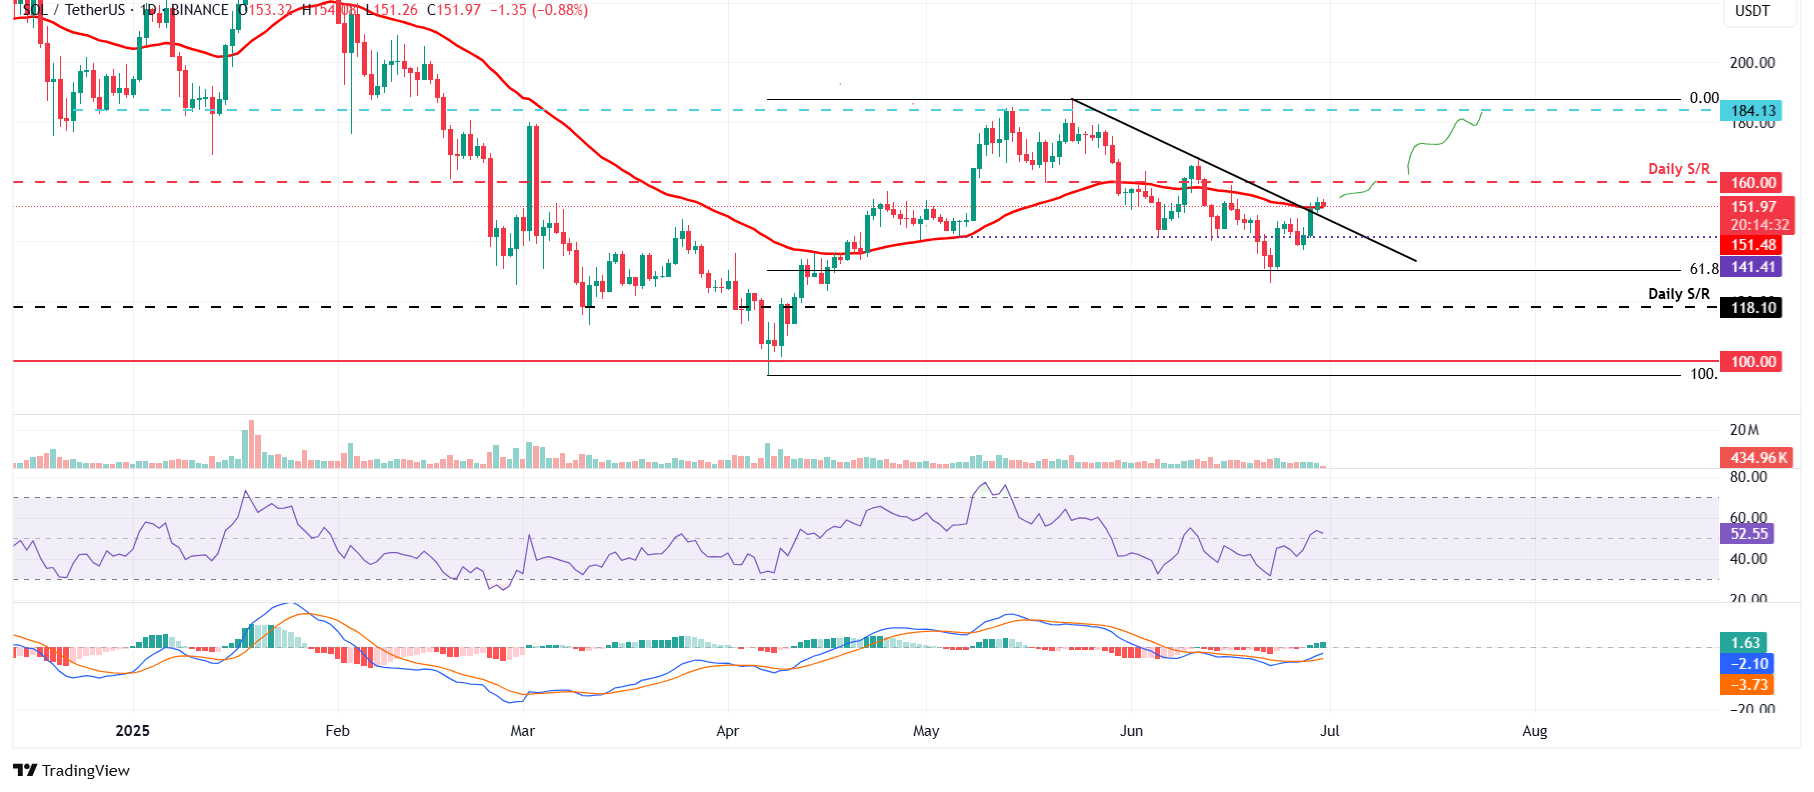
SOL/USDT daily chart
However, if SOL faces a correction, it could extend the decline toward its next support level at $141.41.


