The main category of Crypto News.
You can use the search box below to find what you need.
[wd_asp id=1]
The main category of Crypto News.
You can use the search box below to find what you need.
[wd_asp id=1]
Solana has signed an MoU with Kazakhstan to establish Central Asia’s first SOL-based economic zone. This strategic move helps it tap into a region responsible for nearly 20% of global crypto trading volume. This strategic move positions Solana as a pivotal infrastructure layer in one of crypto’s fastest-growing markets.
The news has sparked interest among investors, who are now keenly watching Solana’s price moves for short-term trade insights. While the MoU provides a long-term tailwind, the immediate question on traders’ minds is: Can SOL build momentum to bounce back from current lows? In this Sol price analysis, I take you through Solana’s network health and how it could perform on the charts.
On-Chain Metrics Fuel Solana?
According to data from Artemis, Solana maintains a leading position in both daily active addresses and transaction volume. Solana network averages over 1 million daily active users, significantly outpacing Ethereum, Avalanche, and Polygon.
On the transaction front, Solana logs 100–120 million daily transactions, showing scalability and usage consistency. This high throughput reflects sustained developer and user activity across DeFi, NFTs, and new consumer-facing apps. It also builds a compelling case for Kazakhstan’s decision to select Solana as its blockchain of choice.
Solana Price Analysis:
Solana, at the time of press, is trading at $134.49, down 0.67%, but rising volume suggests growing buying interest. The RSI has rebounded from oversold levels of 33.01 to 40.73, signaling a possible trend reversal. SOL has bounced from strong support at $129, while the 20 SMA at $137.46 remains the next key hurdle.

Successively, a breakout could push prices toward $148, $152, and $156.88, respectively. On the downside, $129 remains the critical support to watch. With fundamentals strengthened by the Kazakhstan MoU and on-chain activity strong, SOL appears poised for a short-term rally, provided the momentum holds.
Also read our Solana ![]()
![]() SOLUSDT Price Prediction 2025, 2026-2030!
SOLUSDT Price Prediction 2025, 2026-2030!
FAQs
1. Is the Kazakhstan MoU significant for Solana?
This MoU gives access to ~20% of global crypto volume. Hosting the first SOL economic zone could scale Solana’s regional adoption.
2. What’s the short-term price analysis for SOL?
If bullish momentum continues, SOL could test $148, then $152 and $156. Key support is at $129.
3. How much is Solana today?
The price of 1 SOL at the time of press is at $134.14, with an intraday change of -0.34%
XRP community commentator Xena has insisted that the XRP price will not go back below the $1 mark despite growing bearish pressure.
Xena’s latest comments come on the back of the intense bearishness that has slipped into the crypto market amid the conflict in the Middle East. Notably, over the weekend, the United States launched a strike on Iran, targeting Isfahan, Fordo, and Natanz, major Iranian nuclear sites.
The development triggered concerns of further escalation of the already tense situation between Iran and Israel, leading to a cascading effect on the markets. From June 20 to 22, the broader crypto market lost $250 billion, dipping below the $3 trillion mark for the first time in over a month.
XRP was also a victim of this market-wide collapse, slumping below the pivotal $2 level over the weekend for the first time since April 11. The asset crashed to a 10-week low of $1.90. While this downturn sparked fears of a steeper collapse, Xena remains confident in XRP’s resilience.
She shared a snapshot of this decline but affirmed that XRP would not go back to trading in the cents region, referring to a price level below $1. Recall that XRP completely conquered the $1 price mark during the Trump-led rally in November 2024. This was the first time XRP traded above $1 in three years.

Interestingly, two weeks after reclaiming $1 in mid-November 2024, XRP surged further to recover the $2 level in December for the first time in seven years. Remarkably, despite the correction and bearish consolidation that have dominated the market since February 2025, XRP has held strong.

Specifically, XRP has failed to even retest the $1 price support since November 2024, skyrocketing well above it since then. This reality has contributed to the optimism recently displayed by Xena, a staunch XRP permabull. XRP has also struggled to maintain the $2 price despite occasional dips below it, another contributing factor to the confidence.
For instance, after the latest drop below $2, XRP has again recovered the price region, as the broader market recoups some of the weekend losses in the new week. Now, with XRP currently changing hands at $2.03 as of the time of reporting, it sits in a delicate position, as any mild bearish push could again trip it below $2.
However, despite this delicate situation, pundits like Xena believe a further collapse below $1 is improbable. As far back as November 2024, when XRP still traded for $1.57, market analyst The Bearable Bull insisted that XRP would never trade below $1 again. This projection has held up so far.
Nonetheless, some bearish suggestions exist. For one, market veteran Ali Martinez called attention to a head-and-shoulders structure on the daily XRP chart three months back. While he did not predict a drop below $1, he did suggest XRP could reach the $1 support.
Further, last December, analyst “IncomeSharks” predicted a possible drop to $0.6, claiming XRP could lose all its gains from the previous rally. This projection has still not materialized.
Meanwhile, when pundit Edoardo Farina asked what investors would do if XRP dropped below $1 again, Black Swan Capitalist founder Vandell Aljarrah suggested he would buy more at the dip. At the current price of $2.03, XRP is down 7.7% over the past week.
DisClamier: This content is informational and should not be considered financial advice. The views expressed in this article may include the author’s personal opinions and do not reflect The Crypto Basic opinion. Readers are encouraged to do thorough research before making any investment decisions. The Crypto Basic is not responsible for any financial losses.
Given its utility and prominence in the crypto market, many see XRP as one of the digital assets likely to endure over the coming decades.
As a result, projections about XRP’s future price are both high and ambitious. Currently trading around $2, many have speculated that the coin could reach as high as $10,000 in the coming decades.
This article compiles commentary from various experts on where XRP’s price could be in 15 years (2040) and 25 years (2050).
According to Matthew Brienen, COO of CryptoCharged, XRP could be trading as high as $1,000 during the 2040s. He expressed this in a viral video, highlighting XRP’s utility in the multi-trillion-dollar cross-border payment market.
This would represent a massive 46,411% increase from XRP’s current price of around $2.15. Moreover, such a valuation would imply a market cap of approximately $60 trillion, assuming the circulating supply remains around 60 million tokens.
Notably, analysts at the crypto exchange Changelly agree with Brienen’s perspective. They have projected prices as high as $1,456 for XRP by November 2040. This would mark a 66,997.5% return on investment (ROI) from today’s price.
However, the exchange also noted that if this four-digit valuation does not materialize, XRP could still average in the triple-digit range. Their lowest projected price for XRP by 2040 is $181.72. This would still represent an 8,352% ROI from today’s value, a substantial return.
Telegaon analysts also share a bullish outlook. They forecast a minimum price of $119 and a maximum value of $160.34 for XRP in the next 15 years.
For investors holding 10,000 XRP (worth about $21,500 today), even the most conservative estimates suggest that the portfolio could rise to over $1.2 million. In the most ambitious scenarios, the investment could grow to more than $14 million.
Looking further ahead, XRP’s long-term outlook becomes even more optimistic. According to Changelly, the minimum projected price for XRP by 2050 is $1,389.58. For holders of 10,000 XRP, this would equate to a portfolio worth nearly $14 million in a conservative scenario.
Interestingly, Changelly’s analysis suggests that XRP could reach a maximum of $2,355 by 2050, an astonishing 108,448.4% increase from today’s price.
On the other hand, Telegaon’s analysts offer more modest projections. They forecast a maximum price of $285.56 for XRP by 2050. While this is significantly lower than Changelly’s estimate, it would still result in considerable gains. At that price, a 10,000 XRP portfolio would be worth approximately $3 million.
While there’s no guarantee that XRP will hit any of these projected prices, the overall consensus is optimistic that it will be significantly higher than its current value over the next few decades. Several factors could contribute to XRP’s growth:
Numerous financial institutions have included XRP in their treasury reserves, with collective holdings estimated at over $1 billion.
DisClamier: This content is informational and should not be considered financial advice. The views expressed in this article may include the author’s personal opinions and do not reflect The Crypto Basic opinion. Readers are encouraged to do thorough research before making any investment decisions. The Crypto Basic is not responsible for any financial losses.
Cardano is testing a crucial support near $0.50, with bearish momentum building and a potential retest of April lows now on the table.
Cardano is starting to lose its footing after another failed attempt to push higher. The recent move off support lacked strength, and now the price is sliding back toward familiar lows. Momentum has shifted, the setup is beginning to look fragile, and sentiment is turning cautious as key levels come back into focus.
Cardano is trading around $0.55, down -5.83% in the last 24 hours. Source: Brave New Coin
Cardano is now standing down in one of the most important levels in recent days. According to Coin Bureau Trading, ADA is approaching high-time-frame support at $0.49, a zone that represents both the point of control and the highest volume node within its current trading range. This isn’t just a random level; it’s a structural pivot that has historically separated bullish continuation from full breakdown.

ADA Cardano price approaches critical support at $0.49, a key structural level that could define its next major trend. Source: Coin Bureau Trading via X
If this $0.49 level holds, the upside target opens toward $1.19, aligning with prior macro highs and liquidity gaps. But if ADA slips below this support, especially with volume, it could trigger a fast move down to the $0.30 region, where previous capitulation zones lie.
Building on the critical $0.49 level identified earlier, new analysis from Man of Bitcoin adds more caution to the short-term picture. ADA remains stuck under a descending trendline, and as long as it stays capped there, price action looks biased for at least one more sweep lower. The chart highlights a possible wave structure pointing towards a low in the $0.510 to $0.505 range, right in the green demand zone.
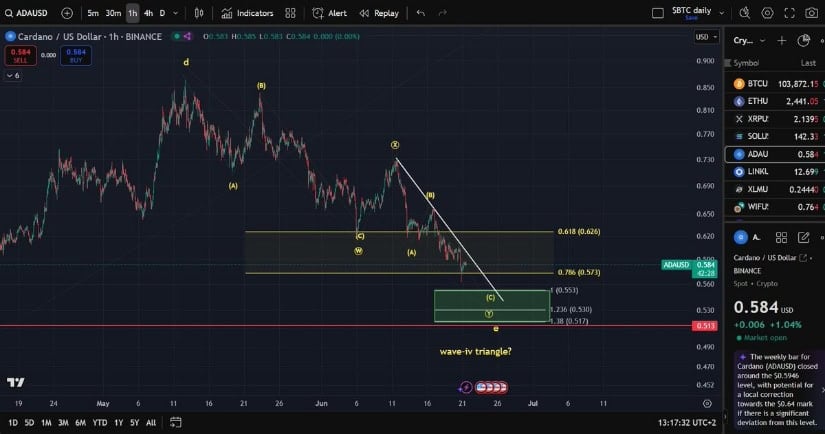
ADA below a descending trendline, with Fibonacci targets hinting at further downside into key demand zones. Source: Man of Bitcoin via X
Technically, the area between the 1.236 and 1.38 Fibonacci levels lines up with the previous breakdown target zones. Now, until a bottom forms, price structure remains tilted toward lower lows unless bulls can reclaim the trendline with momentum.
Cardano has dropped to the 8th position in Grayscale’s latest 1-week returns snapshot, logging a -9.4% decline. While the broader market saw red across the board, ADA stood out on the weaker end of performance. This drop aligns with what’s playing out on the chart: ADA is hovering just below the $0.50 zone.

Cardano’s ADA drops -9.4% and falls to 8th in Grayscale’s weekly returns. Source: Angry Crypto Show via X
Technical signals remain under pressure. Price continues to reject descending trendlines, and bearish wave structures are still active, suggesting momentum is poised towards the downside. Unless buyers step in soon, ADA risks slipping further, not just in price, but also in its place among the majors.
Cardano’s bounce attempt has failed once again. After a brief reaction off support, ADA couldn’t build momentum and is now slipping back into its broader downtrend. According to analyst AlienOvichO, price action remains heavy, and the lack of follow-through leaves ADA vulnerable to a retest of its April lows.
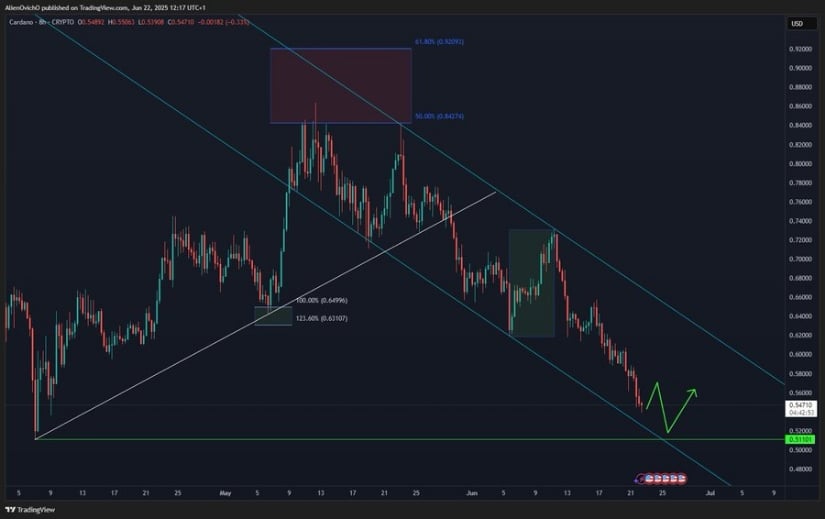
Cardano struggles to hold ground as breakdown risks mount, with eyes now on a potential retest of April’s low. Source: AlienOvichO via X
Right now, there’s no clean reversal setup in play. A confirmed break below April’s low could open the door to deeper downside, potentially targeting the $0.41 area. On the flip side, only a sharp bounce and trendline reclaim would revive any real bullish case for the ADA Cardano price.
Cardano is clearly at a crossroads. The failure to rally from key support has tilted momentum back to the downside, and the lack of any strong reversal signal means traders are now eyeing a retest of the April lows. If $0.45 breaks, $0.41 isn’t far off, and from a structural standpoint, that’s a level that could trigger a sharper drop if confidence fades further.
That said, ADA still has room to defend itself. Bulls need to show up now, or risk losing further support in the process. Until ADA Cardano price sees a decisive reclaim of the descending trendline and some volume behind it, the trend remains under pressure.
Key points:
Bitcoin fell below the $100,000 support on Sunday, but a rebound could depend on how US stock futures open.
Bitcoin’s weakness has pulled ETH, XRP, SOL, and HYPE below their respective support levels.
Bitcoin (BTC) nosedived below the psychological $100,000 support on Sunday as traders digested the US strike on Iran’s nuclear facilities. Popular trader Cas Abbe said in a post on X that Bitcoin could drop toward the $93,000 to $94,000 zone before starting a reversal.
Bitcoin’s weakness has spread to several major altcoins, which have entered a deeper correction by breaking below their respective support levels. This suggests the sentiment has soured, and traders are taking risk off the table.
However, a positive sign is that analysts remain bullish on Bitcoin for the long term. Real Vision CEO Raoul Pal said in a recent video that the current crypto cycle resembles the pattern seen in 2017. He expects the crypto cycle to extend into Q2 2026.
Could Bitcoin bulls push the price back above $100,000, or will bears remain in control? Will select altcoins find buyers at lower levels? Let’s study the charts to find out.
Bitcoin broke below the 50-day simple moving average ($104,788) on Friday and the $100,000 support on Sunday.

The moving averages are on the verge of a bearish crossover, and the relative strength index (RSI) is in the negative territory, indicating that bears are in control. If the price maintains below $100,000, the selling could intensify, pulling the BTC/USDT pair to $93,000.
Buyers will have to push the price above the 20-day exponential moving average ($104,616) to prevent the downside in the near term. The pair could then rise to the downtrend line, which is likely to pose a substantial challenge for the bulls.

The pair completed a bearish descending triangle pattern on a close below the $100,700 level. The pattern target of the negative setup is $89,420, but the bulls are unlikely to give up easily.
Buyers will try to start a relief rally, which could face selling at $100,700 and then at the 20-EMA. If the price turns down from the overhead resistance, the pair may deepen the correction.
The bulls will have to drive and maintain the price above the 50-SMA to start a meaningful recovery.
Ether (ETH) turned down from the 20-day EMA ($2,487) and fell below the 50-day SMA ($2,481) on Friday.

Selling continued on Saturday, and the ETH/USDT pair broke below the $2,323 support. Buyers tried to push the price back above the breakdown level of $2,323, but renewed selling by the bears has pulled the pair near the $2,111 support. The bulls will try to defend the $2,111 level with all their might because a break below it may sink the pair to $1,754.
If the price rebounds off $2,111, the bulls will have to push the pair back above the 20-day EMA to suggest that the near-term correction may have ended.

The pair could find support at the $2,111 level, but the rebound is expected to face strong selling at the breakdown level of $2,323. If the price turns down sharply from $2,323, the bears will again try to sink the pair below $2,111.
Conversely, if the bulls successfully defend the $2,111 level, the pair could form a range in the near term. The pair may swing between $2,111 and $2,323 for some time. The selling pressure could weaken on a close above the 50-SMA.
XRP’s (XRP) range between $2 and $2.65 resolved to the downside on Sunday, indicating increased selling pressure from the bears.

If the price sustains below $2, the XRP/USDT pair could tumble to the $1.61 support. Buyers are expected to vigorously defend the $1.61 level because a break below it may start a collapse to $1.28.
The bulls will have to swiftly push the price back above the breakdown level of $2 to prevent a breakdown. The pair could then rise to the moving averages, where the bears are likely to pose a strong challenge.

The bulls tried to start a bounce off the $2 support, but the bears aggressively sold near the 20-EMA on the 4-hour chart. The price turned down and broke below the $2 support, pulling the RSI into the oversold territory. That suggests a relief rally is possible in the short term.
On the upside, the bears may sell the recovery attempt at $2 and above that at the 20-EMA. If the price turns down sharply from the overhead resistance, the pair risks a further downside. A close above the 50-SMA will be the first sign that the selling pressure is reducing.
Related: Here’s what happened in crypto today
Solana (SOL) completed a bearish H&S pattern when the price closed below the $140 support on Saturday.

The bulls will try to start a recovery but may face selling at the 20-day EMA ($148). If the price turns down from the 20-day EMA, the SOL/USDT pair could plunge to the $110 support and eventually to the pattern target of $93.
Conversely, a break and close above the 20-day EMA suggests solid demand at lower levels. The pair could rise to the 50-day SMA ($160), which is likely to behave as a strong obstacle.

The downsloping moving averages signal that bears are in command, but the oversold level on the RSI points to a possible relief rally in the near term. Recovery attempts could face selling at the breakdown level of $140. If the price turns down from $140, the bears will try to resume the downward move.
Buyers will have to push and maintain the price above the 50-SMA to signal a comeback. That opens the doors for a relief rally to $149 and thereafter to $158.
Repeated failures to maintain the price above $42.50 started a sharp correction in Hyperliquid (HYPE), signaling that the bulls are hurrying to book profits.

The bulls held the 50-day SMA ($32.26) on Saturday, but the bounce has been sold into. That increases the possibility of a break below the 50-day SMA. The HYPE/USDT pair could descend to the breakout level of $28.50.
Buyers are likely to have other plans. They will try to defend the 50-day SMA and push the price back above the 20-day EMA. If they manage to do that, the pair could climb to $40.

Both moving averages are sloping down, and the RSI is in the negative zone on the 4-hour chart. Pullbacks to the 20-EMA are likely to be sold into. There is minor support at $30.50, but it could be broken. The pair may then plummet to the solid support at $28.50.
The first sign of strength will be a break and close above the 20-EMA. That suggests the bears are losing their grip. The pair may ascend to the 50-SMA, which could again attract sellers.
This article does not contain investment advice or recommendations. Every investment and trading move involves risk, and readers should conduct their own research when making a decision.
Solana is under pressure after confirming a head and shoulders breakdown, with key EMAs lost and liquidation risks building around the $131 level.
SOL Solana price is starting to crack under pressure, and the latest price action has caught the attention. After weeks of holding key support, the SOL chart has now confirmed a head and shoulders breakdown. With volume rising and moving averages turning lower, participants are now eyeing deeper downside targets, if bulls don’t step in soon.
Solana has just cracked below a major support level, and the setup looks textbook bearish. The chart from Nebraskangooner highlights a clean head and shoulders formation, now confirmed with the price slipping under the $142 neckline. This structure has been forming since April, and the recent candle close under the neckline confirms the bearish breakdown.
Solana confirms head and shoulders breakdown as price slips below the $142 neckline, signaling a potential move toward $120. Source: Nebraskangooner via X
The measured move from the pattern points to a potential downside target near $120, possibly even lower if market momentum weakens further. Volume has picked up during the breakdown, which adds conviction to the move. Solana’s uptrend from early Q1 now faces its first real structural challenge, and until buyers can reclaim $145–$150 with authority, short-term pressure may remain tilted to the downside.
Solana has now lost its 12/25 weekly EMAs, a critical threshold that has historically defined major market shifts for $SOL. Trader XO’s macro chart shows a clear rejection at these moving averages, with price rolling over into what looks like a renewed bearish phase. With both EMAs curling down and price settling below them, the broader structure leans bearish.

Solana loses key 12/25 weekly EMAs, with Trader XO warning of a possible drop toward $80 amid growing bearish momentum. Source: Trader XO via X
Famous crypto analyst, Trader_XO, believes that the Solana price is likely to drop lower towards the $80 mark. The weekly chart suggests the market remains in a “prove it” mode, and buyers need to show strength to shift the trend back in their favor.
After the head and shoulders confirmation and EMAs tilting lower, Solana’s daily chart now aligns with the other bearish triggers. As highlighted by a famous analyst, Scott Melker, SOL has now broken key support, retested it as resistance, and rolled over, a textbook bearish retest.
Other than weekly 12/25, now daily based EMA’s 50 and 200 are now curling downward, which reinforces the idea that medium-term trend momentum is slipping away from bulls.
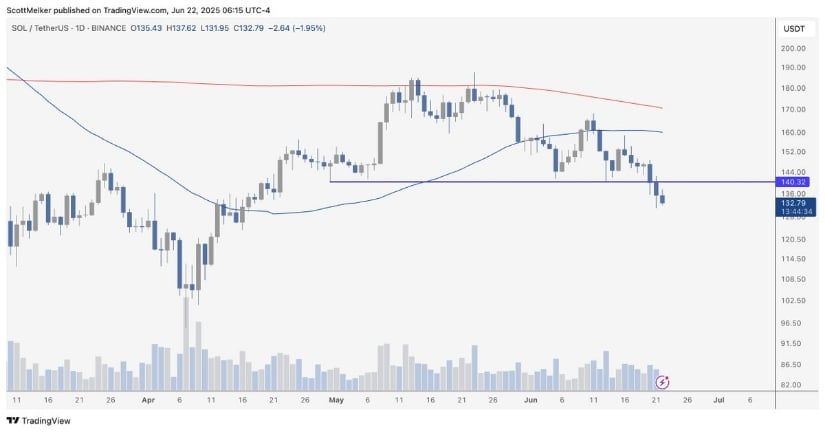
Solana shows a bearish daily retest as Scott Melker highlights key support flip, with EMA 50/200 now tilting downward. Source: Scott Melker via X
Structurally, this adds to the broader weakness already flagged on higher timeframes. Unless buyers can push price back above the $142 to $145 zone and reclaim the moving average stack, the path of least resistance remains to the downside. If that reclaim doesn’t happen soon, eyes could shift toward $120 or even lower.
Solana continues to slide, and now the liquidation heatmap adds another layer to the short-term picture. According to Jesse Peralta, a cluster of leveraged positions is stacked around the $131 level, roughly $124K worth of potential liquidations. That makes it an important mark if selling pressure continues.
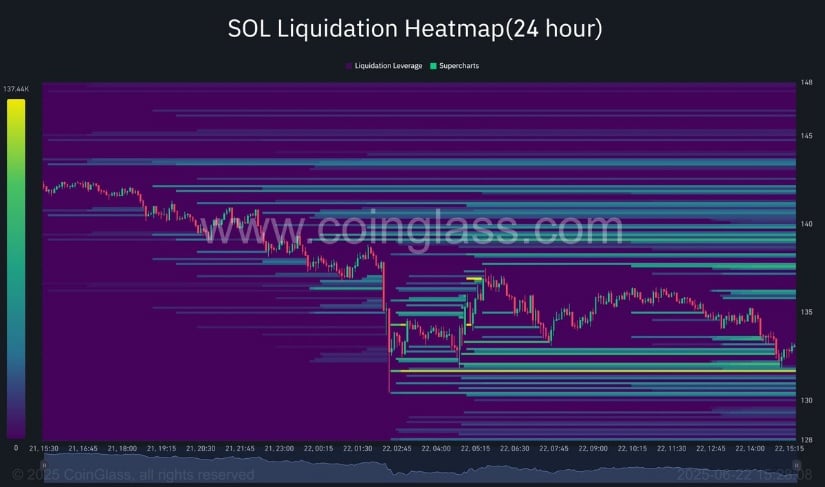
Solana’s liquidation heatmap reveals a $131 cluster, with $124K in potential liquidations that could trigger a sharp drop. Source: Jesse Peralta via X
Looking at the heatmap, there’s an obvious density of liquidation lines just below the current price, indicating late long positions are still hanging on. If those get flushed, it might provide the fuel for a quick wick toward the $128 to $130 range.
Combined with the recent head and shoulders breakdown and Solana trading below key EMAs, this heatmap adds more weight to the short-term bearish bias.
While Solana’s chart has taken a bearish turn recently, there’s a growing narrative that could flip sentiment fast: staking ETF approval. Rumors are emerging, and crypto analyst MartiniGuyYT has hinted that both ETH and SOL staking ETFs might be greenlit as early as June. Cipher X adds fuel to the discussion, suggesting there’s an 80% chance of ETF approval by July. If that materializes, Solana could get a turn in events favoring bulls.
Crypto analyst Cipher X is eyeing the $138 to $140 range as crucial support. The chart shows a potential ABC retracement with a bounce from this level targeting $190 to $200 in the coming weeks. If support fails, price could take a dip near $130.

ABC bounce eyeing $190 to $200 levels, meanwhile, failure may open downside toward $130. Source: Cipher X via X
ETF headlines have the power to override any bearish developments. While Solana’s technical picture has broken down, with head and shoulders patterns, falling EMAs, and liquidation clusters building, there’s still a wildcard for bulls on the table. If the SOL staking ETF rumors turn out to be true, that could improve the deteriorating sentiment for the bulls and lead to a positive price impact.
A crypto analyst has shared a new bullish forecast for the Dogecoin price, predicting that the world’s largest meme coin could soar to a double-digit valuation of $10. Although Dogecoin still trades significantly below $1, the analyst remains confident in this bold target. He points to a unique trend tied to Bitcoin’s market behavior, which he believes could be the key catalyst behind this projected bullish rally.
A widely followed crypto analyst, known as Dima James Potts, has projected a long-term bullish surge for Dogecoin, believing that a price rally to $10 and beyond was inevitable. This prediction is based on a recurring logarithmic arc pattern that has accurately tracked Dogecoin’s multi-year market cycles.
According to Potts’s weekly Dogecoin price chart, the meme coin has repeatedly followed a clear sequence: starting with an extended consolidation along a lower curve support, followed by a sharp breakout toward an upper curved resistance. This unique pattern has held through multiple cycles since 2014, with each new rally beginning just after Dogecoin breaks above a descending trendline, typically marked with a dramatic spike in volume and price.
In this cycle, Potts notes that the recurring historical structure has taken a long time to develop due to an early peak in the 2021 bull market, which has led to Dogecoin’s prolonged accumulation phase. However, the chart shows DOGE still respecting the lower curve, suggesting that the roadmap and build-up for a massive upward move may be underway.

Notably, the critical point of this bullish forecast will arrive when the Bitcoin price secures a weekly close above its previous all-time high above $109,450. Currently, its price is still sitting below past highs around $103,528 after falling below the $100,000 mark due to broader market volatility and political uncertainty.
Based on Potts’ analysis, Dogecoin’s performance and potential to hit $10 are contingent on Bitcoin reaching a new all-time high. Once this occurs, Potts believes that DOGE will begin a parabolic rally, with the potential to form a cycle peak around the final week of October.
Beyond the price targets, Potts’ chart analysis highlights critical structural elements supporting Dogecoin’s optimistic outlook. A series of descending yellow trendlines on Potts’ chart have historically acted as resistance in previous cycles—with each major breakout occurring shortly after the meme coin’s price had closed above these lines.
Also marked are purple vertical lines that show the timeline of Dogecoin’s cycles. Each peak in previous years followed soon after these markers, with the next one set for October 27, 2025. Another notable factor is the accumulation length. Past rallies emerged after more than 1,400 days of sideways price action.
The current cycle has already surpassed that duration, with over 1,600 days of gradual buildup and moderate trading volume. These recurring market behaviours seen in past cycles add weight to the projection that Dogecoin may be preparing for its most significant rally yet.

Featured image from Getty Images, chart from Tradingview.com

Editorial Process for bitcoinist is centered on delivering thoroughly researched, accurate, and unbiased content. We uphold strict sourcing standards, and each page undergoes diligent review by our team of top technology experts and seasoned editors. This process ensures the integrity, relevance, and value of our content for our readers.
Bulls have lost the initiative at the end of the week, according to CoinStats.
The rate of XRP has dropped by 6.77% over the last 24 hours.

On the hourly chart, the price of XRP is falling after a breakout of the local support of $2. If sellers can hold the gained initiative, there is a possibility of a test of the $1.85-$1.90 range soon.

On the bigger time frame, the rate of XRP has broken the support of $2. While the rate is below that mark, traders may witness an ongoing decline to the $1.80 mark.

From the midterm point of view, there are also no reversal signals yet.
You Might Also Like

If the price of XRP keeps going down, there is a high chance of a test of the support of $1.77 next week.
XRP is trading at $1.9414 at press time.
Bears are dominating on the last day of the week, according to CoinMarketCap.
The rate of Bitcoin (BTC) has dropped by 1.67% since yesterday. Over the last week, the price has fallen by 3.17%.

On the hourly chart, the price of BTC keeps looking bearish. The rate is on the way to the support of $101,894. If a breakout happens, the accumulated energy might be enough for a move to the $101,000 zone.

On the bigger time frame, the picture is also bearish. If the daily bar closes around the current prices or below, one can expect a test of the vital $100,000 area by the end of the month.

From the midterm point of view, traders should focus on the candle closure in terms of the $100,764 level.
You Might Also Like

If a breakout happens and the bar closes below it with no long wick, there is a chance to witness an ongoing decline to the $99,000 range.
Bitcoin is trading at $101,000 at press time.
XRP is heading into the last week of June with losses mounting up, and unless something changes dramatically, the token is set to end Q2, 2025, with disappointing performance.
After dropping 0.80% in May and then falling even more, at -5.64% this month, it looks like the quarter will probably end up being negative, even though April’s earlier 4.98% rise was encouraging. Momentum has gone, and the price is just drifting around — but if you look at the bigger picture, it’s not as random as it seems.
Actually, XRP’s long-term seasonality points to July as the star month in its whole trading history. Besides April, It’s the only one where both the average and median monthly returns are clearly positive, with average gains of 7.90% and a median return of 6.91%. You can’t achieve that kind of consistency over more than 10 years by accident. It suggests a kind of pattern that’s built into how the market works, especially after some weaker spring performances.

Looking back, this setup isn’t new. In 2024, XRP dropped about 25% in Q2, but then rallied almost 29% in Q3. In 2022, the drawdown was steeper — a brutal 59.4% crash in Q2 — but was followed by a sharp 44.5% recovery in Q3.
We also saw similar rebound patterns in 2020 and 2021. These aren’t just one-off flips — they are part of a bigger trend that’s pointing to a summer surge after a bit of a slow Q2.
You Might Also Like

Right now, XRP price is trading at around $2.03, which is good news as it’s holding above the key long-term support levels and drifting inside a narrow volatility band. There’s no major breakdown underway, but there’s also no immediate catalyst pushing things forward. That said, the current calm might not last much longer.
If history is anything to go by, XRP’s July is going to completely reverse the tone. And that window is just around the corner.
