The main category of Crypto News.
You can use the search box below to find what you need.
[wd_asp id=1]
The main category of Crypto News.
You can use the search box below to find what you need.
[wd_asp id=1]
Cardano faces a crucial crossroads as ETF optimism clashes with bearish technicals and rising whale sell pressure near key support levels.
With ETF optimism heating up and institutional eyes turning back toward altcoins, Cardano may be gearing up for a major comeback. A new Bloomberg report puts the odds of a Grayscale-backed ADA ETF approval at 75%.
Cardano just received major positive news from a new Bloomberg report suggesting there’s a 75% chance its ETF, backed by Grayscale, will be approved in 2025. Even more significantly, Bloomberg analysts point out that the SEC likely views ADA as a commodity, not a security, a distinction that could help fast-track approval and avoid the regulatory entanglements.
Cardano’s ETF approval odds jump to 75%, signaling potential institutional inflows and a shift in SEC perception. Source: Cardanians via X
It brings in new investor classes, particularly institutions that require regulatory compliance before allocating capital. If Cardano’s ETF moves forward, it could enhance liquidity, stabilize volatility, and give the project more room to grow.
In a staggering data revealed by CryptoDep, Cardano has secured a spot among the top five crypto projects based on social activity. With over 18.4K posts and 2.34M interactions, ADA is clearly not flying under the radar.

Cardano ranks in the top 5 for crypto social activity with 18.4K posts and 2.34M interactions. Source: CryptoDep via X
These social activity number shows a strong Cardano community. As ETFs gain momentum and regulatory outlooks begin to clear, Cardano’s strong community could act as a leading indicator.
Following a wave of institutional optimism and strong community engagement, Cardano’s chart is not reflecting the same bullish tone. Although the price remains within a falling wedge, a pattern often associated with bullish reversals, analyst MasterAnanda cautions that ADA may still dip into the $0.57 to $0.52 range before any major recovery takes shape. This zone aligns with a key support cluster that has held multiple times over the past months. If this holds, once again, a macro bullish move towards $1.00 and $1.50 is on cards.
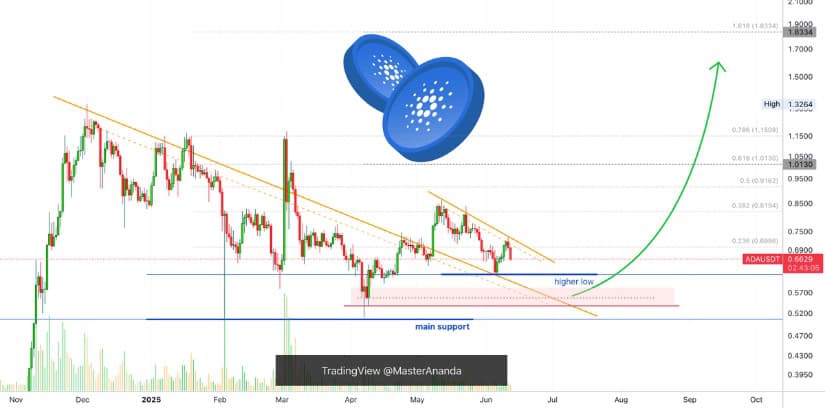
Cardano trades within a falling wedge as analysts eye a potential dip to $0.52 to $0.57 before any bullish breakout. Source: MasterAnanda via X
The structure remains technically valid for a bullish breakout, but only if these lower levels are defended with conviction. Until then, ADA Cardano price seems to be in a phase of consolidation, where short-term bearish pressure and long-term optimism are head-to-head.
As the ETF narrative builds and community momentum stays strong, Cardano’s price chart is telling a more cautious story. Analyst Nebraskangooner points out a possible head and shoulders breakdown on the daily chart. With ADA hovering just below its neckline, this structure suggests a potential continuation to the downside if follow-through selling kicks in.
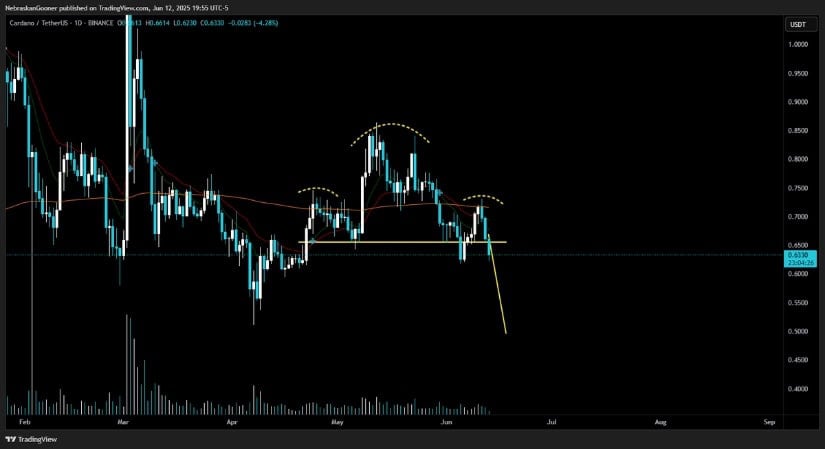
Cardano hovers below key neckline support as a head and shoulders pattern signals possible downside toward $0.50. Source: Nebraskangooner via X
From a technical standpoint, the neckline support near $0.60 has been tested multiple times and is now looking vulnerable. If this level breaks convincingly, downside targets could open up toward $0.52 to $0.50, aligning with prior demand zones and volume support.
As Cardano battles with a weakening technical structure, fresh on-chain data adds another concern to the mix. According to Ali Martinez, whales have offloaded over 270 million ADA in just the past week. That kind of sell-side volume, especially from large holders, is rarely a good sign when paired with an already fragile chart setup.
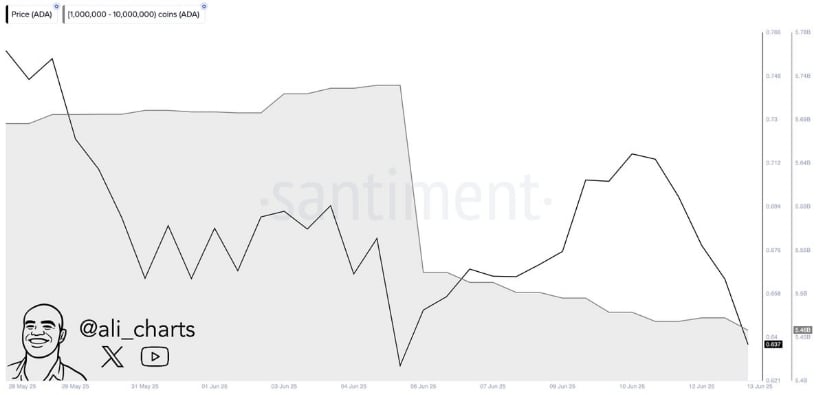
Whales offload over 270 million ADA in a week, adding sell pressure to Cardano’s already fragile technical setup. Source: Ali Martinez via X
This sudden shift in whale behavior aligns with the broader caution ADA Cardano price is seen building. From the head and shoulders breakdown flagged by Nebraskangooner to the potential dip toward $0.52–$0.50 mentioned by MasterAnanda, the pressure is stacking.
Cardano finds itself at a pivotal point. On one hand, the ETF news is a game-changer, not only because of the 75% approval odds but also due to the SEC possibly viewing ADA as a commodity.
But on the other hand, the technicals and on-chain signals demand caution. Whale selling, possible breakdown patterns, and a fragile support zone paint a short-term bearish picture. If Cardano price can hold the $0.52 to $0.57 range and shake off the head and shoulders risk, the path toward $1.00 is very much alive.
In a volatile crypto market, Solana (SOL) price regained momentum lately. After surging 17% over the past six days through Friday, it rose from a low of $142 to $166 as of June 11.
Such a rebound places SOL in an important resistance area. The technical indicator, DeFi usage, and ETF-related developments were all favoring additional gains.
As investor engagement increases and fundamentals improve, Solana price seems ready to challenge critical levels in the coming days.
The latest upward trend in Solana price is the result of a successful bounce off the $142 support zone. This recovery has restored the confidence among traders. The volumes have gone up by over 40% in a day, as indicated by CoinMarketCap.
At press time, SOL price was approximately $158 and tested a crucial horizontal resistance area between $165 and $170.
Technical analyst Posty highlighted a breakout setup showing Solana price reclaiming previous demand zones and forming higher lows. The structure favored a short-term rally up to the level of $180.
SOL Price has overcome the first resistance and now approaches mid-term consolidation zones. A bullish close above $170 would be a good indication that momentum is continuing, and the next technical target would be $180.
This follows the bullish structures on the 4-hour chart, and a clean break and retest sequence is developing.
As long as the altcoin maintains this bullish market structure, Solana price is expected to hold its upward trajectory.
Furthermore, analyst Immortal strengthened the bullish thesis. In his analysis, he showed a classic inverse head-and-shoulders pattern developing around the $155-$160 area. This reversal formation indicates that the bottom of a new uptrend is being formed.
The chart also included a projected move showing Solana price rising to $220.62, representing a potential 39% upside from the current price.
Meanwhile, the immediate support of $153 -159 has been tested several times, which speaks of accumulation. The pattern’s neckline aligns closely with the $166 level currently being contested.

The chart risk-reward box highlighted an 8.1 to 1 reward ratio, which is a good example of asymmetric reward potential in favor of buyers.
This structure, combined with increasing trading volumes, supports a breakout continuation scenario. That is if SOL price stays above $159 and clears $170 on higher timeframes.
In addition, Solana’s fundamentals support the ongoing rally. According to DeFiLlama data, Solana’s DeFi Total Value Locked has increased by $860 million over the past five days to $8.81 billion.
Interestingly, such a rise underscored a previously unseen level of on-chain activity, users interacting with decentralized exchanges and liquidity protocols.
Adding weight to this, DEX volumes on the Solana network almost doubled, with an increase of $1.53 billion on June 8 to $2.95 billion on June 11.
The price action has more supporting volume and liquidity surge, and bullish breakouts are more sustainable.
Increased activity is not limited to traditional DeFi. Trading meme coins on Solana blockchain also saw an increase, with the SOL-based meme coin market cap increasing by 6.7% over the last 24 hours. This speculative activity has historically preceded larger moves in Solana price.
On the regulatory front, spot Solana ETF approval odds have climbed to 61%, the highest since January, according to Polymarket.
This increase follows the U.S. Securities and Exchange Commission’s demand for updated S-1 registration statements of ETF issuers, as the regulator takes a step forward in the examination procedure.
Should regulatory developments proceed, a spot ETF launch can result in additional capital flows into SOL. In the meantime, the new development provides a solid macro story to the already positive technical and network indicators.
A top market analyst has suggested that Dogecoin will rally to a four-year high when the current downside ends, highlighting a major support level to watch.
Master Ananda shared this view in a TradingView analysis today amid a broader market recession. Bitcoin dropped to an intraday low of $102,758, sparking a broader market downtrend that did not spare Dogecoin.
DOGE, the largest meme coin by market cap, joined the wave and is already down 4.8% today. Unless the current momentum reverses, the token is on the cusp of its third consecutive losing day, having retraced 13.6% during this period.
For context, Master Ananda noted that he expected Dogecoin’s current price crash as its chart structure formed a lower high on June 5, a sign of a bearish reversal. While Dogecoin rebounded from the lows of the earlier-mentioned date, it has given back its gains, aligning with the bearish indicator.
Meanwhile, the analyst identified macro support levels at the 0.618 and 0.786 Fibonacci retracement levels, at $0.178 and $0.158, respectively, that could serve as a short-term hedge against escalating price weakness. However, he noted that they are weak supports and may not suffice for the bearish momentum.

Notably, DOGE has broken down from the 0.618 Fib. Support level at its current price but remains 8.6% away from the 0.786 Fibonacci level. Master Ananda noted that if the levels fail to hold, Dogecoin seems poised to retest the lows last seen in April.
Specifically, Dogecoin bounced from a major support level around $0.13 in April, a level that served as support in July 2024 and as resistance in September 2024. Notably, the meme coin retested the support in October and November of the same year but bounced extensively at each retest.
The analyst expects the $0.13 support to tame Dogecoin’s bearish momentum again if prices dump to the level. He noted that the RSI would have to go into extreme weakness for prices to fall below, which is very unlikely.
Interestingly, Master Ananda advised going all in at the April 7 lows if prices ever retraced to that point, insisting it would be a great buy. As Dogecoin bounced from the support in October before rallying over 200%, he predicted a similar outcome.
Per the accompanying chart, the analyst expects Dogecoin to rebound from the lows and target a four-year price high. He predicted an over 250% upsurge in support to levels above December’s high of $0.484.
Dogecoin trades at $0.173 at the time of writing, 20% away from this support and 180% from the projected high. It bears mentioning that other analysts see DOGE surpassing the $0.484 mark this cycle, with targets like $1 and $2.9 in the books.
DisClamier: This content is informational and should not be considered financial advice. The views expressed in this article may include the author’s personal opinions and do not reflect The Crypto Basic opinion. Readers are encouraged to do thorough research before making any investment decisions. The Crypto Basic is not responsible for any financial losses.
Key points:
Bitcoin searches for support near $103,000, but rising uncertainty in global markets could cap future rallies.
Select altcoins are finding buyers at lower levels, indicating traders’ desire to buy the dip.
Bitcoin (BTC) corrected below $103,000 on news of Israel’s airstrikes on Iran, but a positive sign is that lower levels witnessed buying, pushing the price near $106,000.
Trading resource Material Indicators said in a post on X that Bitcoin’s bottom is unlikely to drop out, but sustainable upside price discovery may not happen before the next Fed meeting.
Another positive view came from a study by ETC Group head of research Andre Dragosch. It showed that Bitcoin recovers and often surpasses the pre-event price levels within 50 days.
However, Bollinger Bands creator John Bollinger has a different view. In a post on X, Bollinger said that Bitcoin has completed three pushes to a high after forming the “W-shaped” double bottom near $75,000. During a discussion on the post, Bollinger added that three pushes to a high “means the end of the prior trend,” which could be followed by a “reversal or a consolidation.”
Could Bitcoin and select altcoins resume their uptrends? Let’s analyze the charts of the top 10 cryptocurrencies to find out.
Bitcoin fell to the 50-day simple moving average ($103,159) on Friday where the bulls are trying to arrest the decline.

The 20-day exponential moving average ($106,097) is flattening out, and the relative strength index (RSI) is near the midpoint, signaling a possible consolidation in the near term. The crucial levels to watch out for are $100,000 on the downside and the all-time high of $111,980 on the upside.
If the $100,000 level gives way, the BTC/USDT pair could tumble to $92,000. Conversely, a break and close above $111,980 signals the resumption of the uptrend. The pair could then soar to $130,000.
Ether (ETH) turned down from $2,879 on Wednesday and nosedived below the 20-day EMA ($2,580) on Friday, suggesting the markets rejected the breakout above $2,738.

The 20-day EMA is flattening out, and the RSI has dropped to the midpoint, indicating a balance between supply and demand. If the price turns up from the current level or $2,323, the bears will attempt to halt the relief rally in the $2,738 to $2,879 zone. If the price turns down from the overhead zone, the ETH/USDT pair may consolidate for some more time.
Buyers will have to catapult the price above $2,879 to start the next leg of the up move toward $3,153. On the downside, a break below $2,323 could sink the pair to $2,111.
XRP (XRP) broke above the moving averages on Monday, but the bulls could not build upon the momentum.

The price turned down on Wednesday and has reached near the solid support at $2. Buyers are expected to vigorously defend the $2 level as a break and close below it could signal the start of a new downtrend. The XRP/USDT pair could descend to $1.61 and, after that, to $1.28.
Contrary to this assumption, if the price turns up sharply from $2 and breaks above the moving averages, it suggests the range-bound action may continue for a while longer.
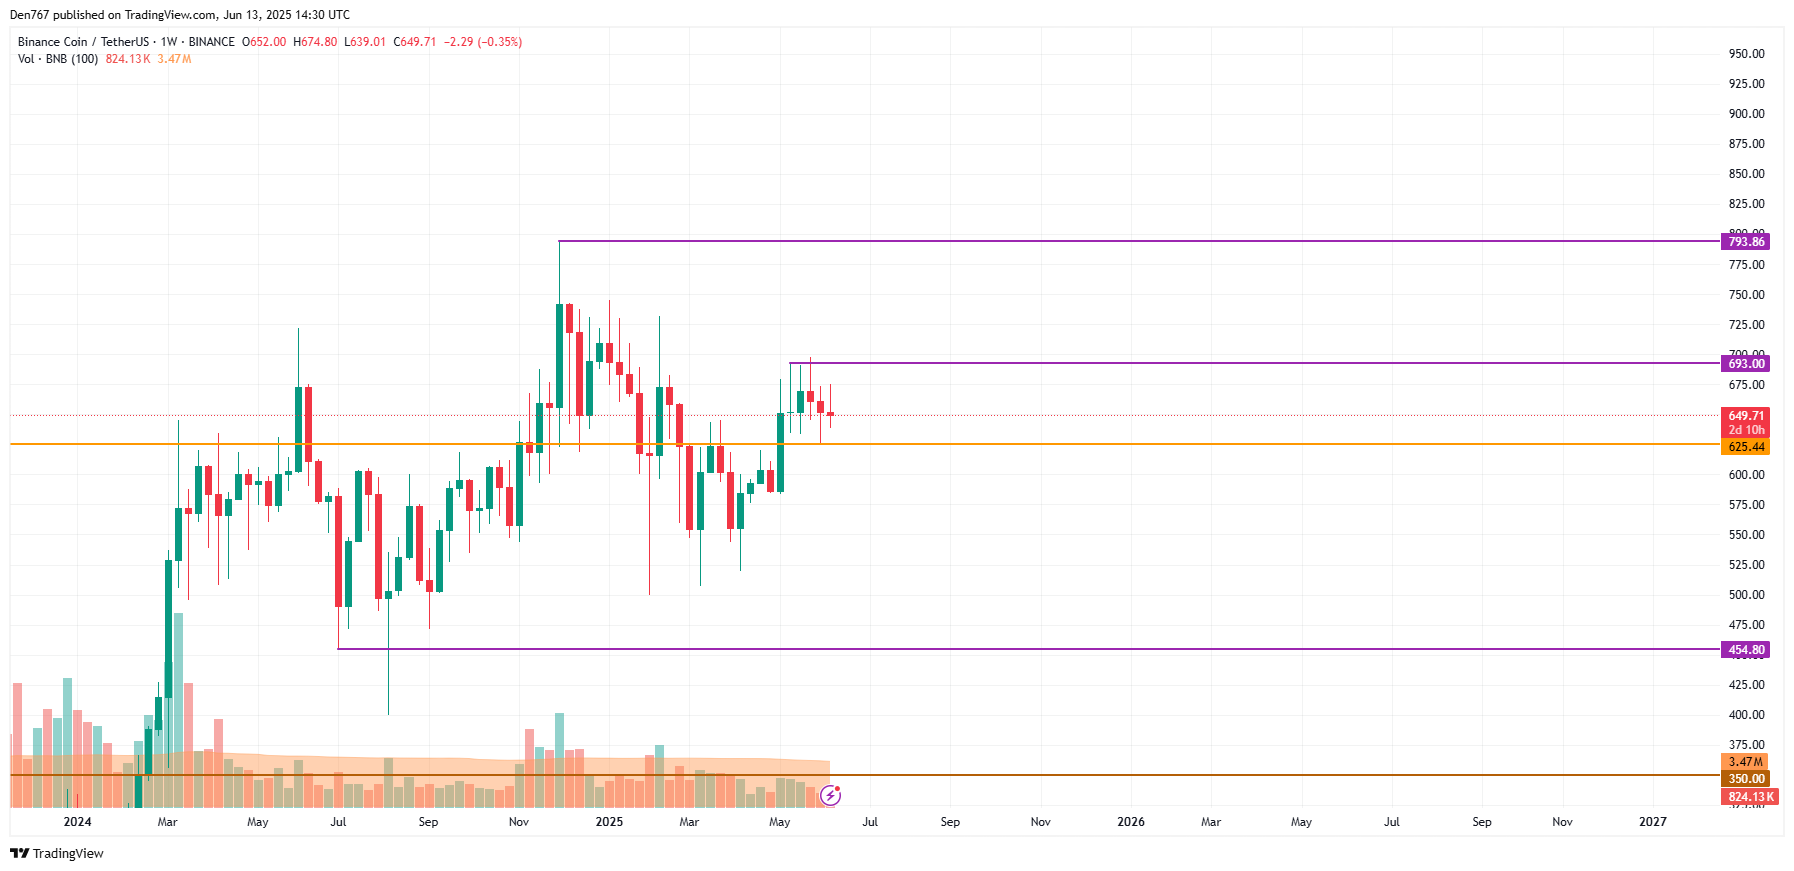
BNB (BNB) has been consolidating between $693 and $634 for several days, indicating a balance between supply and demand.

The flattish 20-day EMA ($658) and the RSI near the midpoint do not give a clear advantage either to the bulls or the bears. If the price turns up from $634 and rises above the 20-day EMA, the BNB/USDT pair could remain inside the range for some more time.
Contrarily, a break and close below $634 suggests that the bears have overpowered the bulls. That could intensify selling, pulling the pair to $600. Buyers are expected to aggressively defend the $580 to $600 support zone.
Solana (SOL) rose above the moving averages on Monday, but the bulls could not sustain the higher levels.

The price turned down from $168 on Wednesday and broke below the moving averages on June 12. The SOL/USDT pair has reached the $140 support, which is a critical level for the bulls to defend.
If the price rebounds off the $140 support, the bulls will again try to shove the price above the moving averages. On the contrary, a break and close below $140 could sink the pair to $123 and eventually to $110.
Dogecoin (DOGE) turned down from the $0.21 level on Wednesday, indicating that the price remains stuck inside the lower half of the $0.26 to $0.14 range.

There is support at $0.16, but it is likely to be broken. The DOGE/USDT pair could then plummet to the $0.14 support, where the buyers are expected to step in. A solid bounce off the $0.14 level could extend the range-bound action for a while longer.
The next trending move is likely to begin on a break above $0.26 or below $0.14. If the $0.14 level cracks, the pair could collapse to $0.10. On the other hand, a break above $0.26 could drive the pair to $0.38.
Cardano (ADA) turned down from the 50-day SMA ($0.72) on Wednesday, indicating that the bears continue to sell on rallies.

The down-sloping 20-day EMA ($0.69) and the RSI in the negative territory signal the bears have an edge. If the $0.60 level is taken out, the ADA/USDT pair could plummet to the solid support at $0.50. Buyers are expected to defend the $0.50 level with all their might.
The first sign of strength will be a break and close above the 50-day SMA. That opens the doors for a rise to the downtrend line, which is a significant level to watch out for. A break and close above the downtrend line suggests a potential trend change.
Related: Here’s what happened in crypto today
Buyers pushed Hyperliquid (HYPE) above the $42.25 resistance on Wednesday and again on Thursday, but could not sustain the higher levels.

That may have tempted short-term buyers to book profits, pulling the price toward the breakout level from the symmetrical triangle pattern. The upsloping 20-day EMA ($35.93) signals an advantage to buyers, but the developing negative divergence on the RSI suggests the bullish momentum is weakening. Buyers will have to propel the price above $44 to resume the uptrend toward $50.
On the downside, a break and close below the 20-day EMA could accelerate selling, pulling the pair to $30.50.
Sui (SUI) turned down from the 50-day SMA ($3.55) on Wednesday, indicating that bears are fiercely defending the level.

The SUI/USDT pair has reached solid support at $2.86, which is a crucial level to watch out for. Sellers will try to seize control by pulling the price below the $2.86 level. If they can pull it off, the pair could tumble to $2.50.
Buyers are likely to have other plans. They will try to defend the $2.86 level. If the price bounces off the $2.86 support, the pair could reach the moving averages. If the price turns down sharply from the moving averages, it increases the risk of a break below $2.86. Buyers will have to drive the pair above the moving averages to clear the path for a rally toward the $4.25 resistance.
Chainlink (LINK) turned down and re-entered the descending channel pattern on Thursday, indicating that sellers are active at higher levels.

The bears are trying to pull the price below the $12.64 support. If they manage to do that, the LINK/USDT pair risks a fall to $10. Such a move extends the pair’s stay inside the channel for a few more days.
Buyers will have to swiftly push the price above the $16 level to prevent the downside move. That indicates aggressive buying at lower levels. The pair could rise to $18 and then to $20, signaling a potential trend change.
This article does not contain investment advice or recommendations. Every investment and trading move involves risk, and readers should conduct their own research when making a decision.
Bulls are not ready yet to get back in the game, according to CoinStats.
The price of Binance Coin (BNB) has declined by 1.86% over the last 24 hours.

On the hourly chart, the rate of BNB is falling after setting a local resistance of $659.42. If bulls cannot seize the initiative, traders may witness a test of the $640 range.

On the longer time frame, the situation remains neutral.
You Might Also Like
The native exchange coin keeps accumulating energy for a futher move. In this case, there are low chances of seeing sharp ups or downs.
From the midterm point of view, ongoing sideways trading remains the most likely scenario. The volume keeps falling, which means traders might witness consolidation in the area of $640-$680 over the next few weeks.
BNB is trading at $650.29 at press time.
Jakarta, Pintu News – As reported by Coingape, Dogecoin has formed a rounding bottom chart pattern, which is usually a strong signal of a bullish trend reversal.
At the time of writing, the Dogecoin price stands at $0.1728, having fallen by 8% in the last 24 hours in line with the general market weakness on June 13.
On June 13, 2025, the price of Dogecoin recorded a decline of 8.65% within 24 hours, trading at $0.1728 or the equivalent of Rp2,831. DOGE had its highest level at Rp3,111 and its lowest level at Rp2,777.
At the time of writing, Dogecoin’s market cap stands at around $26 billion, with trading volume rising 12% to $1.8 billion within 24 hours.
Dogecoin price has formed a rounding bottom pattern on the weekly chart. This pattern is a trend reversal signal indicating that the price movement is likely to switch to an uptrend(bullish).
Based on the chart, this pattern has been forming since December 2024. If this pattern is successfully confirmed and the price of DOGE is able to break theneckline resistance level, then the next increase has the potential to push the price beyond $0.23, and could even jump to $0.44 – equivalent to an increase of about 84%.

The chances of a Dogecoin price rally also increased after the Money Flow Index (MFI) crossed the 50 level. This crossover indicates a positive change in capital flow into the asset, as the volume of purchases increases.
If the MFI continues to hold above 50 and Dogecoin starts printing higher highs, then this would be an accumulation signal in favor of a potential bullish breakout.
The MFI crossover above the 50 level occurred before the price of DOGE actually broke the neckline resistance of the rounding bottom pattern, which reinforced the potential for a breakout towards higher price levels.
Read also: Ethereum Price Crashes 9% Today (June 13): Is a Major Bear Market Move Coming?
However, the ADX (Average Directional Index) line is starting to point downwards, indicating a weakening of the uptrend strength towards resistance. This could cause Dogecoin’s price movement to go flat or sideways, especially if the MFI is again rejected at the 50 level – as it did on May 12.
The most crucial resistance level to watch as the Dogecoin price targets a potential 84% rally is the neckline level at $0.23. This level will be a key determinant of whether the price is able to continue its rise to 84%.
In addition, the area between $0.31 to $0.35 is also an important zone. Based on historical data, traders tend to take profits in this zone in early January, so this area forms significant resistance.
As such, even though Dogecoin managed to break the neckline hurdle, the price still needs to break out of this zone before continuing the rally towards $0.44.
Meanwhile, a price drop below the support level of the rounding bottom pattern at $0.14 will invalidate the bullish outlook. If this support is broken, the downtrend could potentially continue all the way to the zone around $0.11.
The whales seem to have started preparing themselves for a potential significant Dogecoin price increase, ahead of the filing deadline for a spot-based DOGE ETF.
Read also: Crypto Expert Drops Bombshell: Shiba Inu Is Set to Shatter All-Time Highs!
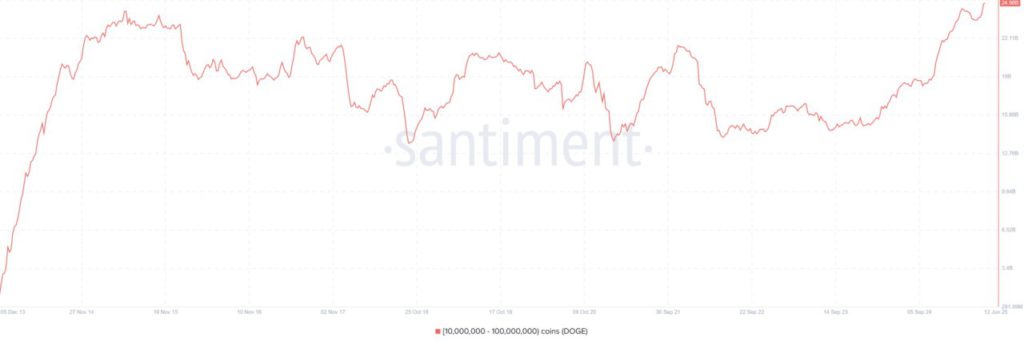
In the past seven days, addresses holding between 10 million and 100 million DOGE tokens have purchased an additional 320 million tokens. As a result, the group’s total holdings now stand at 24.98 billion DOGE – anall-time high.
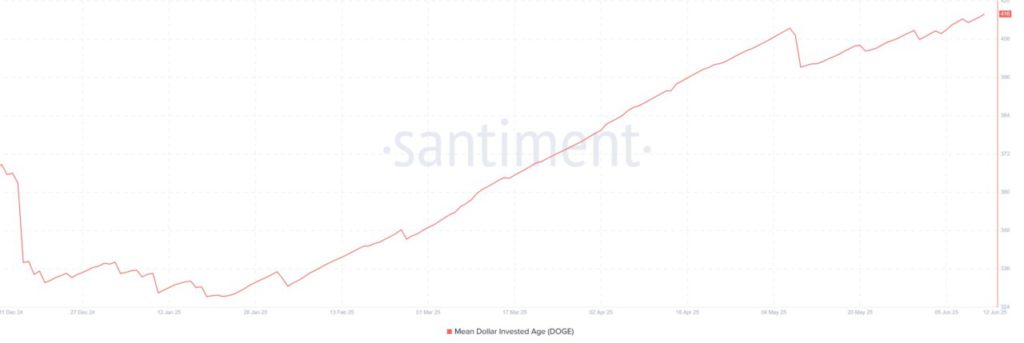
This consistent accumulation also coincides with the increase in Mean Dollar Invested Age (MDIA) over the past six months.
The rise in this metric indicates that investors feel confident in Dogecoin’s short- and long-term prospects, and are not planning to sell anytime soon.
According to on-chain data from Santiment, this trend is a positive (bullish) signal for Dogecoin as it shows that the asset is in an accumulation phase. This opens up the opportunity for a price rally despite the general crypto market being under pressure.
Overall, the Dogecoin price has formed a rounding bottom pattern which suggests abullish trend reversal. If DOGE manages to break the $0.23 resistance level, the price has the potential to increase by 84% to $0.44.
Meanwhile, massive accumulation by whales-with total holdings reaching a record 24.98 billion tokens-strengthened the prospects of such a price surge.
That’s the latest information about crypto. Follow us on Google News to stay up-to-date on the world of crypto and blockchain technology.
Enjoy an easy and secure crypto trading experience by downloading Pintu crypto app via Google Play Store or App Store now. Also, experience web trading with advanced trading tools such as pro charting, various types of order types, and portfolio tracker only at Pintu Pro. Pintu Pro Futures is also available, where you can buy bitcoin leverage, trade btc futures, eth futures and sol futures easily from your desktop!
*Disclaimer
This content aims to enrich readers’ information. Pintu collects this information from various relevant sources and is not influenced by outside parties. Note that an asset’s past performance does not determine its projected future performance. Trading crypto carries high risk and volatility, always do your own research and use cold hard cash before investing. All activities of buying and selling bitcoin and other crypto asset investments are the responsibility of the reader.
Reference:
Bitcoin (BTC), Ethereum (ETH), and Ripple (XRP) prices have dipped as escalating geopolitical tension between Israel and Iran has triggered a risk-off sentiment in the cryptocurrency markets. The top three cryptocurrencies by market capitalization are extending their losses heading into the weekend, with the price action suggesting further correction in BTC, ETH, and XRP.
Bitcoin price failed to retest its all-time high of $111,980 following a sharp rally on Monday and declined slightly until Wednesday. It continued its correction on Thursday, closing below the daily support at $106,406. At the time of writing on Friday, it extended its losses and hovers around its 50-day Exponential Moving Average at $102,447.
If BTC closes below its 50-day EMA at $102,447, it could extend the decline to retest its psychological important level of $100,000.
The Relative Strength Index (RSI) slips below its neutral level of 50, reading 45, indicating bearish momentum. The Moving Average Convergence Divergence (MACD) indicator also displayed a bearish crossover on Thursday, issuing sell signals and indicating a downward trend.
BTC/USDT daily chart
However, if BTC recovers, it could extend the recovery to retest its daily level of $106,406.
Ethereum price failed to find support around the upper consolidation level of $2,724 on Thursday and declined by 4.65%. At the time of writing on Friday, it trades down 6%, resting at its lower consolidation boundary of $2,461.
If ETH continues its correction and closes below its 50-day EMA at $2,410, it could extend the decline to retest its next support level at $2,000.
The RSI on the daily chart reads 47, below its neutral level of 50, indicating bearish momentum. Additionally, the MACD indicator also displayed a bearish crossover on Thursday, issuing sell signals and indicating a downward trend.
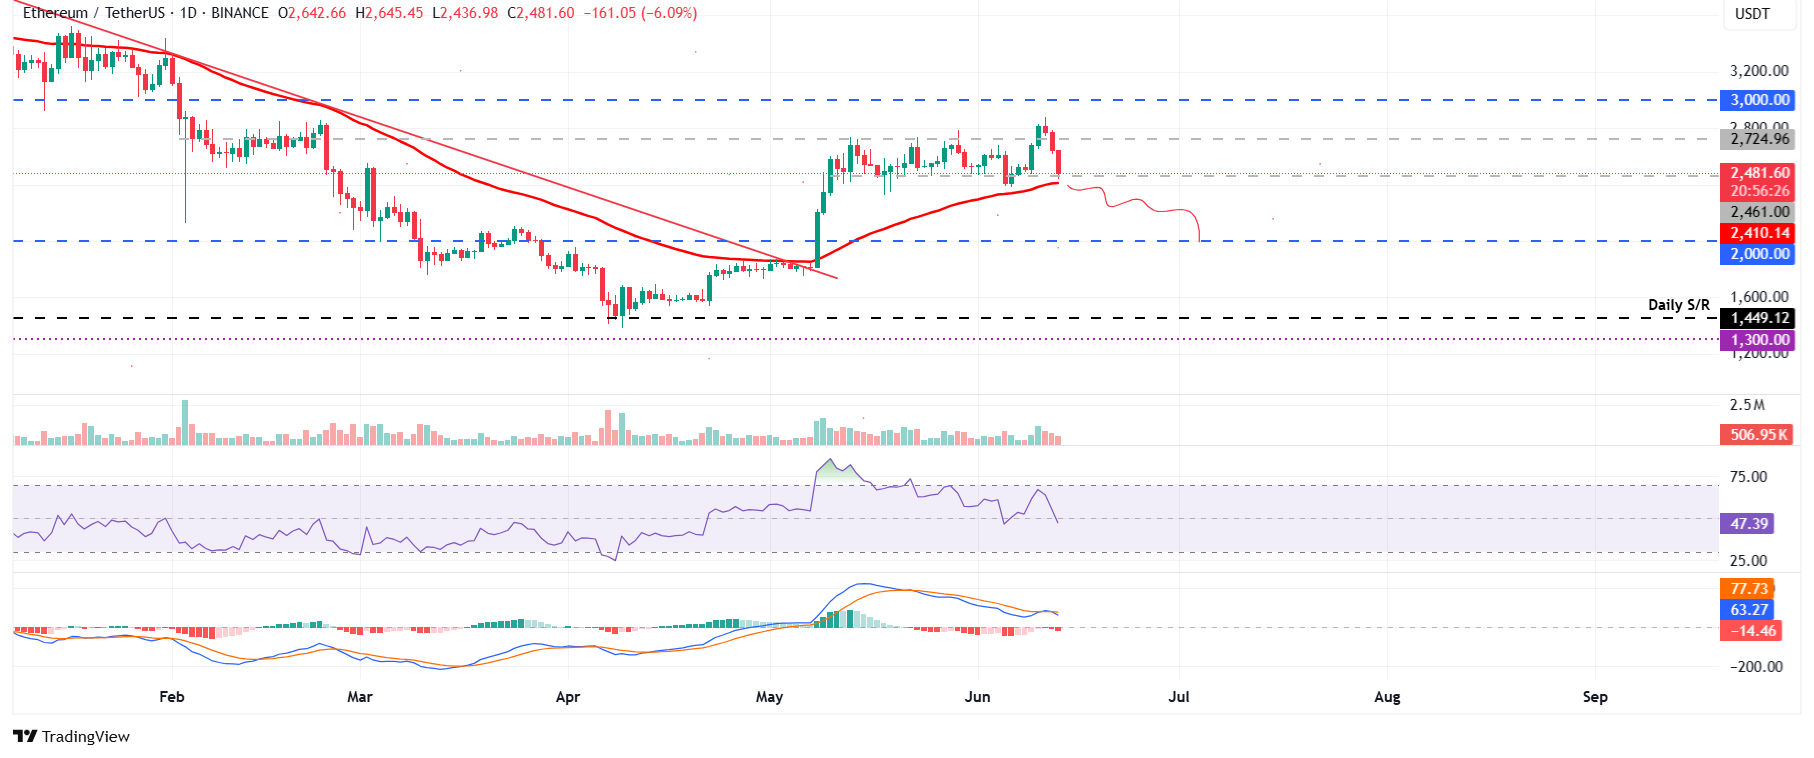
ETH/USDT daily chart
On the other hand, if ETH finds support around its lower consolidation boundary at $2,461, it could extend the recovery to retest its upper consolidation boundary at $2,724.
XRP price closed below its 50-day EMA level at $2.25 on Thursday and declined 3.55% that day. At the time of writing on Friday, it continues to trade down by 3.5% at around $2.11.
If XRP continues its correction, it could extend the decline to retest its next daily support level at $1.96.
The RSI on the daily chart reads 40, below its neutral level and points downward, indicating strong bearish momentum. Moreover, the two lines of the Moving Average Convergence Divergence (MACD) indicator on the daily chart coil around each other, indicating indecisiveness among traders. If the MACD flips a bearish crossover, it will give a sell signal and further support the bearish thesis.
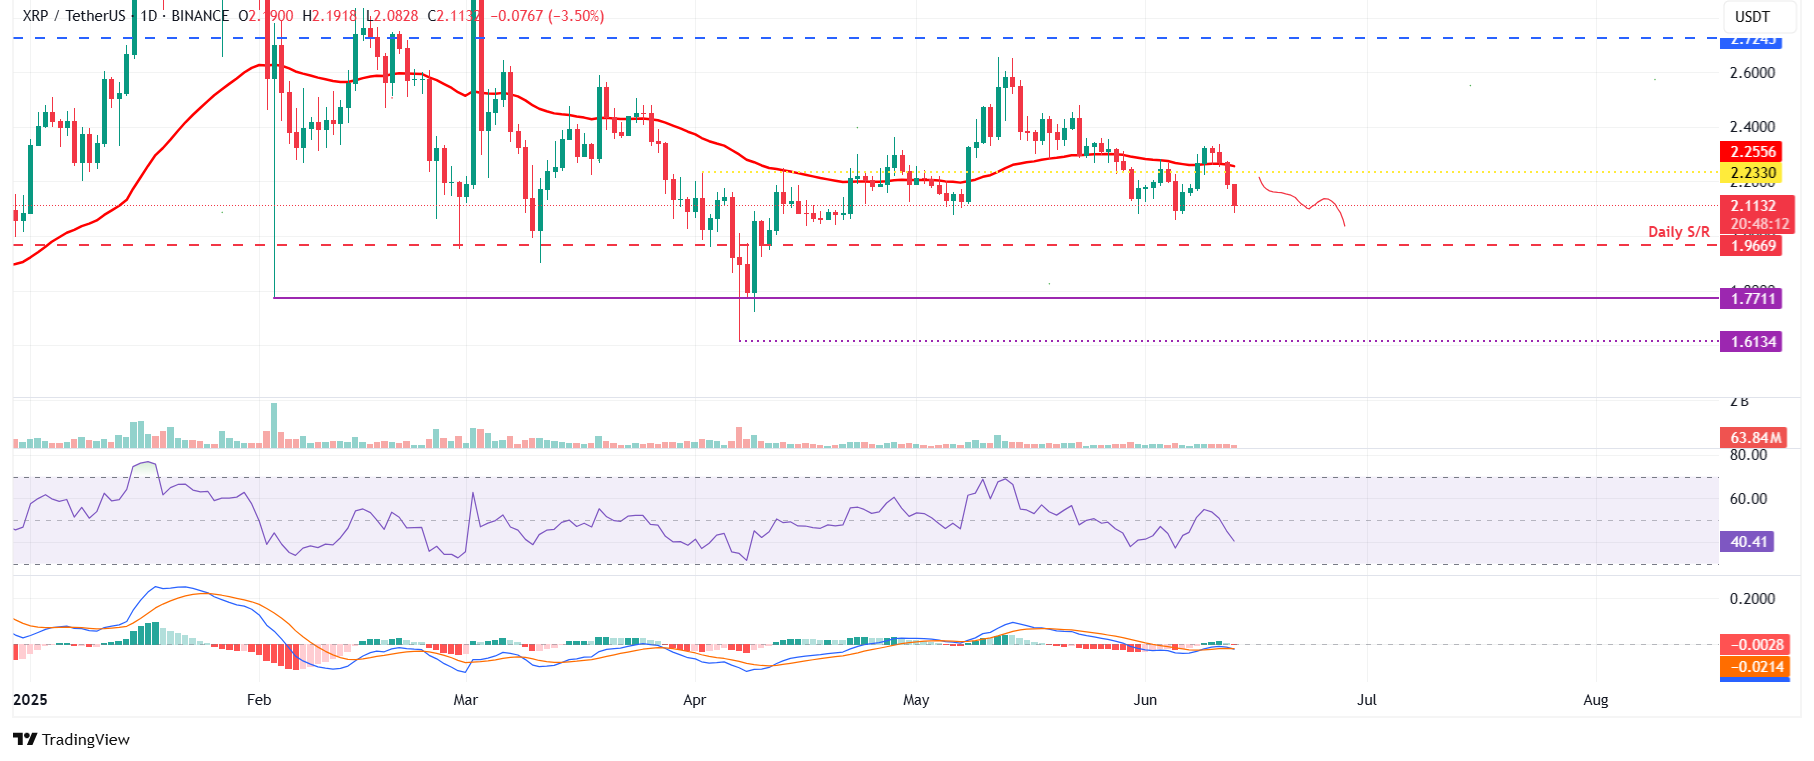
XRP/USDT daily chart
Conversely, if XRP recovers, it could extend to retest its 50-day EMA at $2.25.
Bitcoin is the largest cryptocurrency by market capitalization, a virtual currency designed to serve as money. This form of payment cannot be controlled by any one person, group, or entity, which eliminates the need for third-party participation during financial transactions.
Altcoins are any cryptocurrency apart from Bitcoin, but some also regard Ethereum as a non-altcoin because it is from these two cryptocurrencies that forking happens. If this is true, then Litecoin is the first altcoin, forked from the Bitcoin protocol and, therefore, an “improved” version of it.
Stablecoins are cryptocurrencies designed to have a stable price, with their value backed by a reserve of the asset it represents. To achieve this, the value of any one stablecoin is pegged to a commodity or financial instrument, such as the US Dollar (USD), with its supply regulated by an algorithm or demand. The main goal of stablecoins is to provide an on/off-ramp for investors willing to trade and invest in cryptocurrencies. Stablecoins also allow investors to store value since cryptocurrencies, in general, are subject to volatility.
Bitcoin dominance is the ratio of Bitcoin’s market capitalization to the total market capitalization of all cryptocurrencies combined. It provides a clear picture of Bitcoin’s interest among investors. A high BTC dominance typically happens before and during a bull run, in which investors resort to investing in relatively stable and high market capitalization cryptocurrency like Bitcoin. A drop in BTC dominance usually means that investors are moving their capital and/or profits to altcoins in a quest for higher returns, which usually triggers an explosion of altcoin rallies.
AI agents are playing a crucial role in helping investors make informed decisions about crypto investments and trading.
We asked the OG AI agent, OpenAI’s ChatGPT, about its forecasts for some of the most popular altcoins on the market – XRP, Solana and Dogecoin. We have also included a bonus forecast at the end.
With real-time access to price data and breaking news, combined with its ability to conduct multi-factor analysis, ChatGPT is uniquely positioned to deliver well-informed and highly relevant crypto price forecasts.
ChatGPT’s 4o model is highly bullish on XRP.
The AI model expects an imminent settlement in the landmark Ripple vs SEC lawsuit, which would provide significant regulatory clarity to XRP, paving the way for massive institutional investment.
Just today, on Thursday, Ripple and the SEC filed a renewed joint motion asking SDNY District Judge Analisa Torres to dissolve the previously imposed injunction against the company. They also requested a reduction of the previously imposed $125 million penalty to $50 million as part of the settlement terms.
ChatGPT also noted the high approval odds of spot XRP ETFs. Bloomberg analysts Eric Balchunas and James Seyffart have given 95% odds of an SEC green light this year, which could be considerably bullish.
As per JPMorgan’s report, spot XRP ETFs could attract $4 billion to $8 billion in net inflows in the first year. Combine this with the expected XRPL adoption, and the asset could see significant institutional demand this year.
Even ChatGPT’s bearish scenario for XRP places the token at $4, which is nearly an 80% gain from current levels. Its base case targets $5, while the bullish outlook projects a move to $7.
ChatGPT doesn’t appear to be as bullish on Dogecoin as the broader market consensus. While many are anticipating a rally to $1, its base case is a modest surge to the $0.30 – $0.35 range.

The AI model does see the possibility of a rally to $0.50, driven by strong retail investments, explosive Bitcoin growth and the continued support of Tesla and X owner Elon Musk.
ChatGPT also notes the bullish impact of spot Dogecoin ETFs, which Bloomberg’s Balchunas and Seyffart give 80% approval odds.
ChatGPT cites a wide variety of factors regarding why it is massively bullish on Solana this year.
From network innovation rollouts like Firedancer and Alpenglow to the tokenized asset initiatives via the R3 partnership, the popular AI model anticipates a plethora of bullish narratives for SOL to rally on.
The spot Solana ETF approval is also imminent, with Balchunas and Seyffart giving 90% approval odds. JPMorgan’s recent report anticipates $3 billion to $6 billion in inflows in the first year, which could spark an explosive surge in the Solana price.
Consequently, ChatGPT’s base case for Solana this year is $275, with a possibility of a new all-time high of $400.

Large-cap altcoins remain attractive investments for this bull market. However, the largest gains could potentially come from buying high-upside, low-cap gems.
We asked ChatGPT about its take on one of the hottest presale tokens of this year, Solaxy (SOLX). Surprisingly, the AI was bullish on its upside prospects, claiming that SOLX could grow by up to 1000% from its current presale price.

ChatGPT highlights Solaxy’s strong presale performance, which has now raised over $48 million in its ICO behind strong whale investments.
It also highlights Solaxy’s layer-2 architecture, staking protocol and cross-chain design as its key strengths. This refers to the project’s Hyperlane-powered multi-chain bridge, which has the potential to become one of the most advanced interoperability tools in the crypto ecosystem.
The upcoming mainnet launch, exchange listings and widespread adoption within the growing Solana ecosystem could also prove to be bullish catalysts. For instance, Solaxy is launching its competitor to Pump.fun, called the Igniter Protocol, as well as its DEX, both expected to see significant demand.
ChatGPT has also highlighted Solaxy’s experienced developer team as one of its biggest strengths. This team knows how to drive up enthusiasm, as evident by today’s $62 million token burn.
Prominent crypto influencers agree with ChatGPT’s projections, with many calling it the next 10x crypto.
This article has been provided by one of our commercial partners and does not reflect Cryptonomist’s opinion. Please be aware our commercial partners may use affiliate programs to generate revenues through the links on this article.
Most of the coins have turned back to the red zone, according to CoinStats.CoinStats”>
The rate of Bitcoin ![]() BTCUSD has declined by 2.7% since yesterday.TradingView”>
BTCUSD has declined by 2.7% since yesterday.TradingView”>
On the hourly chart, the price of BTC keeps falling, which means bears are controlling the situation on the market. If nothing changes, one can expect a test of the $106,000 range soon.TradingView”>
On the longer time frame, sellers are also more powerful than buyers.
If the daily bar closes with no long wick, there is a possibility of seeing an ongoing drop to the $105,000 mark by the end of the week.TradingView”>
From the midterm point of view, the weekly bar is currently more bearish than bullish. Thus, the volume keeps going down, which means buyers are not ready for ongoing growth. In this case, sideways trading in the area in the range of $104,000-$108,000 is the more likely scenario.
Bitcoin is trading at $107,097 at press time.
With the cryptocurrency market poised for a strong upswing, XRP investors hope the altcoin will resume its rally soon. With this optimism, XRP investors have also become eager to know when the token will reach its cycle peak to determine when to sell for maximum returns.
As investors seek to capitalize on this opportunity, a new crypto project is quietly gaining ground by addressing a key challenge that XRP has yet to solve: Real-world payment issues. So, before making any big moves this cycle, let’s look at the recent XRP price predictions and what the new crypto project is building behind the scenes.
XRP has remained below $3 in 2025 but is on the verge of a breakout. Analysts suggest it could hit $27 if the SEC approves a spot ETF, with Polymarket estimating the odds at 87%. This optimism stems from the new SEC Chair’s crypto-friendly stance.
Ripple is also active, expanding its global payment network and seeking partnerships. CEO Brad Garlinghouse believes that, with US collaborations, XRP might surge once its lawsuit with the SEC concludes. However, competition is intensifying, particularly from Circle’s fast-growing payment network, which could challenge Ripple’s position if delays occur.
Moreover, on a realistic note, a $27 price tag translates to a $1.9 trillion market cap, which is ambitious, even for XRP. Although XRP has performed well over the yearly charts, rising by 350%, any rally it will embark on from now will depend not solely on charts but on what the SEC does next.
While XRP wrestles with regulators, a new project is already working on the ground floor, building a Pay-Fi platform that sends crypto directly to any bank account with no wallet required. That alone removes a massive barrier for everyday users and businesses trying to tap into blockchain finance.
It doesn’t charge any fees for currency conversion. If you spend $500, the recipient gets $500 no hidden cuts. For freelancers and remote workers, receiving international payments is a significant concern, but thanks to the newcomer, they don’t have to worry about not getting their full payouts.
For businesses, the platform offers a plug-and-play checkout system that accepts crypto and settles in fiat instantly. That means no more worrying about price volatility or waiting on slow exchanges. Just fast, clean settlement like Stripe, but with crypto flexibility.
It’s also worth knowing that transfers are processed with speed in mind. Crypto is sent instantly, and fiat is usually received the same day via local banking systems. That’s a lifesaver when dealing with emergencies or time-sensitive business payments. The name of this gamechanger? Remittix.
Remittix’s presale is still underway, racking up over $15.6 million from over 20,000 holders. The presale FOMO has skyrocketed dramatically, especially with the price at a fraction of a penny just $0.0781. Meanwhile, early buyers using promo code SPRINT50 can get a 50% bonus, making now an ideal time to invest.
Tokens can be purchased with ETH, USDT or a card and are delivered to your dashboard within 5–10 minutes, depending on network traffic. After the presale, Remittix plans to list on Uniswap and other DEXs, with liquidity locked to ensure stability and investor confidence.
Discover the future of PayFi with Remittix by checking out their presale here:
Website: https://remittix.io/
Socials: https://linktr.ee/remittix
