The main category of Crypto News.
You can use the search box below to find what you need.
[wd_asp id=1]
The main category of Crypto News.
You can use the search box below to find what you need.
[wd_asp id=1]
Bulls are more powerful than bears today, according to CoinStats.CoinStats”>
The rate of Ethereum ![]() ETHUSD has gone up by 3.62% since yesterday.TradingView”>
ETHUSD has gone up by 3.62% since yesterday.TradingView”>
On the hourly chart, the price of the main altcoin is near the local resistance of $2,837. One should focus on the daily bar’s closure in terms of that mark.
If it happens around it, the upward move may lead to the test of the $2,900 zone.TradingView”>
On the daily time frame, the rate of ETH has broken the resistance of $2,788. If bulls can hold the gained initiative, the upward move is likely to continue to the $2,900 range.TradingView”>
From the midterm point of view, the picture is also bullish. If the weekly bar closes around the current prices or above, there is a possibility to witness a test of the vital $3,000 mark.
Ethereum is trading at $2,838 at press time.
Dogecoin is back in the spotlight this week, surging over 6% amid renewed investor confidence, fresh technical signals, and a surprise truce between two high-profile figures—Elon Musk and U.S. President Donald Trump.
The rally follows Musk’s public apology for his harsh comments toward Trump, marking a significant turnaround after nearly a week of online hostility. The billionaire entrepreneur admitted he “went too far” in his remarks, a move that appears to have reassured markets and reignited interest in Dogecoin.
The Dogecoin network witnessed renewed optimism after Elon Musk softened his tone toward President Trump following a bitter six-day online clash. The billionaire, who had previously slammed Trump’s bipartisan spending bill as “a disgusting abomination,” took to X to offer a rare mea culpa.
“I regret some of my posts about President Donald Trump last week. They went too far,” Musk admitted on Wednesday morning.
Elon Musk publicly expressed regret for his recent comments about President Donald Trump, admitting they went too far. Source: Elon Musk via X
The fallout from the feud had briefly overshadowed broader market developments. However, Musk’s reconciliation with Trump — a political figure closely tied to Dogecoin’s meme-driven surges — appears to have rekindled bullish sentiment around DOGE.
According to CoinMarketCap, Dogecoin rose by over 6.6% within 24 hours, reaching $0.2029, with its market capitalization swelling to $30.37 billion. This DOGE price move was also backed by a 24% spike in trading volume, indicating renewed interest from retail and institutional Dogecoin investors alike.
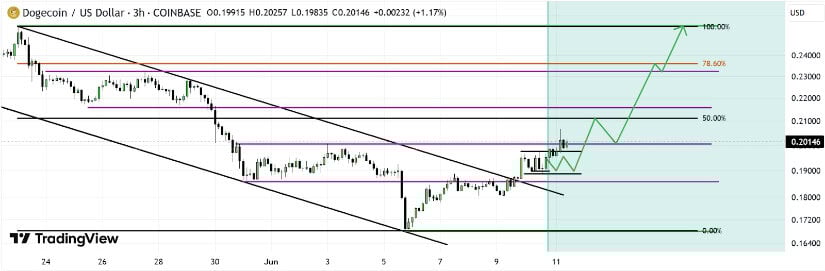
The latest Dogecoin price analysis indicates that the token has formed a classic V-shaped recovery from the $0.18 support zone. The rally is attracting attention not only due to Musk’s involvement but also because of growing speculation around a potential Dogecoin ETF.
“DOGE’s resilience through the recent political drama highlights how sentiment and community engagement continue to define its price action,” noted Shaurya Malwa from CoinDesk Markets.

Despite current hesitation, a bullish forecast suggests Dogecoin could rally to $0.90 by next month. Source: kaypeesbusiso10 on TradingView
Technical indicators support this momentum. On the 2-hour chart, the RSI is approaching 70, hinting at potential overbought conditions, while the MACD remains in bullish territory. Bollinger Bands are widening, a sign that volatility — and possibly upside potential — is increasing.
DOGE is now testing the $0.205 resistance level. A confirmed breakout above this zone could clear the path to $0.22 in the short term, strengthening the case for a sustained Dogecoin rise.
With Elon Musk likely taking a step back from political controversies, some analysts believe he may soon return to his familiar role as Dogecoin’s unofficial hype man.
“Now that Musk and Trump are no longer at odds, we may see Elon return to his usual crypto tactics,” said Maksim Balashhevich, founder of Santiment.
DOGE/USD is consolidating, signaling potential smart money accumulation ahead of an upward breakout. Source: mwananukachabota on TradingView
Balashhevich emphasized that Dogecoin’s social media activity remains relatively quiet for now. However, he cautioned that a sudden surge in online chatter, especially from Musk, could act as a major catalyst.
Historical trends support this view. Dogecoin saw a massive 200% pump in November 2024 after Trump’s election victory, and again in January 2025 following Musk’s symbolic appointment to the Department of Government Efficiency (DOGE).
Beyond Musk’s influence, structural developments are helping Dogecoin cement its relevance in the wider crypto ecosystem.
The memecoin has recently been integrated into the Coinbase-backed Base network, expanding its utility in decentralized finance (DeFi) applications. This move enables Dogecoin holders to interact more seamlessly across multiple platforms, a notable milestone for the Dogecoin network.
Additionally, speculation around a Dogecoin ETF has intensified. As of this week, Polymarket data shows a 51% probability of ETF approval by the SEC in 2025. Institutional accumulation and consistent high-volume trading suggest that Dogecoin could continue to challenge expectations in a volatile market landscape.
In another noteworthy development, Ripple CEO Brad Garlinghouse, once a vocal critic of memecoins, has shifted his stance on Dogecoin.
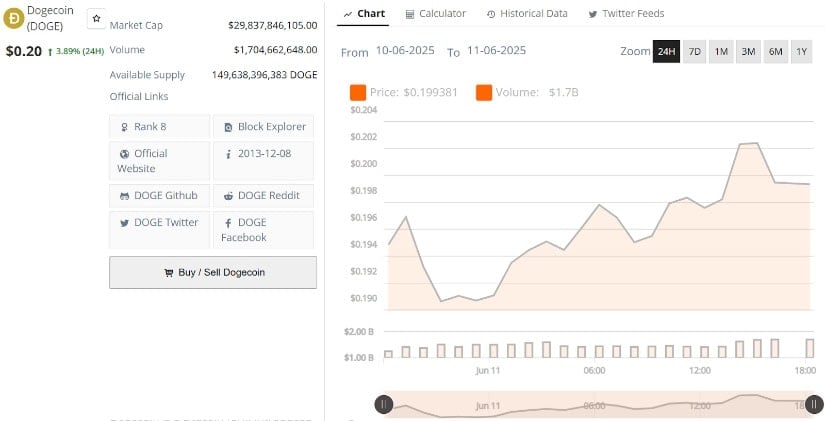
Dogecoin (DOGE) was trading at around $0.20, up 3.89% in the last 24 hours at press time. Source: Brave New Coin
“It’s part of the ecosystem. It plays a role,” Garlinghouse remarked at Apex 2025, acknowledging Dogecoin’s high liquidity and its cultural relevance in the crypto space.
Although he clarified he has “never purchased a meme coin,” his acknowledgment marks a significant pivot in attitude, reflecting broader acceptance of DOGE’s place in the market.
Dogecoin is currently holding above key support at $0.1983, with resistance near $0.205. If the DOGE price pushes decisively past this level, technical analysts expect a potential move toward $0.22, and possibly higher, depending on Musk’s future actions and overall market sentiment.
However, indicators such as the RSI suggest the token is nearing overbought territory on several timeframes, which could lead to brief consolidation or a minor pullback before the next leg up.
For now, Dogecoin prediction models remain optimistic. With improving sentiment, high-profile endorsements, and renewed hype potential, DOGE may be preparing to break through longstanding resistance and reclaim its spot among the top-performing digital assets.
Ripple (XRP) is rising marginally to trade at $2.31 at the time of writing on Wednesday, as interest in XRP-related financial products rapidly grows, with Ondo Finance, a tokenization platform, launching its flagship tokenized US treasury fund on the blockchain.
Meanwhile, the Bureau of Labor Statistics (BLS) report shows that the United States (US) Consumer Price Index (CPI) data rose slightly to 2.4% in May from 2.3% in April, falling below the market forecast of 2.5%.
Major digital assets, including Bitcoin (BTC), Ethereum (ETH) and XRP, edged higher during the American session on Wednesday, buoyed by the US CPI data coming in below the market forecast.
As reported by FXStreet, the Core CPI, which excludes the volatile prices of food and energy, rose 2.8% in May, matching the figures in April. Monthly, the CPI and the Core CPI each rose 0.1%, sitting below market expectations of 0.2% and 0.3%, respectively.
The inflation data, which comes ahead of the Federal Reserve (Fed) meeting on June 18, is unlikely to influence the Fed’s decision on interest rates. According to the CME Group’s FedWatch tool, analysts expect the central bank to leave the rates unchanged in the range of 4.25% – 4.50%.
FedWatch tool | Source: CME Group
Ondo Finance has announced the launch of its flagship Ondo Short-Term US Government Treasuries (OUSG) on the XRP Ledger (XRPL), as per communication on social media platform X.
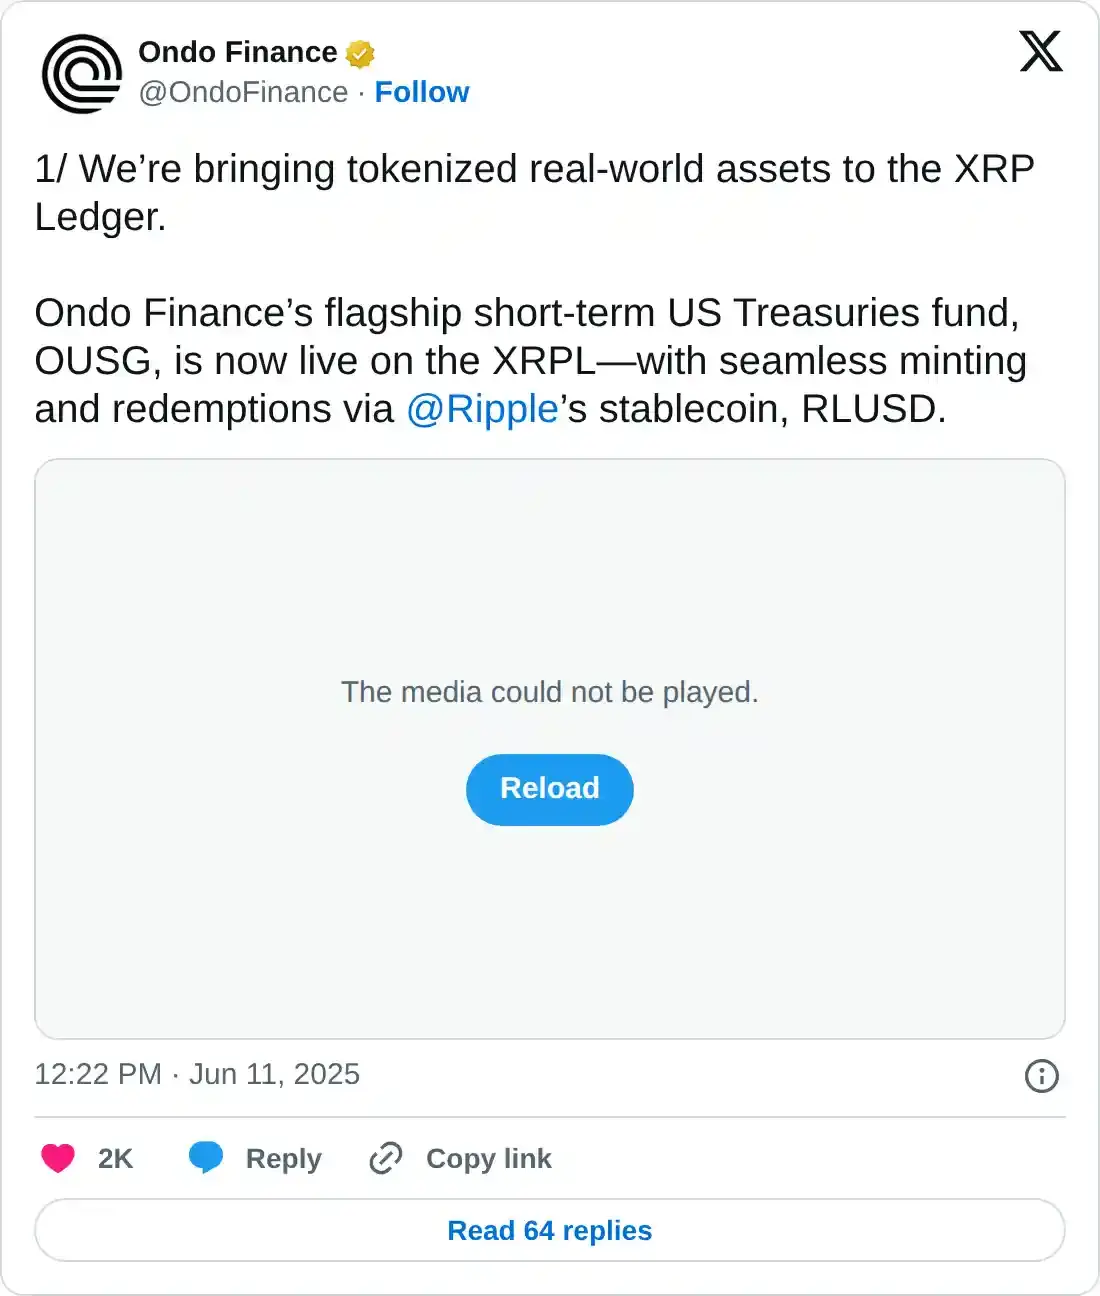
The launch is a major milestone, bridging the gap between Decentralized Finance (DeFi) and the traditional finance sector. Institutional investors on XRPL can now tap OUSG for exposure to short-term US Treasuries, generating yields through a diversified portfolio of industry money market funds.
The new product enables investors to mint and redeem using Ripple’s stablecoin, RLUSD, made possible by round-the-clock capital access and deployment. At the same time, the platform offers high-quality, low-risk liquidity options, supported by accessible intraday settlement and liquidity, which enables efficient portfolio management and expanded exposure to tokenized US Treasury-backed assets.
“By bringing OUSG to the XRPL, Ondo Finance is bringing institutional-grade assets directly to the institutions, providing access to high-quality tokenized assets as flexible treasury management tools,” Ondo Finance said in a blog post. “As global demand for tokenized financial products accelerates, this expansion furthers our mission to bridge traditional finance and onchain markets,” the blog post continued.
The platform boasts seamless multi-chain support across Ethereum, Solana and the XRP Ledger. Investments span leading funds, including BlackRock’s USD Institutional Digital Liquidity Fund (BUIDL), WisdomTree’s Government Money Market Digital Fund (WTGXX) and Franklin Templeton’s Franklin On-Chain US Government Money Fund (FOBXX).
Ondo Finance’s groundbreaking launch follows VivoEnergy, a NASDAQ-listed firm, which announced plans to deploy $100 million worth of XRP tokens on the Flare blockchain to generate yield. Additionally, the company is reportedly planning to adopt a payment system powered by the RLUSD stablecoin to serve as its cash equivalent platform.
The XRP price edges higher above the confluence support at $2.26, established by the 50-day Exponential Moving Average (EMA) and the 100-day EMA, to trade at around $2.32 at the time of writing.
Technical indicators, including the Moving Average Convergence Divergence (MACD), reinforce the bullish outlook by sending a buy signal, as observed on the daily chart below.
Such a signal, which often encourages traders to buy XRP, occurs when the blue MACD line crosses above the red signal line. With the green histogram bars expanding above the mean line (0.00), the path of least resistance could stay firmly upward.
The Money Flow Index (MFI) indicator has recently crossed above the 50 midline, signaling that bulls have the upper hand, as more money is flowing into XRP. If the uptrend persists, traders may begin to adjust to the likelihood of the XRP price moving 28% above its current level to the hurdle at $3.00.
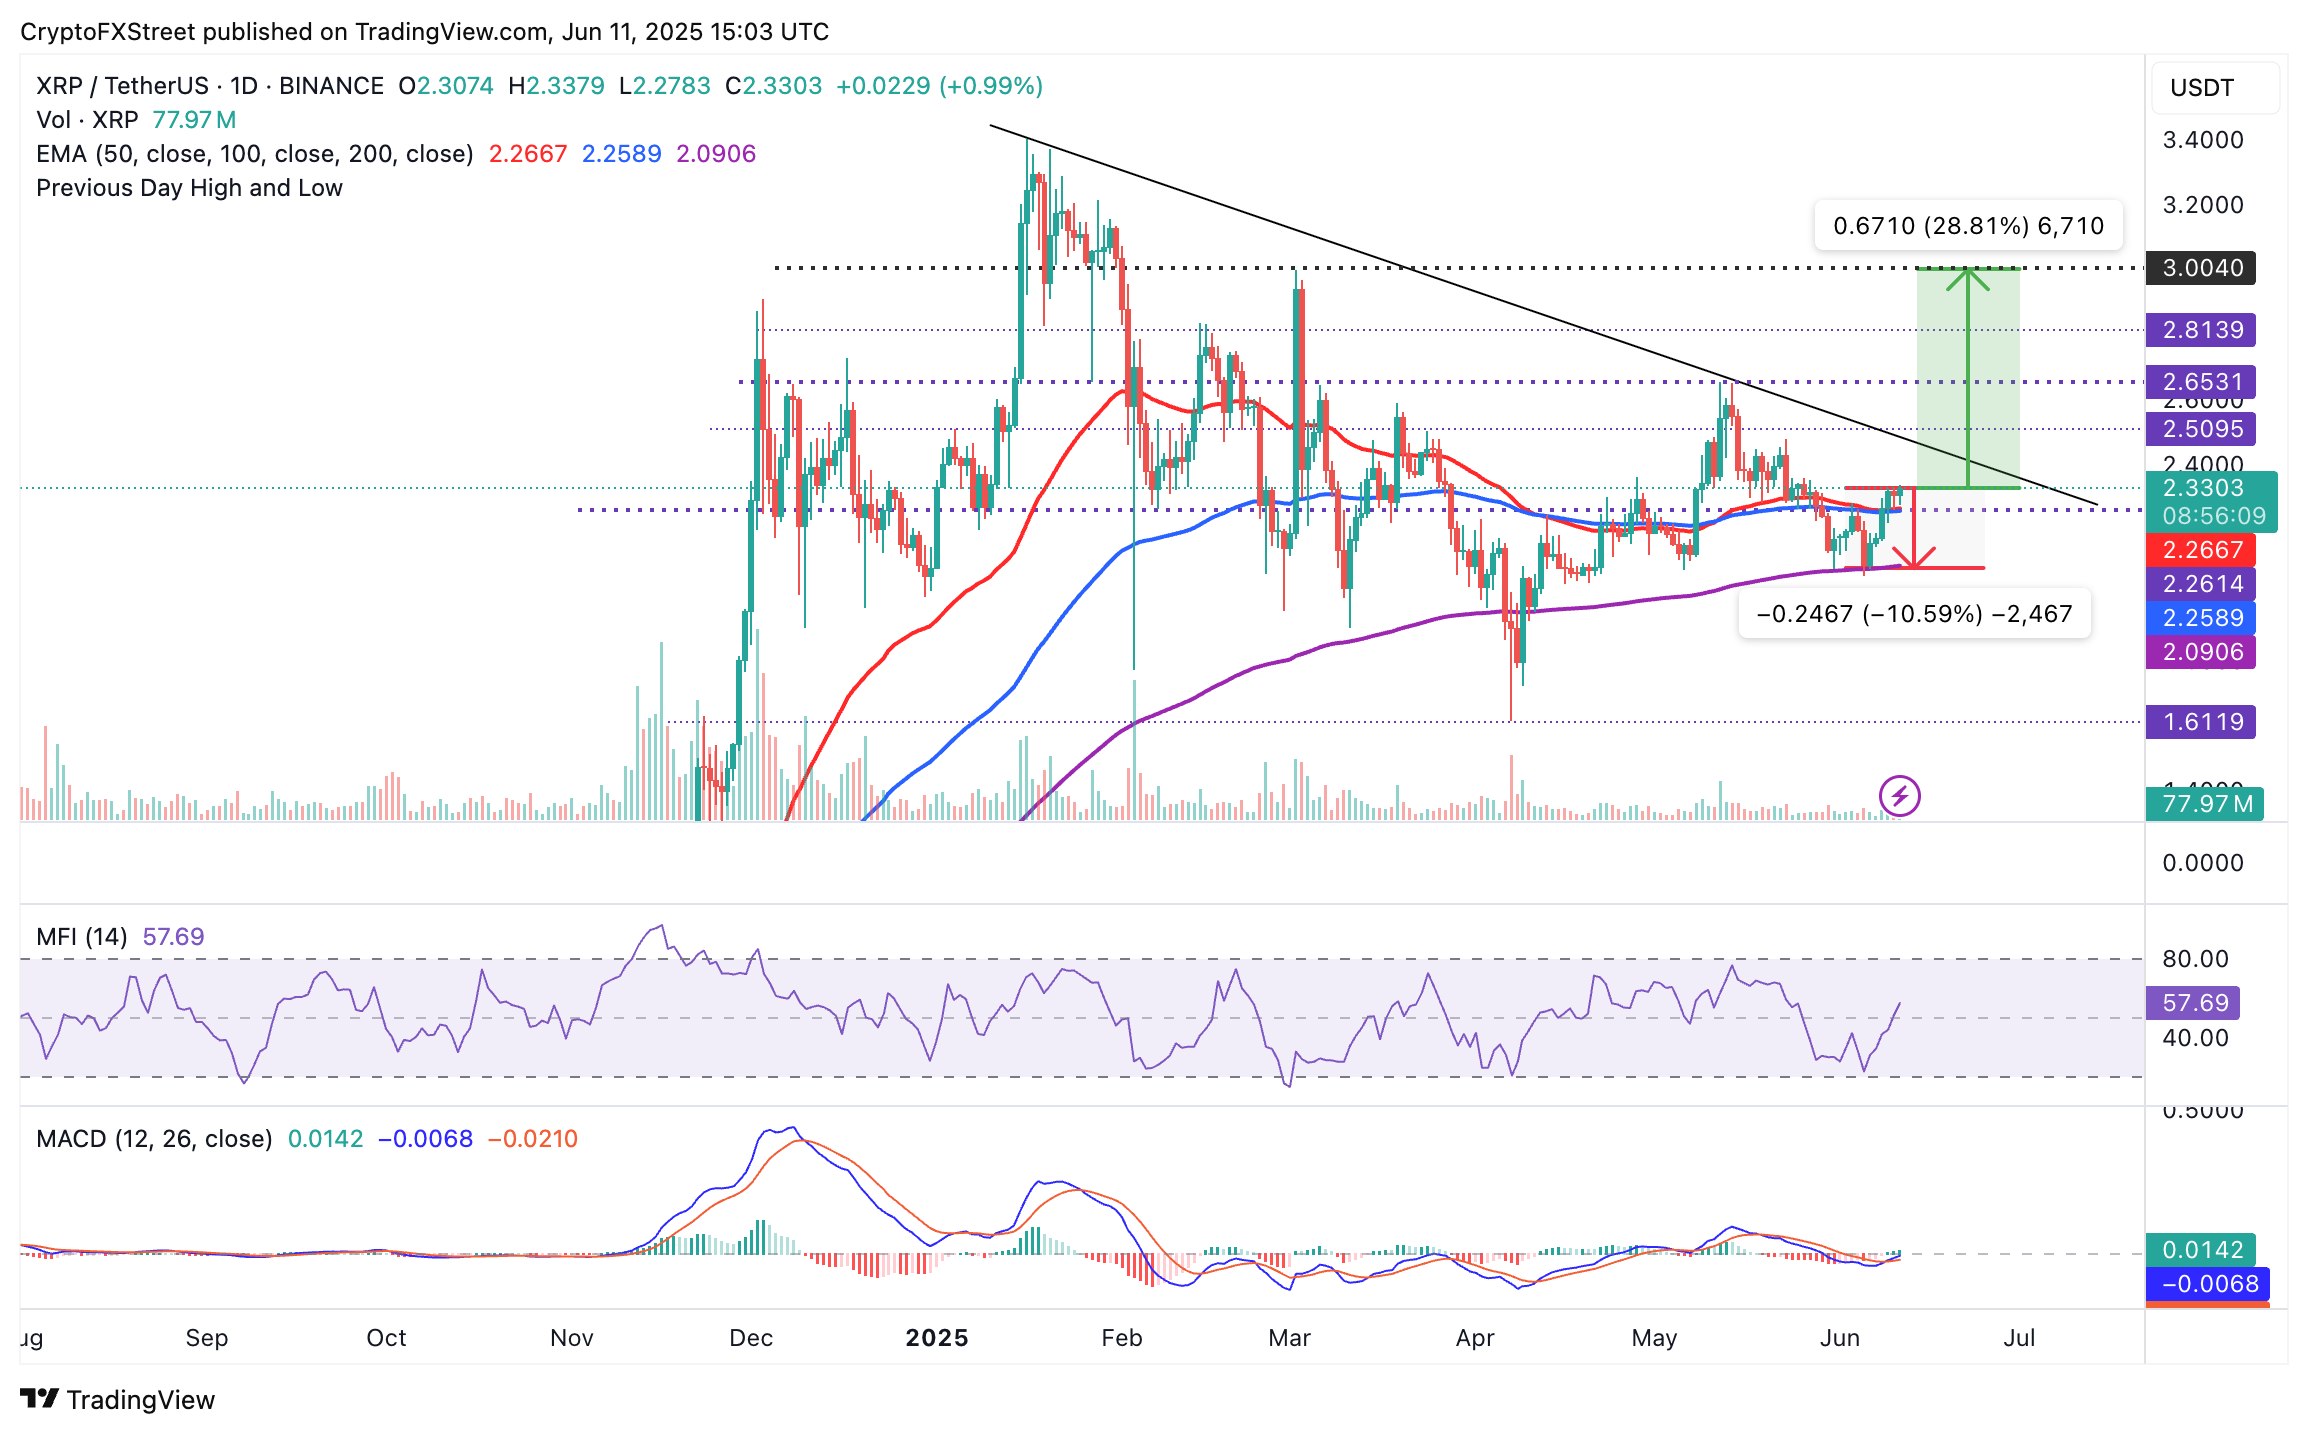
XRP/USD daily chart
Still, downside vulnerability cannot be ignored, especially with XRP likely to encounter resistance at $2.40 and $2.65, both of which were tested in mid-May. If the confluence support at $2.26 breaks, traders might want to prepare for support at the 200-day EMA, positioned 10.5% below the current level at $2.09.
It depends on the transaction, according to a court ruling released on July 14, 2023:
For institutional investors or over-the-counter sales, XRP is a security.
For retail investors who bought the token via programmatic sales on exchanges, on-demand liquidity services and other platforms, XRP is not a security.
The United States Securities & Exchange Commission (SEC) accused Ripple and its executives of raising more than $1.3 billion through an unregistered asset offering of the XRP token.
While the judge ruled that programmatic sales aren’t considered securities, sales of XRP tokens to institutional investors are indeed investment contracts. In this last case, Ripple did breach the US securities law and had to pay a $125 million civil fine.
The ruling offers a partial win for both Ripple and the SEC, depending on what one looks at.
Ripple gets a big win over the fact that programmatic sales aren’t considered securities, and this could bode well for the broader crypto sector as most of the assets eyed by the SEC’s crackdown are handled by decentralized entities that sold their tokens mostly to retail investors via exchange platforms, experts say.
Still, the ruling doesn’t help much to answer the key question of what makes a digital asset a security, so it isn’t clear yet if this lawsuit will set precedent for other open cases that affect dozens of digital assets. Topics such as which is the right degree of decentralization to avoid the “security” label or where to draw the line between institutional and programmatic sales persist.
The SEC has stepped up its enforcement actions toward the blockchain and digital assets industry, filing charges against platforms such as Coinbase or Binance for allegedly violating the US Securities law. The SEC claims that the majority of crypto assets are securities and thus subject to strict regulation.
While defendants can use parts of Ripple’s ruling in their favor, the SEC can also find reasons in it to keep its current strategy of regulation by enforcement.
A look at Dogecoin’s price outlook, technicals, and investment potential.
Dogecoin remains a highly speculative yet resilient cryptocurrency, driven more by memes and community engagement than by technical fundamentals. It shows moderate short-term stability but remains volatile. While it’s not for every investor, DOGE continues to attract attention as a high-risk, high-reward play.
Key Takeaways:
Dogecoin’s journey from an internet joke to a top-10 cryptocurrency is one of the most unexpected success stories in the digital asset space. Initially launched as a parody, Dogecoin has evolved into a widely traded token supported by a passionate online community and amplified by high-profile endorsements.
As market participants continue to debate its long-term value, DOGE remains highly visible – and volatile – within the broader crypto ecosystem.
This article offers a comprehensive analysis of Dogecoin’s current market standing, technical indicators, and future price outlook. By examining both short-term signals and long-term projections, as well as the social and psychological forces driving DOGE’s price action, we aim to help traders and investors assess whether Dogecoin deserves a place in their portfolio.
Dogecoin (DOGE) began as a lighthearted experiment – a meme-inspired digital currency launched in 2013 by software engineers Billy Markus and Jackson Palmer.
Initially created as a parody of the cryptocurrency craze, Dogecoin was based on the popular Shiba Inu “Doge” meme and built on a codebase derived from Litecoin. Despite its humorous origins, Dogecoin quickly cultivated a loyal community and carved out a niche in the crypto world.
What set Dogecoin apart early on was its tipping culture. Users on platforms like Reddit and Twitter (now X) began using DOGE to reward content creators and contributors, fostering a unique ecosystem of microtransactions and community-driven support. This use case helped Dogecoin become one of the first digital currencies to see organic utility beyond speculative trading.
Dogecoin Logo. Source: Dogecoin Official Website
Over the years, Dogecoin has maintained its relevance, buoyed by grassroots enthusiasm, viral social media campaigns, and high-profile endorsements, most notably from Elon Musk.
Although often dismissed by some as a “joke coin”, Dogecoin has proven remarkably resilient. It remains one of the top 10 cryptocurrencies by market capitalization, with active development and a broad base of holders.
Among crypto enthusiasts and early adopters, Dogecoin continues to symbolize the playful yet revolutionary spirit of decentralized finance. It demonstrates how strong community support and cultural relevance can sustain a crypto asset, even in a market driven by complex utility and innovation.
As of June 9, 2025, Dogecoin (DOGE) continues to hold a firm position in the global crypto market. Currently trading at approximately $0.186, DOGE has shown modest intraday movement, fluctuating between $0.180 and $0.187 over the past 24 hours.
Current price of DOGE is
DOGE
$0.20
24h volatility:
6.1%
Market cap:
$30.25 B
Vol. 24h:
$1.62 B
. Despite short-term volatility, the asset remains relatively stable, posting a roughly 1% gain in daily trading.
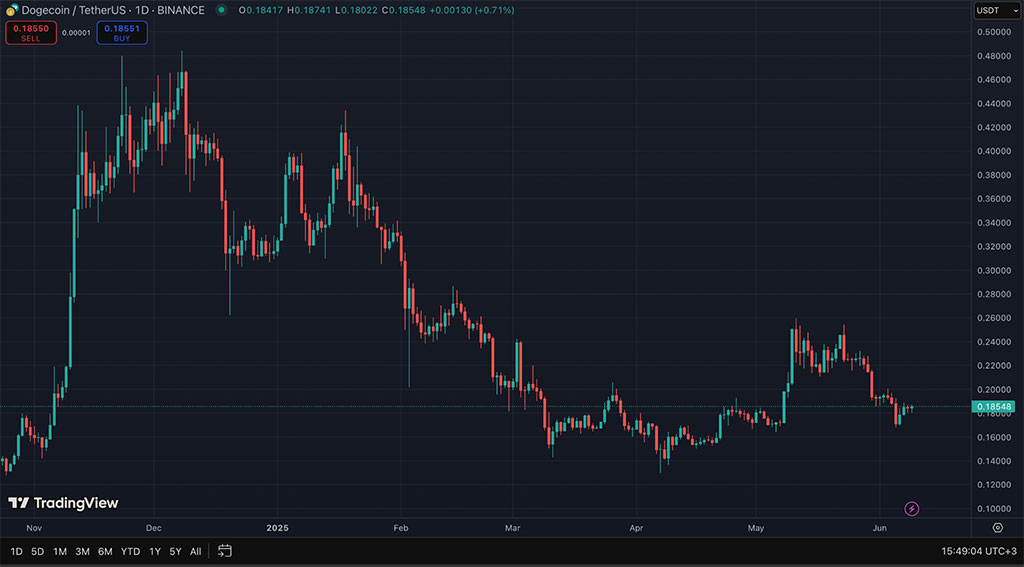
DOGE Price Chart. Source: TradingView
Dogecoin’s market capitalization stands around $27 to $28 billion, placing it consistently among the top 10 cryptocurrencies by market cap, typically at position #8 on platforms like CoinMarketCap and CoinGecko. Its 24-hour trading volume ranges between $750 million and $1.96 billion, reflecting sustained interest and liquidity across major exchanges.
Over the past week, Dogecoin has experienced a gradual decline from late-May highs near $0.23, representing an approximate 18% drop. Nevertheless, it remains the leading token in the meme coin category, outperforming many of its imitators and maintaining a robust community-driven presence in the market.
Dogecoin’s resilience continues to stem from its strong social media support, viral momentum, and longstanding reputation among crypto enthusiasts. Despite its origins as a joke, DOGE has proven itself to be a serious market contender, widely adopted for both trading and cultural relevance within the broader crypto landscape.
Technical indicators continue to play a central role in evaluating Dogecoin’s short- and medium-term price trends. Among the most commonly used tools are moving averages, Relative Strength Index (RSI), and momentum indicators, all of which help traders assess market sentiment and potential reversal points.
Currently, Dogecoin’s 50-day and 200-day moving averages are offering mixed signals. While the 50-day MA remains above the 200-day in some timeframes, suggesting a lingering bullish trend, the narrowing gap between them may indicate a potential shift in momentum. A confirmed golden cross or death cross in the coming weeks could set the tone for broader market movement.
The Relative Strength Index (RSI) for DOGE has hovered between 45 and 55, placing it in a neutral zone. This suggests that Dogecoin is neither overbought nor oversold, leaving room for movement in either direction. A break above 70 would indicate growing upward pressure, while a drop below 30 could signal a potential sell-off.
Momentum indicators like Moving Average Convergence Divergence (MACD) are currently reflecting a modest bullish divergence, with histogram bars trending higher despite flat price action. This can often precede a breakout, especially if accompanied by increasing trading volume.
Together, these technical tools suggest that Dogecoin is in a consolidation phase. While not yet signaling a strong breakout, the indicators highlight a market waiting for a catalyst. Traders and analysts will be closely watching for volume spikes and RSI shifts as confirmation of the next directional move.
| Month | Minimum Price | Average Price | Maximum Price | Potential ROI |
| Jun 2025 | $ 0.175036 | $ 0.199531 | $ 0.234233 | 25.89% |
| Jul 2025 | $ 0.194655 | $ 0.210636 | $ 0.223476 | 20.11% |
| Aug 2025 | $ 0.199262 | $ 0.215724 | $ 0.226361 | 21.66% |
| Sep 2025 | $ 0.214332 | $ 0.232366 | $ 0.264772 | 42.30% |
| Oct 2025 | $ 0.197191 | $ 0.209494 | $ 0.228064 | 22.58% |
| Nov 2025 | $ 0.185605 | $ 0.196561 | $ 0.205589 | 10.50% |
| Dec 2025 | $ 0.188719 | $ 0.196075 | $ 0.208444 | 12.03% |
| Month | Minimum Price | Average Price | Maximum Price | Potential ROI |
| Jan 2026 | $ 0.189324 | $ 0.195044 | $ 0.207138 | 11.28% |
| Feb 2026 | $ 0.189313 | $ 0.299896 | $ 0.429746 | 130.87% |
| Mar 2026 | $ 0.240308 | $ 0.285784 | $ 0.394104 | 111.73% |
| Apr 2026 | $ 0.246422 | $ 0.302819 | $ 0.330556 | 77.59% |
| May 2026 | $ 0.233569 | $ 0.264234 | $ 0.307363 | 65.13% |
| Jun 2026 | $ 0.219994 | $ 0.230615 | $ 0.243399 | 30.76% |
| Jul 2026 | $ 0.245062 | $ 0.26785 | $ 0.281156 | 51.05% |
| Aug 2026 | $ 0.259273 | $ 0.281255 | $ 0.298113 | 60.16% |
| Sep 2026 | $ 0.25458 | $ 0.267603 | $ 0.279395 | 50.10% |
| Oct 2026 | $ 0.20917 | $ 0.231043 | $ 0.247039 | 32.72% |
| Nov 2026 | $ 0.231892 | $ 0.246287 | $ 0.306593 | 64.71% |
| Dec 2026 | $ 0.261009 | $ 0.275588 | $ 0.299986 | 61.16% |
| Month | Minimum Price | Average Price | Maximum Price | Potential ROI |
| Jan 2030 | $ 0.469819 | $ 0.471496 | $ 0.475761 | 155.60% |
| Feb 2030 | $ 0.470464 | $ 0.511458 | $ 0.54997 | 195.46% |
| Mar 2030 | $ 0.486819 | $ 0.498969 | $ 0.531959 | 185.79% |
| Apr 2030 | $ 0.492519 | $ 0.508925 | $ 0.516904 | 177.70% |
| May 2030 | $ 0.484572 | $ 0.493352 | $ 0.508811 | 173.35% |
| Jun 2030 | $ 0.480047 | $ 0.483738 | $ 0.48968 | 163.07% |
| Jul 2030 | $ 0.490731 | $ 0.496736 | $ 0.500664 | 168.97% |
| Aug 2030 | $ 0.493141 | $ 0.500148 | $ 0.506089 | 171.89% |
| Sep 2030 | $ 0.487386 | $ 0.495434 | $ 0.499849 | 168.54% |
| Oct 2030 | $ 0.476439 | $ 0.483518 | $ 0.487793 | 162.06% |
| Nov 2030 | $ 0.484013 | $ 0.49016 | $ 0.508916 | 173.41% |
| Dec 2030 | $ 0.490814 | $ 0.497672 | $ 0.503854 | 170.69% |
A unique mix of market dynamics, social sentiment, and broader developments in the crypto space shapes Dogecoin’s price. Unlike many other digital assets, DOGE is heavily influenced by community engagement and online narratives, making it particularly sensitive to social media activity.
One of the most significant factors is influencer support, particularly from prominent figures like Elon Musk. Tweets or public comments from high-profile personalities have historically triggered rapid price surges or declines, often independent of fundamental metrics. This makes Dogecoin highly reactive to external sentiment rather than purely technical or macroeconomic signals.

Elon Musk tweeted about Dogecoin. Source: X
Market trends and Bitcoin’s performance also play a significant role. As a high-beta asset, Dogecoin tends to follow the broader direction of the crypto market, rising sharply during bull cycles and correcting aggressively during downturns. When investor risk appetite grows, DOGE often becomes a favored speculative bet due to its low unit price and meme appeal.
Another key driver is liquidity and exchange listing activity. Wider availability on platforms like Coinbase and Robinhood has increased accessibility, fueling retail interest and volume spikes. In contrast, delistings or regulatory uncertainty can lead to abrupt drops in market confidence.
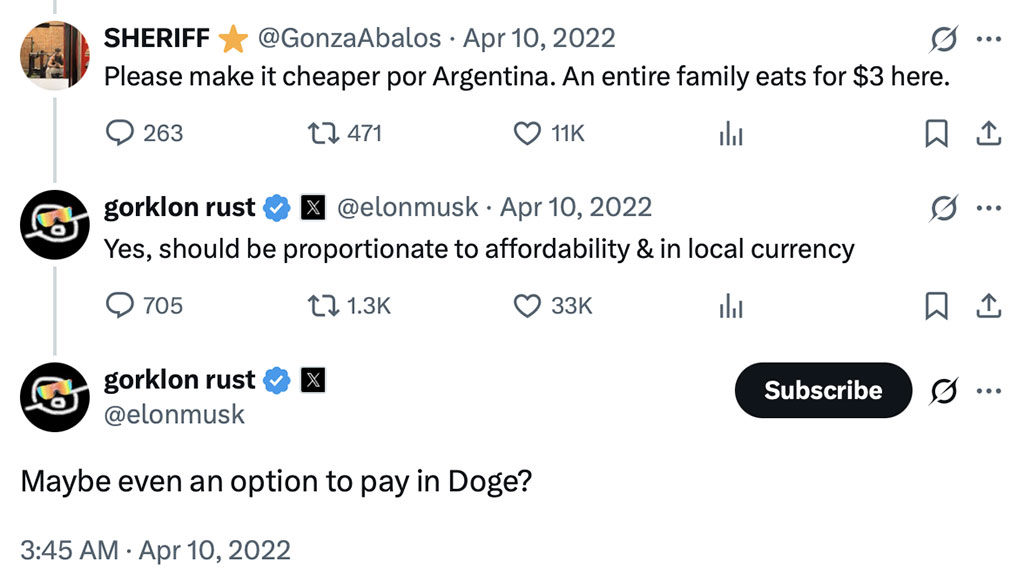
Elon Musk tweeted about Dogecoin. Source: X
Finally, network activity and development updates occasionally influence investor perception. Although Dogecoin’s codebase evolves slowly compared to other top assets, announcements about upgrades or integration into payment systems (e.g., for tipping or merchant acceptance) can enhance its utility narrative and drive price momentum.
Combined, these factors make Dogecoin’s price highly volatile but uniquely responsive to cultural and social triggers, distinguishing it from more technically anchored cryptocurrencies.
Investing in Dogecoin entails a distinct set of risks and opportunities that reflect its unconventional nature within the crypto market. On the risk side, one of the most significant concerns is high volatility. Dogecoin’s price can swing sharply in response to social media trends, celebrity mentions, or changes in overall market sentiment, often without any underlying fundamental shift.
Moreover, Dogecoin remains a largely speculative asset. Unlike cryptocurrencies with clearly defined use cases or technological roadmaps, DOGE lacks a strong development narrative or institutional backing. This makes it vulnerable to loss of investor interest, especially in bear markets when hype-driven assets tend to underperform. The limited technical upgrades and relatively slow pace of innovation further contribute to concerns about its long-term sustainability.
At the same time, Dogecoin offers unique upside potential. Its strong and active community has historically demonstrated an ability to mobilize around the token, driving awareness and market rallies. From Reddit campaigns to viral memes, this grassroots enthusiasm gives DOGE a level of resilience rarely seen in other meme-based assets.
Additionally, Dogecoin has benefited from increased mainstream visibility and accessibility on major platforms, such as Robinhood and Coinbase. These factors make it an entry point for many retail investors exploring crypto for the first time. In moments of market euphoria, DOGE has shown the ability to generate rapid, meme-driven price spikes, offering high-risk, high-reward opportunities for short-term traders.
For investors, Dogecoin represents a gamble on culture as much as on crypto fundamentals – a volatile asset with limited intrinsic value but powerful social momentum.
Dogecoin remains one of the most unconventional yet persistent assets in the crypto market. In the short term, its price tends to react sharply to news cycles, social media momentum, and broader crypto volatility, making it attractive to high-risk traders seeking quick gains. However, this same reactivity can lead to sudden reversals, highlighting the importance of active risk management.
From a medium- to long-term perspective, Dogecoin’s appeal lies less in its technical fundamentals and more in its cultural relevance. Its dedicated community, meme status, and wide accessibility have helped sustain market interest even during downturns. For those with a high tolerance for volatility and a belief in the power of decentralized, community-driven assets, holding a modest allocation of DOGE may offer asymmetric upside, especially in speculative bull markets.
Conversely, investors with a conservative profile or long-term value-driven strategies may find Dogecoin’s lack of a development roadmap and utility limiting. Without consistent innovation or institutional adoption, DOGE remains a sentiment-driven asset that may struggle to deliver sustainable returns outside of hype cycles.
Ultimately, whether to buy, hold, or sell Dogecoin depends on your investment goals, time horizon, and risk appetite. It is not a traditional store of value, but as a social and speculative phenomenon, it continues to defy expectations. For many, Dogecoin isn’t just a cryptocurrency – it’s a bet on the crowd.
Disclaimer: This article is for informational purposes only and does not provide financial, trading, or investment advice. Cryptocurrency prices can fluctuate wildly, so always do your own research (DYOR), assess risks, and consult a professional before making financial decisions. The author and team are not responsible for any losses from using this information.
The rates of most of the coins continue setting new local peaks, according to CoinStats.
Cardano (ADA) is one of the biggest gainers today, rising by 2.55%.

On the hourly chart, the rate of ADA is testing the resistance of $0.7290.
You Might Also Like

If it breaks out, traders may witness a test of the $0.74 zone shortly.

On the longer time frame, the price of ADA is testing the $0.7281 level. If the daily bar closes above it and with no long wick, one should expect an ongoing move to the $0.76 zone.

From the midterm point of view, the rate is in the middle of a wide channel, between the support of $0.6186 and the resistance of $0.8466. As none of the sides is dominating, ongoing sideways trading in the range of $0.70-$0.75 is the more likely scenario.
ADA is trading at $0.7276 at press time.
Concerns about XRP becoming too expensive resonate more when investors look at how the price of 10,000 XRP has changed over the years.
Notably, commentaries around this possibility have dominated the XRP community in recent times, especially in light of the asset’s meteoric surge from November 2024 to January 2025. For context, XRP soared nearly 600% within this period to hit a peak of $3.4.
Following a correction from this top, community pundits like Edoardo Farina have insisted that investors should amass more XRP tokens now that the asset trades for $2. They believe the $2 value is affordable in comparison to the potential price XRP could attain in the future.
Specifically, Farina has consistently suggested that market participants procure at least 10,000 XRP tokens. In one of his latest disclosures, he advised urgency. According to Farina, amid the global economic trend, up to 99% of retail investors could be priced out of the XRP market as the asset’s value continues to expand.
To ascertain how this could happen, The Crypto Basic recently compared the cost of procuring 10,000 XRP tokens over the years. Particularly, a year ago, exactly on June 11, 2024, XRP traded for $0.48. At this price, an investor could amass 10,000 XRP tokens for just $4,800.
However, going further back, the capital requirement was even lower. For instance, exactly five years ago, on June 11, 2020, XRP changed hands around $0.19. With this price, investors who sought to amass 10,000 tokens would have spent a mere $1,900.
Now, as XRP trades for $2.29, these 10,000 tokens are currently valued at $22,900. Essentially, today, it would take $19,000 more to procure 10,000 XRP than five years ago. Moreover, it would cost an investor $18,100 more to purchase 10,000 XRP than it would just a year ago.
Notably, while it would have cost more to procure 10,000 XRP in January 2018 than it is now, analysts believe the sort of downtrend that plagued the market from 2018 is a thing of the past, suggesting there could only be an upward push from here. This trend is the reason behind commentaries such as Edoardo Farina’s.
In his latest remark, he questioned if the growing cost of purchasing crypto assets was due to a rise in the token’s cost or a decline in fiat currencies. Regardless, he has advised investors to save in digital assets like XRP instead of fiat.
Recall that Australian attorney Bill Morgan pushed back on Farina’s recent commentary, suggesting that investors would still be able to procure XRP regardless of its future price.
In response, Farina clarified that his comment bordered more on the idea that the rising cost of large XRP holdings like 10,000 XRP could make owning such a balance unattainable for the average investor. According to him, 10,000 XRP now costs $23,000, and this already is unattainable to some investors. However, this was not the case in 2020, as we recently found.
I know you’re an intelligent guy, which makes this kind of post even more disappointing. The issue isn’t about whether XRP will still trade. Owning 10,000 XRP today costs $23,000. With inflation, rising rent, and stagnant wages, that’s already a luxury most can’t afford. You’re…
— EDO FARINA 🅧 XRP (@edward_farina) June 10, 2025
DisClamier: This content is informational and should not be considered financial advice. The views expressed in this article may include the author’s personal opinions and do not reflect The Crypto Basic opinion. Readers are encouraged to do thorough research before making any investment decisions. The Crypto Basic is not responsible for any financial losses.
After a sharp rebound from early June lows, the Ethereum price today is holding firm near $2,795, pushing into a significant resistance band between $2,800 and $2,835.
This comes after ETH registered a clean breakout from consolidation on the 4-hour chart, supported by expanding Bollinger Bands and sustained volume. The price now sits just beneath the 0.5 Fibonacci retracement level from the 2024–2025 drop, setting the stage for a potential continuation move.
On the weekly chart, ETH is retesting the 0.5 Fib level at $2,845 after a multi-week recovery from $1,385 lows. The larger structure suggests the trend has turned bullish, with the 0.618 retracement at $3,148 now acting as the next macro target if $2,845 is breached.
Zooming into the daily chart, Ethereum price action has pushed into a grey supply zone that triggered prior breakdowns. This zone overlaps with both descending trendline resistance and a historical liquidity pocket, making it a critical level for bulls to flip into support. A successful breakout above $2,835 would clear the path toward $3,000 and $3,150 in the short term.
Ethereum’s recent rally is backed by strong momentum on the lower timeframes. On the 4-hour chart, ETH has reclaimed all major EMAs (20/50/100/200), with the 20 EMA crossing above the 100 and 200 lines — a bullish realignment last seen in late April. The price is also pressing the upper Bollinger Band at $2,861.86, suggesting increased Ethereum price volatility and a potential breakout setup.
The 30-minute RSI is steady near 57.5, just below overbought territory, indicating bulls still have room to push higher. Meanwhile, the MACD line remains above signal despite a narrowing histogram, suggesting bullish momentum is intact but may need a fresh impulse to accelerate.
On the Ichimoku chart, the price is comfortably above the cloud with Tenkan-Sen and Kijun-Sen flattening near $2,785. This signals a pause in immediate trend strength, but the overall bias remains positive as long as ETH stays above $2,746 (cloud base). The Stochastic RSI is turning up from oversold levels (22.74), adding early signs of renewed upside pressure.
The answer to why Ethereum price going up today lies in the multi-timeframe breakout visible across charts. On the 4-hour structure chart, ETH broke above a symmetrical triangle and reclaimed the $2,700–$2,730 demand zone. This breakout aligned with a break in the descending trendline from May’s high, forming a new higher low at $2,430 and confirming a bullish trend shift.
The 30-minute chart shows a well-supported bullish flag breakout, followed by consolidation above $2,775. A minor diagonal resistance exists near $2,834, and a decisive move above it could trigger aggressive long positioning toward $2,900 and beyond.
Looking forward, Ethereum price update signals a high-stakes test of the $2,835 ceiling. If buyers break through with strong volume, upside targets at $2,900 and $3,050 become active. However, failure to hold above $2,775 would expose ETH to a pullback toward $2,713 and $2,660 — areas aligned with the 20 and 50 EMA clusters on the 4-hour chart.
Macro structure remains constructive, with the 0.5 and 0.618 Fib retracement levels ($2,845 and $3,148) framing the next directional zone. Traders should closely watch the RSI and MACD signals for confirmation of breakout momentum.
| Indicator / Zone | Level (USD) | Signal |
| Resistance 1 | 2,835 | Key breakout level |
| Resistance 2 | 3,050 | Next upside target |
| Support 1 | 2,775 | Holding zone post breakout |
| Support 2 | 2,713 | Short-term downside risk |
| 200 EMA (4H) | 2,467 | Major dynamic support |
| RSI (30-min) | 57.5 | Bullish-neutral momentum |
| MACD (30-min) | Positive | Fading, but still bullish |
| Ichimoku Cloud (30-min) | Bullish | Price above cloud |
| Stoch RSI (30-min) | Turning up | Early bullish crossover |
| Bollinger Bands (4H) | Expanding | Breakout potential rising |
Disclaimer: The information presented in this article is for informational and educational purposes only. The article does not constitute financial advice or advice of any kind. Coin Edition is not responsible for any losses incurred as a result of the utilization of content, products, or services mentioned. Readers are advised to exercise caution before taking any action related to the company.
Shaurya is the Co-Leader of the CoinDesk tokens and data team in Asia with a focus on crypto derivatives, DeFi, market microstructure, and protocol analysis.
Shaurya holds over $1,000 in BTC, ETH, SOL, AVAX, SUSHI, CRV, NEAR, YFI, YFII, SHIB, DOGE, USDT, USDC, BNB, MANA, MLN, LINK, XMR, ALGO, VET, CAKE, AAVE, COMP, ROOK, TRX, SNX, RUNE, FTM, ZIL, KSM, ENJ, CKB, JOE, GHST, PERP, BTRFLY, OHM, BANANA, ROME, BURGER, SPIRIT, and ORCA.
He provides over $1,000 to liquidity pools on Compound, Curve, SushiSwap, PancakeSwap, BurgerSwap, Orca, AnySwap, SpiritSwap, Rook Protocol, Yearn Finance, Synthetix, Harvest, Redacted Cartel, OlympusDAO, Rome, Trader Joe, and SUN.
Market technician EGRAG Crypto has identified a W pattern formation on the monthly XRP market cap chart, suggesting an imminent run beyond $1 trillion.
EGRAG disclosed this in a recent commentary, where he focused primarily on the XRP market cap chart. His analysis comes as XRP price continues to linger around the $2 mark, leaving its market largely between $120 billion and $145 billion since last month.
According to EGRAG, the market cap, a direct product of XRP price action, is now in a bullish position. His monthly chart confirmed that the XRP market cap has now formed a W pattern, which also resembles a classic cup and handle structure. This indicates that a breakout to the upside is imminent.
For context, the formation of the pattern began as far back as 2018. Notably, XRP market cap dropped from a peak of $128.5 billion in January 2018 to hit a low of $5 billion in March 2020 before recovering to another high of $89 billion by April 2021. This formed the first part of the W pattern.
Interestingly, after the $89 billion top in April 2021, the XRP market cap collapsed again to another low of $13.88 billion by June 2022 following the Terra collapse that year. Now, the market cap recently rebounded to claim a new all-time high of $195 billion in January 2025. This second wave of movements completed the W formation.
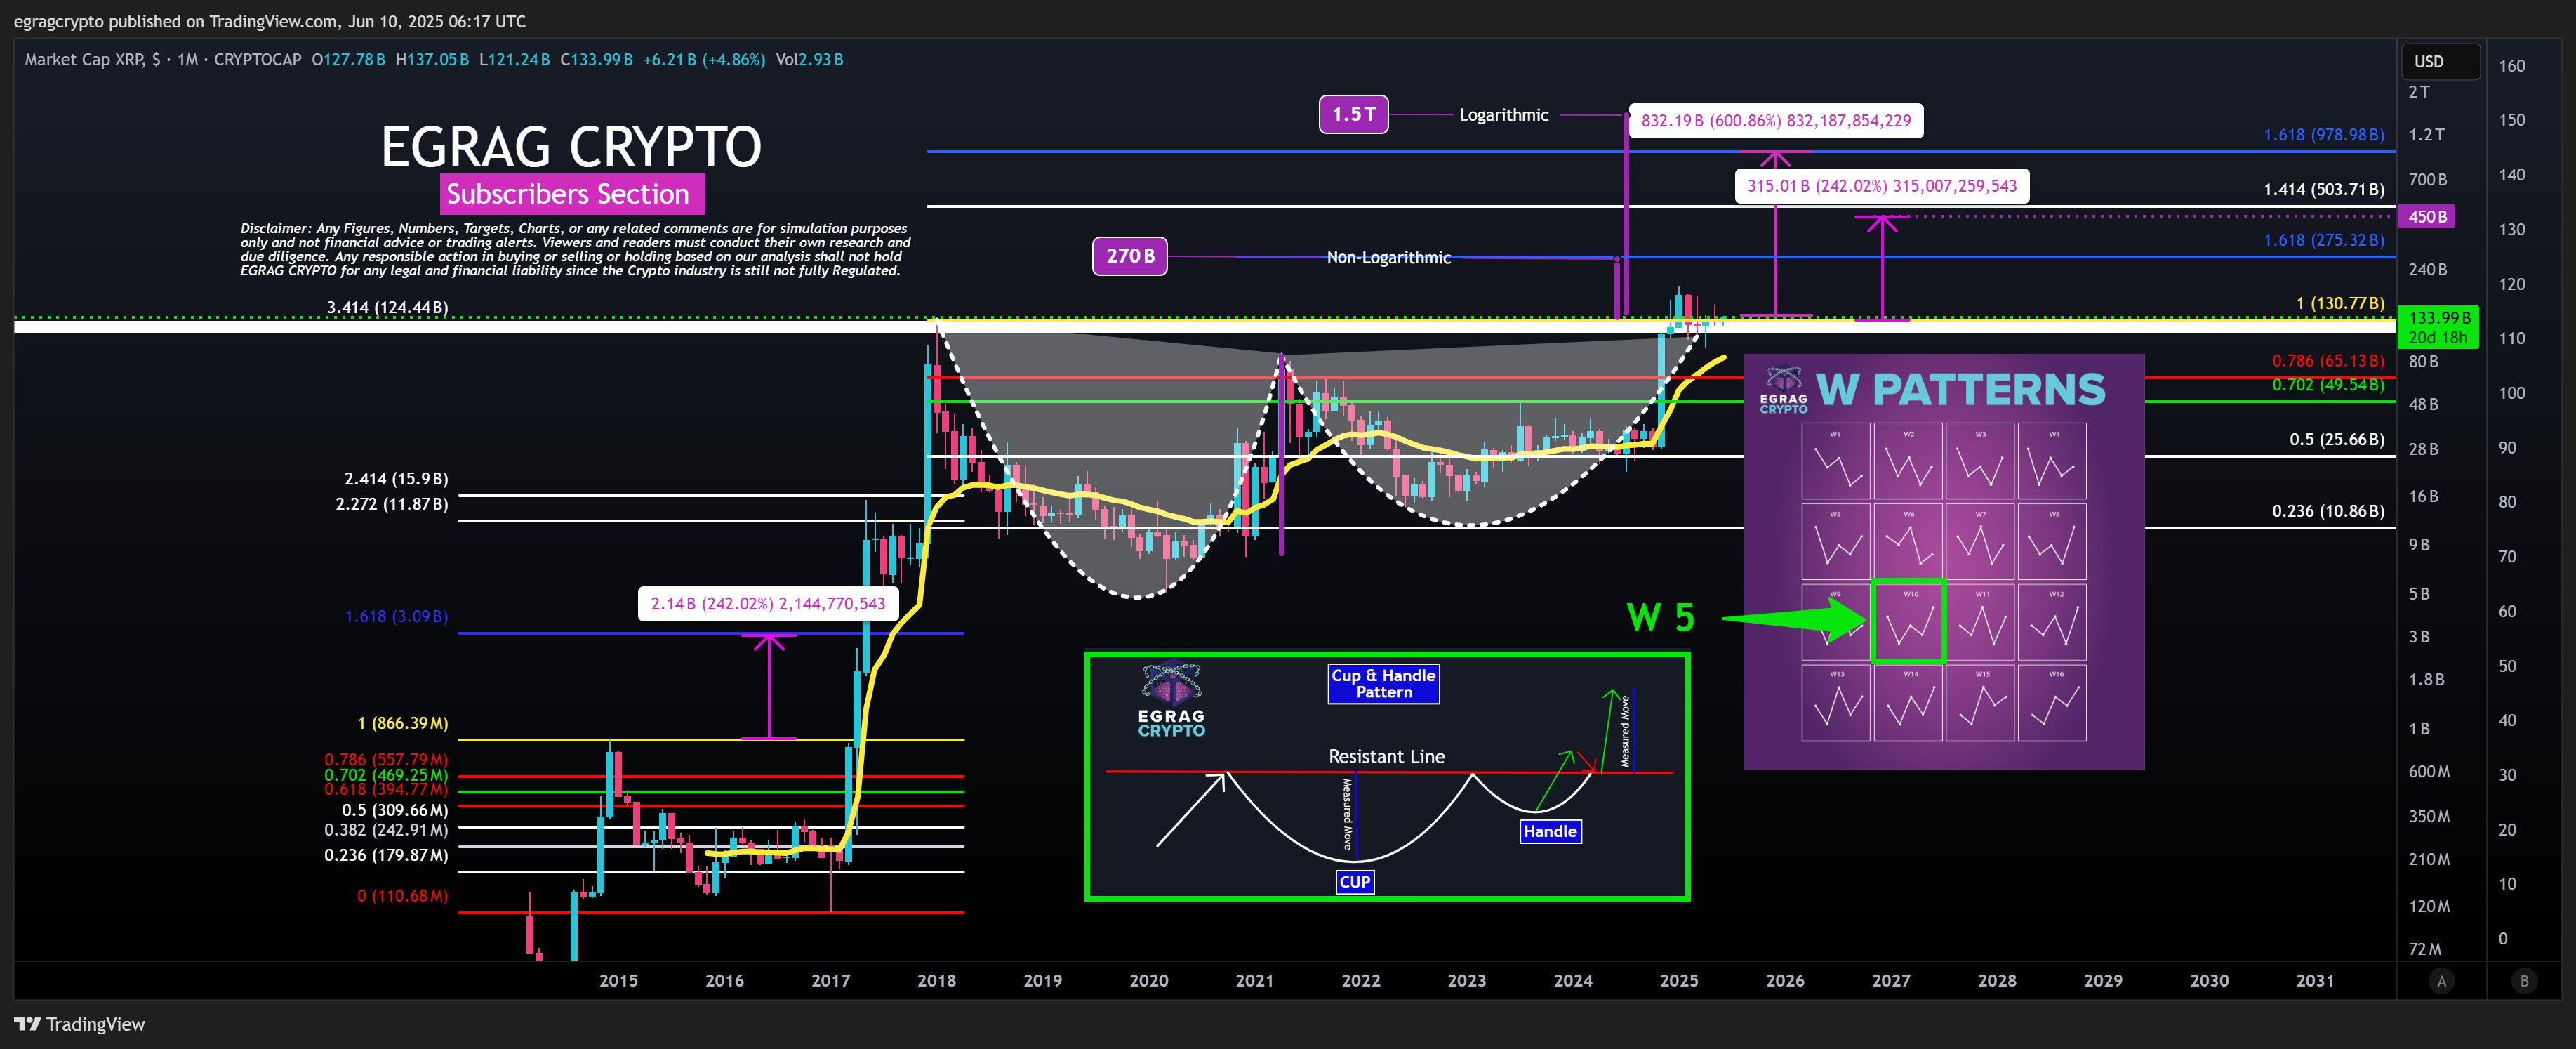
Now, after breaking above the trendline of the W structure, the XRP market cap is retesting this breakout amid the ongoing price consolidation. As earlier mentioned, the market cap has fluctuated between $120 billion and $145 billion in recent times, awaiting a push to greater heights.
Despite this consolidation, EGRAG confirmed that the XRP market cap has held above the previous all-time high of $130 billion from December 2024, which represents Fib. 1. He explained that this position above Fib. 1 indicates that XRP still shows signs of bullish accumulation.
He then presented several upside targets leveraging multiple approaches. Specifically, the first approach considers a measured move from the W formation. In this approach, the non-logarithmic move translates to a target of $270 billion, aligning with Fib. 1.618. This marks a new ATH, corresponding to an XRP price of $4.5.
Meanwhile, still within the first approach, the logarithmic move translates to a market cap target of $1.5 trillion, representing the largest upside target. With XRP’s current circulating supply, the $1.5 trillion market cap would lead to a price of $25. Notably, XRP would need to rise 991% from the current price of $2.29 to reach $25.
However, the second approach considers XRP’s historical patterns from 2017. EGRAG confirmed that in 2017, XRP had to rally 242% from Fib. 1 to reach Fib. 1.618. Currently, XRP is already above Fib. 1, as it eyes the 1.618 extension. If it rallies another 242% to reach Fib. 1.618, this would push its market cap to $450 billion, leading to a price of $7.6.
For the third approach, he suggested that Fib. 1.618, the upside target, could translate to a market cap of $978 billion when considering the 2018 peak and the 2020 low. If this target materializes, it will push the XRP price to $17, considering the circulating supply.
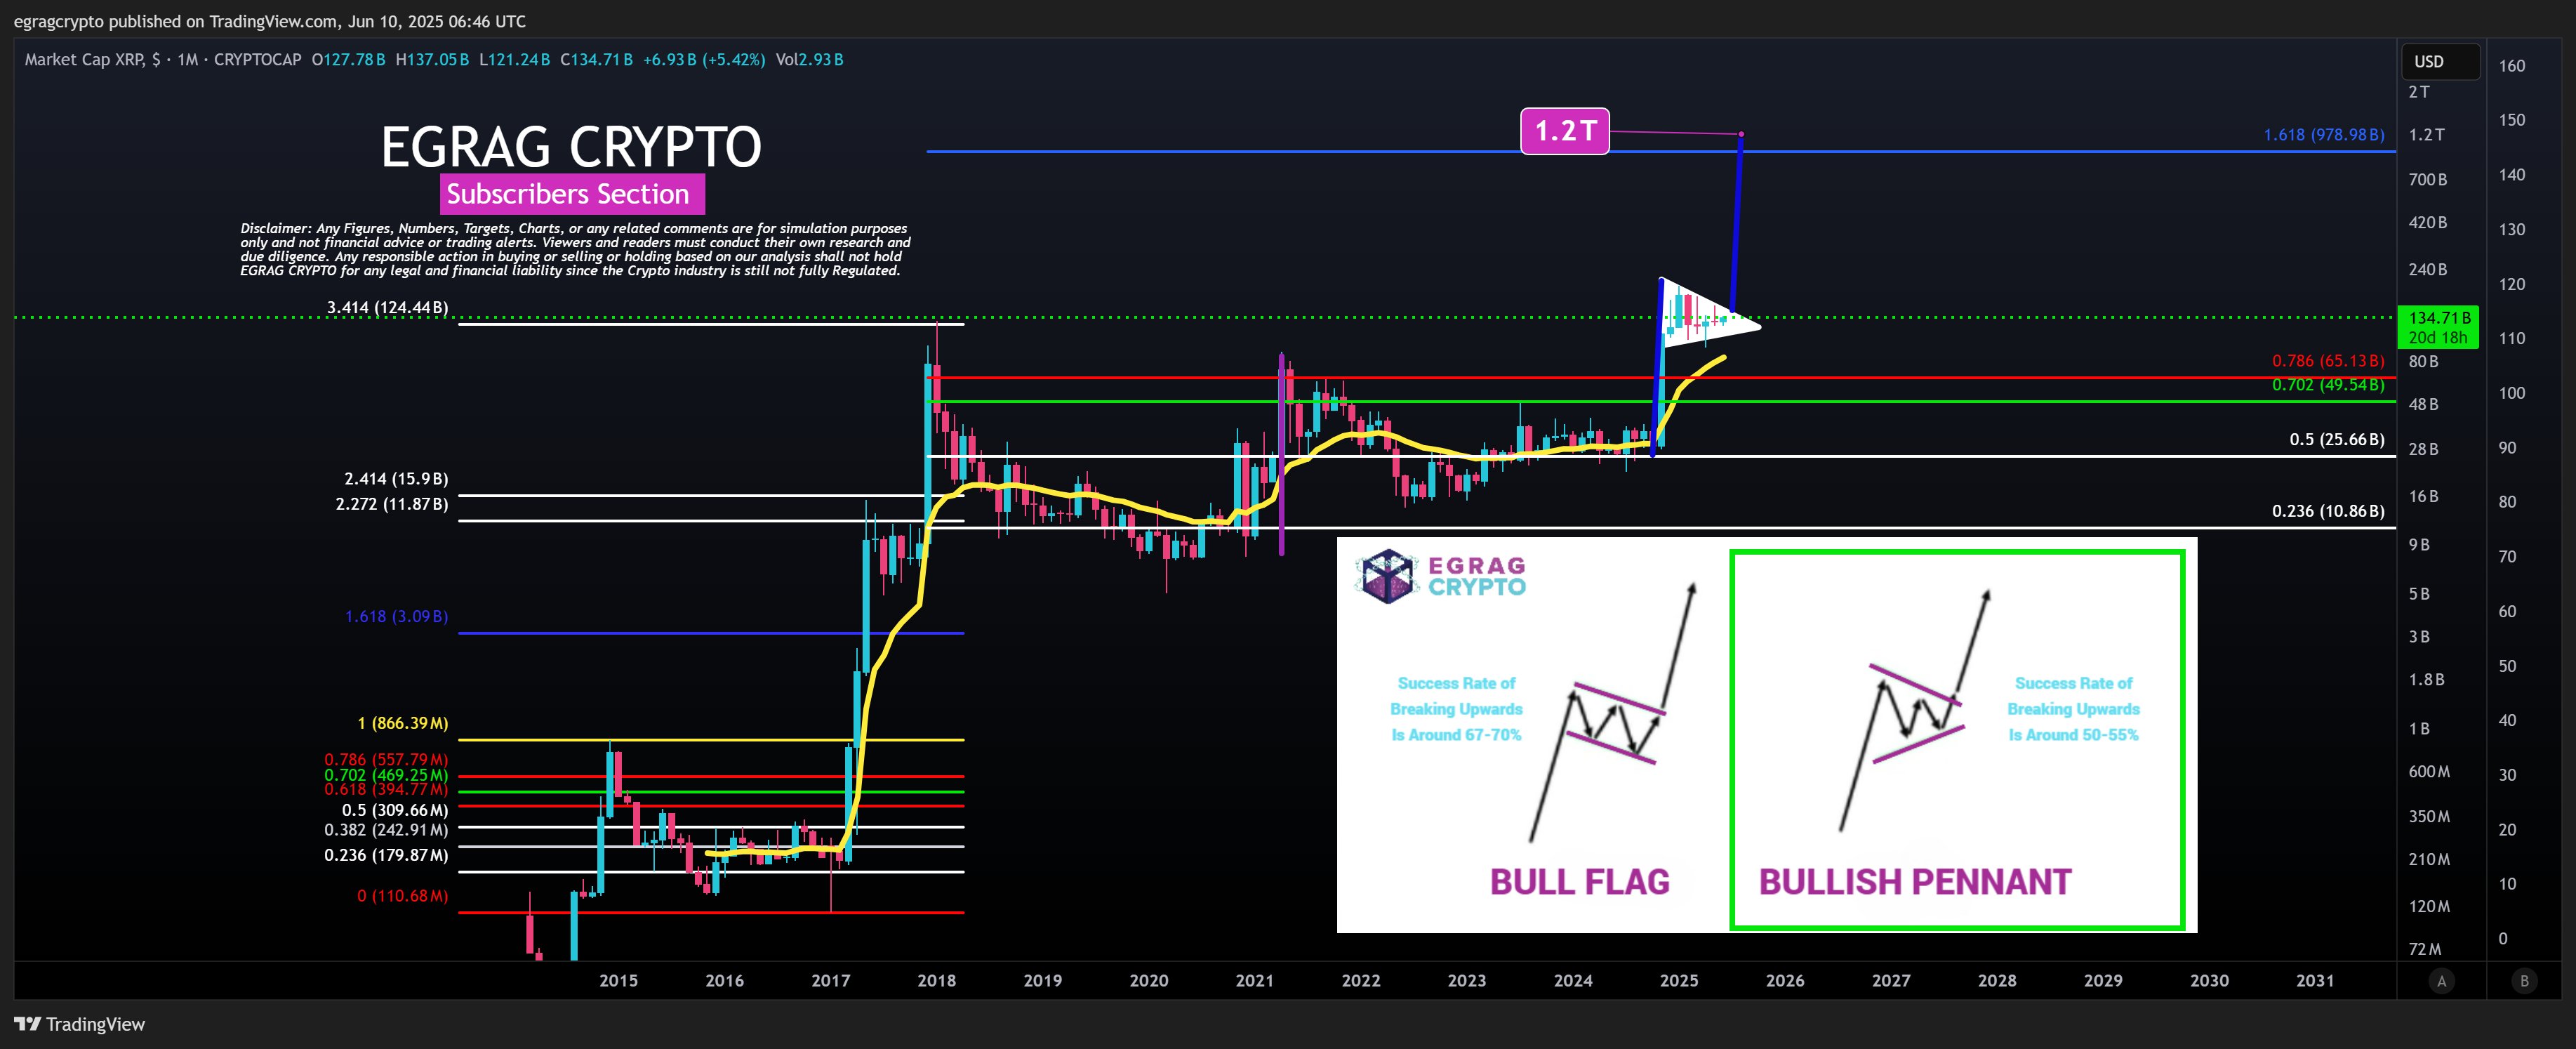
Lastly, EGRAG leveraged a bullish pennant from the XRP/USD and XRP/BTC pairs to present the fourth approach. This pennant aligns with the XRP market cap, with an upside target of $1.2 trillion. Interestingly, this $1.2 trillion translates to an XRP price of $20.
DisClamier: This content is informational and should not be considered financial advice. The views expressed in this article may include the author’s personal opinions and do not reflect The Crypto Basic opinion. Readers are encouraged to do thorough research before making any investment decisions. The Crypto Basic is not responsible for any financial losses.
The majority of the coins keep setting new local peaks, according to CoinStats.CoinStats”>
The price of Bitcoin ![]() BTCUSD has gone up by 0.78% over the last 24 hours.TradingView”>
BTCUSD has gone up by 0.78% over the last 24 hours.TradingView”>
On the hourly chart, the rate of BTC is near the local support of $108,507.
However, if the daily bar closes far from that mark, there is a possibility of witnessing a test of the $110,000 range by tomorrow.TradingView”>
On the longer time frame, bulls have failed to keep rising after yesterday’s bullish closure. Until the rate is below the $110,461 resistance, traders may witness a correction to the $108,000-$109,000 range.TradingView”>
From the midterm point of view, the price of the main coin is on its way to the all-time high. However, if the weekly bar closes with a long wick, bears may come back to the game, which can lead to a drop to the $107,000 mark.
Bitcoin is trading at $109,150 at press time.

 Price Prediction for June 12 2025")
