The main category of Crypto News.
You can use the search box below to find what you need.
[wd_asp id=1]
The main category of Crypto News.
You can use the search box below to find what you need.
[wd_asp id=1]
As of June 2, 2025, XRP is trading at $2.15, reflecting a recent dip from its January peak of $3.31.

The cryptocurrency has been oscillating within a narrow range of $2.15–$2.17, prompting analysts and investors to question whether a significant breakout is on the horizon or if the current consolidation phase will persist.
XRP’s price has experienced a 34% decline from its January high, underperforming compared to other major cryptocurrencies like Bitcoin and Solana. Despite this, some analysts view the current price point as a potential buying opportunity, citing XRP’s historical performance and potential for recovery.
Analyst EGRAG emphasizes the importance of a 3-day candle close above $2.30 to confirm a double bottom pattern, potentially igniting bullish momentum towards $3.00.
XRP’s immediate future hinges on its ability to break above the $2.30 resistance level.
A successful breakout could pave the way for a rally towards $2.50, then $3.00 and beyond.
However, failure to do so may result in continued consolidation or a potential decline towards support levels at $2.00 or $1.92.
Investors should monitor key technical levels and stay informed about regulatory developments, as these factors will play crucial roles in determining XRP’s trajectory in the coming weeks.
This content is brought to you by the FingerLakes1.com Team. Support our mission by visiting www.patreon.com/fl1 or learn how you send us your local content here.
Back on May 28, I said something that’s been echoing in my head these past few days:
“The liquidity sitting under current price? That’s another story. I wouldn’t be surprised if it gets taken in the coming days. In fact, I’m almost counting on it.”
Well, here we are.

The price dive deep and almost kissed the demand zone we had marked out like it remembered something down there. Not only that, but it’s now building more liquidity right near that same zone.
You know what that reminds me of? One of those scenes in a movie where the villain sets a trap, and the hero unknowingly walks right into it. Except in this case, we might just want the trap to trigger.
If I had it my way (and the market rarely cares), I’d love to see a strong, aggressive move downward — not a meltdown, just one of those manipulative jolts that scare everyone, sweep the liquidity below, and bounce right from the demand.

Something that triggers mass panic, wipes out stops, and shakes weak hands off the train.
Because think about it — how many retail traders placed their stop losses just under that recent structure?
How many breakout buyers would rage quit their longs if we dipped hard for an hour or two?
That’s where I believe smart money might load up — deep in fear territory.
If that bounce actually happens — if the demand zone holds with conviction — then 0.23 could be next on the list.

Why? Because that’s where a ton of people placed their stop losses. Think about it: price comes down, fakes the breakdown, then reverses sharply and runs right into all that buy-side liquidity above.
Classic.
And trust me, I’ve been on both sides of this play.
I’m not here to sell certainty.
The scenarios I lay out — they’re based on structure, liquidity, behavior. But markets are wild animals. You can tame them for a second, but they’ll turn on you in an instant.
So yes, this is a possible scenario — one that’s played out a thousand times before. But it’s not a guarantee. The market could easily break through demand and never look back.
Stay sharp. Manage risk. And don’t get married to any idea, no matter how good it feels in the moment.
XRP price has crashed in the past few months, moving from a high of $3.40 in January to $2.15 today. It has plunged by over 36% from its highest point this year, meaning that it remains in a deep bear market. It remains 445% above the lowest point last year. This article provides an XRP prediction for June.
Technical analysis is one of the best approaches to predict where a coin will move in a certain period. The daily chart indicates that the XRP price peaked at $3.40 earlier this year and subsequently declined to its current level of $2.15.
This decline occurred during a period when it should have been performing well. Bitcoin has just soared to a record high, while Ripple has had some notable catalysts. For example, the Securities and Exchange Commission (SEC) ended its lawsuit against Ripple, ending one of the worst crises in the last few years.
Ripple acquired Hidden Road in a notable deal that positions it as one of the top prime brokers in the cryptocurrency industry. Its stablecoin, Ripple USD (RLUSD) has continued growing, and is now valued at over $300 million.
Ripple Labs has inked several partnerships, including with companies like Zand Bank, Mamo, and WEIA.
This daily chart shows that the XRP price has remained under pressure in the past few months. It has plunged to $2.15 and has formed a symmetrical triangle pattern. This pattern is now nearing its confluence level, meaning that a big move is about to happen.
The coin has also formed a bullish pennant pattern, a popular bullish pattern. It has also remained above the 200-day Exponential Moving Average (EMA) and the 50% Fibonacci Retracement level.
Therefore, the XRP price is likely to experience a strong bullish breakout, with the next key point to watch being at $3.40, representing a 57% increase from the current level. A drop below the support at $1.6137, its lowest point on April 7, will invalidate the bullish view.

XRP will have several catalysts in June. The most notable catalyst will be the upcoming deadline for the Frankin Templeton XRP ETF on June 17. If approved, the SEC will likely also agree to other similar funds by companies like Grayscale, Bitwise, and VanEck. However, the most likely scenario is where the SEC delays the rollout.
Meanwhile, analysts are highly optimistic that Wall Street investors will welcome XRP ETFs. JPMorgan believes that these funds will receive over $8 billion in inflows in the first year.
Another potential catalyst for the XRP price could be a bid for Circle by Ripple Labs or Coinbase. While Circle is expected to go public, there is a likelihood that Ripple may swing in and place a bid as it seeks to grow its stablecoin business.
Further, any potential big partnerships or buyouts may also have an impact on the XRP price during the month.
READ MORE: XRP Price Prediction: Elliot Wave Points to $5 if Ripple Buys Circle
After stalling beneath key resistance levels for much of the previous week, the Ethereum price today has once again slipped into a corrective mode, triggering concerns of renewed downside. As of writing, Ethereum price is trading near $2,481, down over 2% in the last 24 hours. This drop comes after repeated failures to break above the $2,580–$2,600 supply zone, with price gradually compressing under a descending resistance trendline.
On the 4-hour chart, Ethereum price action has decisively broken below a short-term ascending support line, confirming bearish continuation within a broader consolidation pattern. Price has moved back into the $2,460–$2,500 demand region, a critical area where bulls have previously defended short-term downside. However, recent momentum suggests waning buyer strength.
Multiple breakdown attempts since May 30 have kept ETH capped under the $2,530–$2,550 intraday resistance zone, with trendline pressure pushing price into tighter ranges. The chart structure now resembles a descending triangle, a typically bearish continuation formation that could gain traction if the $2,470 support level gives way.
Momentum signals further confirm the cautious tone. On the 30-minute chart, RSI has dropped back near 33.29, suggesting Ethereum price volatility may expand if downside levels break. MACD histogram bars have turned red again, and the signal line crossover remains bearish, implying ongoing short-term selling pressure.
Meanwhile, the Stochastic RSI is oscillating in the lower bands, with a fresh bearish crossover below 20 on June 2—signaling that the asset is struggling to recover despite oversold conditions. If this pattern persists, ETH could continue to drift lower toward the $2,450 support zone, where historical bids have shown up in previous weeks.
The Ichimoku Cloud on the 30-minute timeframe reinforces the bearish narrative. Price remains beneath the cloud with the baseline and conversion lines aligned above spot levels, reflecting strong resistance near $2,510–$2,520. This confluence has repeatedly repelled upward attempts over the past three sessions.
Adding to this, the 4-hour chart shows Ethereum price is currently pinned below all major exponential moving averages, including the 20, 50, and 100 EMA clusters near $2,525–$2,538. These dynamic resistance bands continue to weigh on any bounce attempts, keeping sentiment in a defensive stance for now.
Bollinger Bands also show a gradual contraction, with price hugging the lower band—a signal that volatility could increase sharply, potentially toward the lower support region near $2,420 if bears gain momentum.
Zooming out to the weekly chart, the broader structure suggests that ETH remains trapped between the 0.382 and 0.5 Fibonacci levels, spanning $2,425–$2,745. This mid-Fibonacci compression is typically a battleground zone, and the inability to break through $2,745 (0.5 Fib) over the past few weeks signals broader consolidation.
A decisive breakout above the $2,580–$2,600 ceiling is needed to validate any renewed bullish breakout attempt. Until then, Ethereum price update remains range-bound, with a bearish tilt due to the descending triangle pressure and weakening momentum signals.
The question now is: Why is the Ethereum price going down today? The answer lies in the repeated rejection from dynamic resistance levels and fading momentum on multiple timeframes. Unless buyers can reclaim $2,530 with strong volume, the risk of further downside remains elevated.
In the near term, watch the $2,470–$2,450 zone closely. If this floor fails, ETH may quickly slide toward the $2,420–$2,400 support band. On the flip side, a bounce from current levels and a break above $2,530 could lead to a short-term relief push toward $2,580 and eventually $2,600.
| Timeframe | Support Levels | Resistance Levels | Indicators |
| 30-min chart | $2,450 / $2,420 | $2,510 / $2,530 | RSI near 33, MACD bearish, Stoch RSI weak |
| 4-hour chart | $2,460 / $2,400 | $2,537 / $2,562 | Price below EMA cluster and Bollinger base |
| Daily chart | $2,425 (Fib 0.382) | $2,745 (Fib 0.5) | Consolidation within Fib midrange zone |
The Ethereum price today is struggling to maintain bullish structure as multiple rejections from resistance zones continue to weigh on price. Until a clean break above $2,580 occurs, bears remain in control. For now, eyes remain on the $2,450–$2,470 zone, which may dictate the next major directional move in the days ahead.
Disclaimer: The information presented in this article is for informational and educational purposes only. The article does not constitute financial advice or advice of any kind. Coin Edition is not responsible for any losses incurred as a result of the utilization of content, products, or services mentioned. Readers are advised to exercise caution before taking any action related to the company.
Jakarta, Pintu News – Whale Alert, a well-known crypto tracking account, recently revealed on platform X that there have been three major transactions involving Dogecoin .
The total Dogecoin moved amounted to 312,375,048 DOGE, worth approximately $60 million. All three transactions were made in equal amounts.
Then, how is the current Dogecoin price movement?
On June 2, 2025, Dogecoin saw a slight dip in value, falling 0.95% over the past 24 hours to trade at $0.1904, or around IDR 3,115. Throughout the day, DOGE reached a high of IDR 3,205 and a low of IDR 3,089.
At the time of writing, Dogecoin’s market cap stands at around $28.57 billion, with trading volume dropping 18% to $944.83 million within 24 hours.
Read also: Ethereum Hits $2,400 Today (June 2) — Is a Major ETH Comeback on the Horizon?
According to Whale Alert’s observations, the coins were sent to Coinbase, one of the leading crypto exchanges, after previously being stored in an unknown wallet.
This kind of activity often attracts the attention of investors because it suggests that large owners – commonly called “whales” – are moving their Dogecoin.
The first transfer was reported at 20:40 WAT. Within the same hour, two other transfers of the same amount were also made. Each post from Whale Alert included a link to the details of the transaction.
Large movements to Coinbase like this could be a sign that someone is preparing to sell their Dogecoin assets.
This kind of whale movement is not unique to Dogecoin. Recent trends in the crypto ecosystem, such as massive institutional purchases of Bitcoin, show that large owners are actively shaping market dynamics.
After the massive transaction, the Dogecoin price showed changes. A chart from CoinMarketCap shows the DOGE price at $0.1939, which means a 3.43% drop in just one day.
The chart also shows that DOGE had previously touched a daily high of $0.2001 before dropping. As of May 31, the price seems to be retesting the $0.19 level.
For new investors, this means that the market is trying to keep the price above that number. If it fails to hold, the price could fall further. But if it does, there’s potential for it to rise again.
 as Major DOGE Deal Sends Shockwaves Through the Market!")
Read also: Top 3 Meme Coins that Crypto Investors Want in June 2025
Trading volume on May 31, 2025 was $1.73 billion, a sharp drop of 26.15%. This decrease shows that DOGE’s buying and selling activity was much lower than the previous day.
Technical indicators from TradingView provide important information regarding the price movement of Dogecoin (DOGE). Currently, the MACD indicator is showing negative values, signaling that selling pressure is still dominant.
Meanwhile, the RSI (Relative Strength Index) value stood at 32.97-a slight increase from the previous 28.58. This shows that Dogecoin has not yet entered the oversold zone significantly, but is starting to approach it. It is possible that the market will move in the opposite direction in the near future.
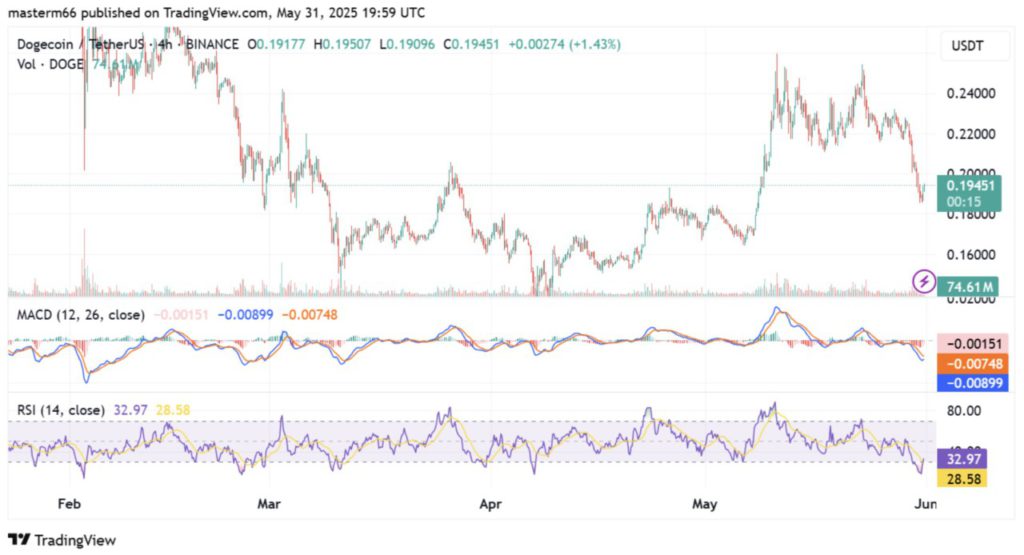
In the last trading session, DOGE had a small increase, but the overall trend still shows a downward movement. If the RSI starts to increase or the MACD starts to show green color, then there is a potential for a reversal.
The ADX (Average Directional Index) indicator stands at 43.14, which indicates a strong trend in the market. Many traders consider there to be a clear trend if the ADX surpasses 25. With the current ADX reading, there is a high probability that a significant price movement is imminent.
That’s the latest information about crypto. Follow us on Google News to stay up-to-date on the world of crypto and blockchain technology.
Enjoy an easy and secure crypto trading experience by downloading Pintu crypto app via Google Play Store or App Store now. Get a web trading experience with advanced trading tools such as pro charting, various types of order types, and portfolio tracker only at Pintu Pro. Pintu Pro Futures is also available, where you can buy bitcoin leverage, trade btc futures, eth futures and sol futures easily from your desktop!
*Disclaimer
This content aims to enrich readers’ information. Pintu collects this information from various relevant sources and is not influenced by outside parties. Note that an asset’s past performance does not determine its projected future performance. Crypto trading activities have high risk and volatility, always do your own research and use cold cash before investing. All activities of buying and selling bitcoin and other crypto asset investments are the responsibility of the reader.
Reference:
A Bitcoin maximalist and Chartered Financial Analyst insists XRP will not move past a two-digit price even if Bitcoin claims $100 million.
Notably, XRP has drawn a lot of attention recently, with multiple bold predictions about its future price. Proponents point to its growing use in cross-border payments, arguing that better regulations and more institutional interest could give it a strong push.
One of the most talked-about forecasts comes from analyst BarriC, who believes XRP could hit $100. However, in April, CryptoGuard’s Chief Operating Officer Matthew Brienen took things further, predicting that XRP could rise to $1,000.
While investors question how this price could materialize, market commentator John Squire is already predicting an even higher price. He suggested months back that a $10,000 price for XRP was not just possible, but actually conservative.
However, not everyone agrees. Rajat Soni, a Chartered Financial Analyst and outspoken Bitcoin supporter, sees these predictions as completely unrealistic. In his recent analysis, he pushed back, calling the idea of a $10,000 XRP flat-out nonsense.
In presenting his reason, he pointed out that XRP has a total supply of 100 billion coins, while Bitcoin’s top supply is 21 million. He also noted that Bitcoin can be broken down into 2.1 quadrillion satoshis. By that math, each XRP would represent 21,000 satoshis.
At the time of his disclosure, XRP traded at $2.20, while 21,000 satoshis cost about $22. Based on this, Soni argued that Bitcoin holds at least 1,000 times more value than XRP.
Using this comparison, he predicted that XRP would lose about 99.9% of its value compared to Bitcoin in the future. If Bitcoin ever reaches $100 million, making one satoshi equal to $1, then 1 XRP would be worth no more than $20.
Soni added that such a jump in Bitcoin’s price would mean the U.S. dollar had lost more than 95% of its value. In today’s terms, he said, 1 Bitcoin would be worth around $5 million, and 21,000 satoshis would equal about $1,050. That would put XRP’s value at just $1 when adjusted for inflation.
While predictions of XRP hitting $1,000 or $10,000 seem far-fetched, Soni’s take also leans to the extreme. His claim that XRP could lose almost all of its value against Bitcoin does not line up with recent trends.
Currently, XRP trades at $2.16, while Bitcoin sits at $105,174. This puts the XRP-to-Bitcoin ratio at 0.00002053. If XRP reaches $22 when Bitcoin hits $100 million, the ratio would fall to 0.00000020. That would be a 99% drop in value compared to Bitcoin.
However, this outcome seems unlikely, especially since XRP has continued to outperform Bitcoin over the past few months, gaining 183% against the crypto firstborn since November 2024.
Meanwhile, if Bitcoin ever does reach $100 million, its market cap would jump to nearly $1.987 quadrillion. Interestingly, should it retain its current market dominance of 64.58%, the total crypto market cap would hit $3.076 quadrillion.
Notably, should XRP also maintain its 3.94% market share under those conditions, its market cap would rise to $121.194 trillion. That would bring XRP’s price to about $1,244.
So, while it’s technically possible for XRP to hit $1,244 if Bitcoin skyrockets and the market stays exactly as it is now, this is still a long shot. The global economy doesn’t have nearly enough money in circulation to support those values right now, especially at a $100 million Bitcoin price.
DisClamier: This content is informational and should not be considered financial advice. The views expressed in this article may include the author’s personal opinions and do not reflect The Crypto Basic opinion. Readers are encouraged to do thorough research before making any investment decisions. The Crypto Basic is not responsible for any financial losses.
XRP price predictions from AI chatbots Grok, ChatGPT, and Google Gemini indicate whether an average salary earner can afford 10,000 XRP by 2030.
With the broader crypto market witnessing massive growth, so do the prospects of some investors getting priced out. An asset that has recently joined this uptrend is XRP, which has seen a significant uptick in price and interest since November 2024.
With its value currently standing at $2.16, the cost of purchasing 10,000 XRP sits at $21,600. Notably, for someone earning an average annual salary of $48,000 in gross income, this amount is still within reach, just enough to make such a purchase twice over, assuming no deductions for living expenses.
However, if XRP continues its upward trajectory, such affordability could become a thing of the past. For context, back in November 2024, XRP was trading for just $0.50, meaning that the same $48,000 annual salary would have enabled an investor to buy 10,000 XRP not just twice, but nine times over.
This massive change shows how the token’s growth could effectively price the average investor out. Notably, this leads to an important question: how long will such average income earners be able to accumulate XRP at scale?
To answer this, we contacted multiple AI chatbots and crypto platforms to obtain hypothetical bullish predictions for XRP’s price by 2030. The goal was to assess how much 10,000 XRP might cost five years from now and whether an average salary earner could still afford such an investment.
Notably, Google’s AI model, Gemini, presented a bullish projection of $15 for XRP by 2030. It based this forecast on several potential developments, including greater institutional adoption of Ripple’s payment solutions, regulatory improvements, and expanding use cases for the XRP Ledger.

If XRP hits this $15 mark, 10,000 XRP would cost $150,000. Clearly, this is over three times the $48,000 salary benchmark, making it financially impossible for someone on such an income to afford that quantity of XRP without supplemental capital or multiple years of savings.
Meanwhile, OpenAI’s ChatGPT projected a slightly less bullish estimate of $12 by 2030. According to the chatbot, this figure is due to XRP’s potential to establish itself in the global financial infrastructure, especially if Ripple’s cross-border technology gains institutional traction and regulatory hurdles are reduced.

At this rate, 10,000 XRP would be worth $120,000. Again, this would place the tokens well beyond the reach of someone earning $48,000 a year, barring any extraordinary financial planning or asset appreciation elsewhere.
Grok, the AI platform from xAI, presented the least bullish prediction, estimating a 2030 price of $5.50 for XRP. This price point comes from expectations of steady institutional adoption, a favorable regulatory environment, and consistent technological growth.

If Grok’s projection materializes, 10,000 XRP will amount to $55,000. While this is slightly more than the average annual income of $48,000, it’s not too far out of reach, especially for dedicated savers or those willing to make partial purchases over time.
On the other hand, some crypto analysis platforms went further with their bullish forecasts. Experts at Changelly believe XRP could reach a minimum price of $20.79 by the end of 2030.

At that rate, 10,000 XRP would cost over $207,900, making such an acquisition virtually impossible for an average earner within a single year.
However, analysts at Telegaon are even more optimistic, predicting a minimum XRP price of $36.80 by 2030. This would drive the cost of 10,000 XRP to a whopping $368,000, more than seven times the average gross annual income under review.

From this trend, there is the potential for average retail investors to be priced out of major crypto assets like XRP if current growth trajectories continue.
Analysts like Edoardo Farina are already voicing warnings about such a scenario. Amid the gradual price uptick, these commentators advocate for an accumulation strategy now, while tokens like XRP remain relatively affordable.
DisClamier: This content is informational and should not be considered financial advice. The views expressed in this article may include the author’s personal opinions and do not reflect The Crypto Basic opinion. Readers are encouraged to do thorough research before making any investment decisions. The Crypto Basic is not responsible for any financial losses.
In the last article, I shared a short-term opportunity for the scalpers and intra-day warriors.
We were eyeing the 5-minute chart, watching Solana react off a juicy little demand zone — the kind that just feels right when you’re watching the candles form.
Price had left clear liquidity above, and it looked like we were early to something good.
Well, turns out we were a little too early.
So what happened?
Solana dropped just enough to trigger our stop losses, only to reverse and go grab all the liquidity above — exactly like we thought it might.

Now, I know what you’re thinking: “Couldn’t we have avoided that?” Maybe.
Technically, yes — the true invalidation was actually below the lowest low, since that’s the lower low that led to the new higher high. That’s what makes it structurally valid.
But for risk-reward reasons, I chose a tighter stop.
You’ve been there, right? That balancing act between conviction and discipline. Sometimes tighter stops work beautifully. Sometimes they get hunted before the move even breathes. That was the case here.
Now let’s zoom out and take a breath.
On the 30-minute chart, the structure is much cleaner. We’re in a clear bullish range. And here’s where it gets spicy — price has left a big chunk of liquidity sitting above. Y
ou know what that usually means: it’s going to attract price like a magnet.
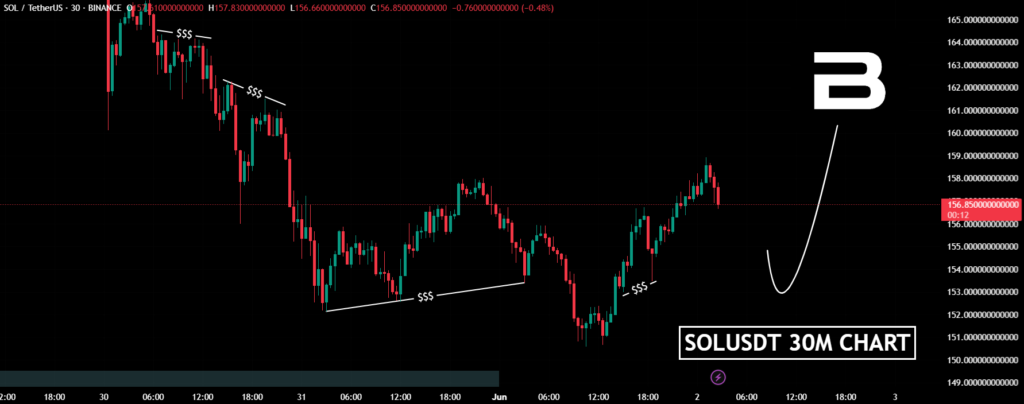
But before we get there?
I wouldn’t be surprised if Solana dips lower first, just enough to tap into the liquidity resting below current price. A little fakeout — the kind that makes everyone go “oh no, it’s dumping,” right before it reverses and rockets upward.
This happened to me back in 2023 on another altcoin setup — exact same vibe. Everyone panic-sold, I hesitated, and then boom… +30% in 12 hours. I still think about that one.
I’ll never pretend to predict the market with 100% certainty. That’s just not how this works. The structures I’m laying out? They’re scenarios, not promises.
The market has a mind of its own. One minute it’s behaving like a textbook — the next, it’s punking every trader on the planet.
But this is what makes it so addictive, right?
So — watch the levels. Understand the liquidity map. And don’t marry any bias. If Solana does what we’ve mapped, great. If it doesn’t, we adapt. That’s the game.
For readers exploring new exchanges, WEEX is currently offering early users a chance to claim up to 100 USDT just for signing up and verifying — no strings attached.

As of 8:54 p.m. ET on June 1, 2025, XRP is trading at approximately $2.18, marking a significant 34% decline from its January peak of $3.31.
This downturn has raised concerns among investors, especially as XRP underperforms compared to Bitcoin and Solana, both of which have shown stronger resilience in the current market.
Despite the recent dip, several analysts believe that XRP’s current price point could present a buying opportunity.
The cryptocurrency has experienced a 255% surge from November 2024 to January 2025, outpacing major cryptocurrencies like Bitcoin and Ethereum during that period.
This historical performance suggests potential for recovery, especially if market conditions become favorable.
Several key factors are currently influencing XRP’s market trajectory:
XRP is currently facing resistance around the $2.25 mark. A decisive move above this level could signal a bullish trend, potentially targeting the $2.50 to $3.00 range.
Conversely, failure to break this resistance may lead to a retest of the $2.00 support level.
Looking ahead, several scenarios could unfold:
While XRP’s recent decline is notable, the cryptocurrency’s underlying fundamentals and potential catalysts suggest that this dip could be temporary.
Investors should monitor key developments, such as ETF approvals and regulatory changes, to assess XRP’s future trajectory.
This content is brought to you by the FingerLakes1.com Team. Support our mission by visiting www.patreon.com/fl1 or learn how you send us your local content here.
The last day of the week has turned out to be bearish for the majority of the coins, according to CoinMarketCap.CoinMarketCap”>
Bitcoin ![]() BTCUSD is the exception, rising by 0.15% since yesterday. Over the last week, it has fallen by 2.82%.TradingView”>
BTCUSD is the exception, rising by 0.15% since yesterday. Over the last week, it has fallen by 2.82%.TradingView”>
On the hourly chart, the rate of BTC is rising after setting local support at $103,832. If the growth continues, one can expect a test of the resistance by tomorrow.TradingView”>
On the bigger time frame, the price of the chief crypto is within yesterday’s bar.
The volume is low, which means traders are unlikely to witness sharp moves on the first days of June.TradingView”>
From the midterm point of view, sellers are trying to seize the initiative. As the rate of BTC is far from the current prices, one should focus on the interim level of $102,126. If a breakout happens, the fall may lead to a test of the $100,000 zone soon.
Bitcoin is trading at $104,291 at press time.
 Price Prediction for 3rd June 2025")
