The main category of Crypto News.
You can use the search box below to find what you need.
[wd_asp id=1]
The main category of Crypto News.
You can use the search box below to find what you need.
[wd_asp id=1]
Ripple (XRP) has been trading in a narrow range between $2.65 and $2.27 for nearly three weeks, with a bias toward the support level. The short-term technical outlook suggests that the current market value of $2.28 on Wednesday could pave the way for extended losses. The doldrums may continue into the weekend, ahead of the release of the Federal Reserve’s (Fed) May meeting minutes later on Wednesday and the Personal Consumption Expenditure (PCE) Price Index inflation data on Friday.
Beyond the range support, trader interest could shift to the demand zone at $2.07 as bulls seek liquidity to make make another attempt at recovery.
The United States Securities and Exchange Commission (SEC) has announced that the next conference on digital assets and tokenization will be held on June 5. According to a press release, the conference, hosted by the Commission’s Division of Investment Management, will bring together various asset managers in the industry, regulators and academics.
Key topics likely to take center stage include digital assets and tokenization, product proliferation and innovation, as well as access to private markets. SEC Commissioner Hester Peirce and Investment Management Division Director Natasha Vij Greiner will be among the panelists present.
Meanwhile, Ripple’s Chief Legal Officer, Stuart Alderoty, said on X that the company has submitted a letter to the SEC’s Crypto Task Force, addressing a pivotal question from “Commissioner Peirce’s ‘New Paradigm’ speech: When does a digital asset separate from an investment contract?”
According to Ripple, which reiterated an analysis by Lewis Cohen, “there is no current basis in the law relating to ‘investment contracts’ to classify most fungible crypto assets as ‘securities’ when transferred in secondary transactions because an investment contract transaction is generally not present and these assets neither create nor represent the necessary cognizable legal relationship between an identifiable legal entity on the one hand and the owner of the crypto asset on the other that is the hallmark of a security.”
Still, Ripple insists in the letter that there is a gap in existing laws corresponding to securities offerings, urging guidance from the SEC by establishing a clear regulatory framework. Such a step could reduce enforcement risk and provide clear compliance guidelines, especially during the early stages of network development.
Ripple’s letter adds that the framework should seek to offer clarity where uncertainty exists rather than “blur boundaries that are already settled.”
XRP’s price is attempting to establish support at the 100-day Exponential Moving Average (EMA), currently positioned at around $2.27, after slipping slightly below the 50-day EMA at approximately $2.29.
Based on the daily chart below, the path with the least resistance is downward. A sell signal from the Moving Average Convergence Divergence (MACD) indicator could encourage traders to reduce exposure to XRP, especially with sell-side pressure rising.
The signal occurred when the blue MACD line crossed beneath the red signal line on May 20. Green histogram bars expanding below the mean line (0.00) signal bearish momentum.
The Relative Strength Index (RSI) downtrend, which is now below the 50 midline, reflects XRP’s intensifying bearish momentum. Should the RSI slide further down into the oversold region, XRP could fall under the 100-day EMA at $2.27, consequently validating a bear flag pattern currently projecting a 55% move to $1.00. This target is determined by measuring the flagpole and extrapolating half the distance below the breakout point.
XRP/USDT daily chart
Beyond the 100-day EMA at $2.27, key areas of interest, especially for traders watching for dips, include the 200-day EMA support at $2.07, the April 7 low at $1.61, and the bear flag breakout target at $1.00.
However, traders should consider the dynamic support offered by the SuperTrend indicator at $2.17. This is a trend-following tool that combines price and volume data to gauge volatility.
A buy signal is triggered when the XRP price crosses above the SuperTrend line, with the indicator’s color changing from red to green. Targets on the upside lie at $2.65, where the XRP price was rejected on May 12, and at $3.00, a psychological resistance level.
Bullish Ethereum price predictions are emerging now that ETH is trading right above the $2,500 psychological support zone.
Solana’s price is also on the rise, with a notable 18.7% uptick in the last month, signaling a bullish comeback that some traders believe could see SOL return to prices above $200.
Then there is Cardano’s ADA, whose price has surged on the backdrop of Cardano’s expansion of its DeFi infrastructure. Could this be the start of the altcoin season?
Ethereum has had a bullish month, with its price rising over 40% in 30 days despite a sharp 33% downturn on its year-to-date chart.
In some weeks, Ethereum’s price surged by up to 50%, signaling the start of a bullish resurgence as onlookers set bullish Ethereum price predictions.
Ethereum’s price has managed to pierce through a critical resistance layer at the $2,300 price mark as ETH rallied to settle at its current price of $2,561.
Expert analysts opine that with Ethereum trading below the MA50, a revisit to its previously formed bearish engulfing could see it retrace back to $2,100 before a second leg up, which confirms the start of altcoin season.
Once known as the blockchain for launching meme coins, Solana is now fostering the growth of its DeFi, gaming, and compliance market with the launch of its Attestation Service.
Solana’s price continues to climb steadily, with a notable rebound above the $169 support zone. SOL’s price movements have formed multiple triangle patterns, putting SOL in a consolidation zone with the next resistance area at $188.
If SOL continues to attract increased whale activity, an uptick past $200 could materialize as SOL reclaims its ATH.
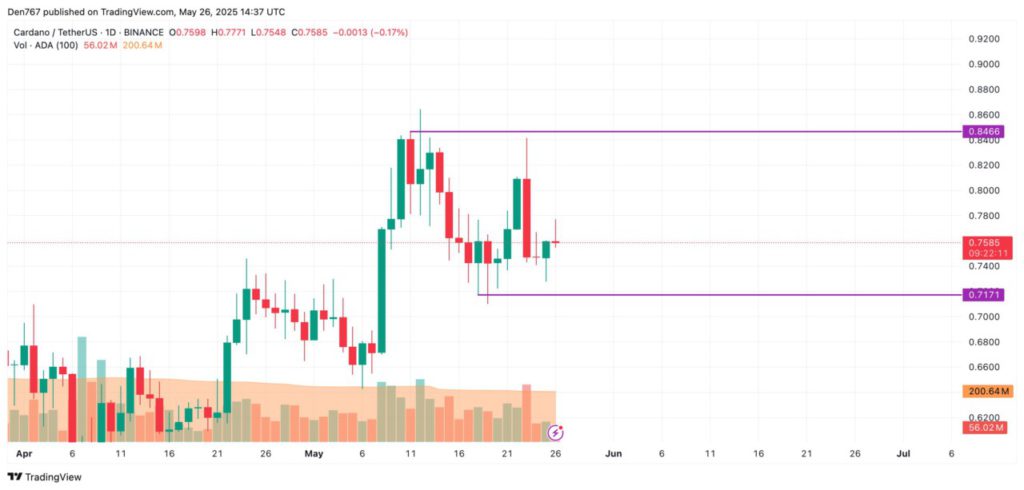
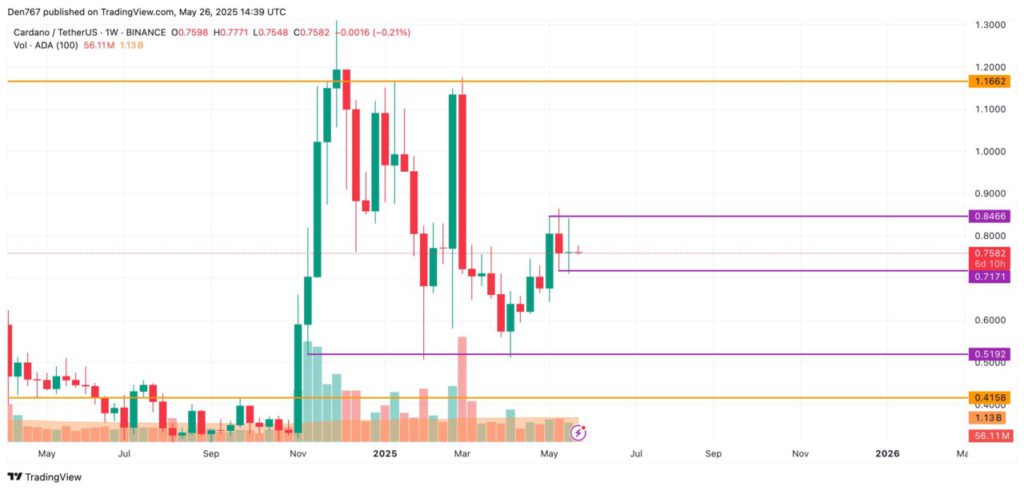
After a devastating 7% pullback in the last two weeks, ADA is recovering nicely in a move to continue its year-to-date uptick streak of 66%. ADA is now changing hands at $0.765, but analysts are anticipating a regrouping of the bulls as ADA’s frequency of pullbacks shrinks.
If ADA’s price closes above the $0.80 mark in a decisive move that confirms ADA’s compliance with a rising trendline, onlookers forecast a continuation of the uptick, putting ADA at a price well above $1.
While bullish Ethereum price predictions emerge and Solana’s price and ADA prepare to take off this altcoin season, a newcomer in the cross-border payments is shaking up the market. Introducing Remittix’s RTX, a PayFi token on a mission to reinvent cross-border payments.
Remittix is built on simplicity and easy access. Its protocol enables crypto holders to send funds from their wallets to a recipient’s bank account across 30+ fiat currencies. Remittix obscures the complexities of crypto wallets while making every transaction affordable. There is also a PayAPI for merchants looking to accept crypto payments.
With a presale that has sold over 539 million RTX tokens for a total of 1.5 billion, analysts anticipate an uptick for RTX upon launch, making it a leader in remittances.
Discover the future of PayFi with Remittix by checking out their presale here:
Website: https://remittix.io/
Socials: https://linktr.ee/remittix
The Ethereum price today is trading near $2,630 after failing to sustain above short-term resistance at $2,700. Despite recent upside momentum, Ethereum price action is now showing signs of exhaustion, with multiple indicators flashing early warning signals of a pullback or consolidation phase.
After a clean breakout from the descending wedge formation earlier this month, the Ethereum price rallied sharply from the $2,420 support zone, briefly tagging the $2,698 region. This surge aligned with broader altcoin strength and Bitcoin’s own rally past $110K. However, the bulls are now facing difficulty maintaining momentum as ETH trades back below its immediate resistance line.
On the 4-hour chart, Ethereum has failed to hold above the upper Bollinger Band and is now retracing toward the midline around $2,580. The 20 and 50 EMA levels at $2,602 and $2,569 are key pivot zones to watch, with a sustained close below these levels likely opening downside risks toward the $2,500 psychological support.
Momentum indicators are starting to turn cautious. The Relative Strength Index (RSI) on the 30-minute and 4-hour timeframes has cooled from overbought zones and now reads near 42, signaling weakening bullish strength. The MACD has printed a bearish crossover with widening histogram bars below the baseline, adding to the cautious tone.
Further, the Chande Momentum Oscillator has slipped to 13.42, down significantly from last week’s readings above 60, indicating that upward price strength is fading. With this alignment across short-term indicators, a period of sideways or downward movement appears increasingly probable.
The question is: why is the Ethereum price going down today despite the recent bullish structure? The answer lies in multiple layers of technical exhaustion and lower timeframe rejection zones.
Firstly, Ethereum’s inability to hold above $2,698 coincides with the 0.5 Fibonacci level (from November highs to March lows), acting as a natural resistance zone. Secondly, the bearish divergence between price and momentum oscillators (MACD and RSI) indicates that the rally lacked sufficient strength for continuation.
Lastly, on the Ichimoku chart, ETH has dipped back into the Kumo cloud, suggesting indecision and potential chop. If the price fails to reclaim $2,664 in the near term, downside risk toward $2,575 and even $2,476 cannot be ruled out.
Despite this short-term pullback, Ethereum’s broader structure remains bullish. On the daily chart, ETH continues to trade well above its 100-day EMA ($2,485) and the major ascending trendline. The higher low structure remains intact, and bulls are likely to re-enter around the $2,575–$2,500 zone, which has repeatedly acted as a demand region.
Furthermore, the weekly chart shows ETH stabilizing above the 0.382 Fibonacci retracement at $2,424, keeping the door open for a potential retest of $2,745 if current support levels hold. However, price volatility is expected to remain elevated ahead of U.S. macro data later this week, which may affect the broader crypto sentiment.
Heading into May 29, ETH must defend the $2,575–$2,600 cluster to avoid deeper pullbacks. A clean break above $2,664 could re-open upside potential toward $2,745 and possibly $2,800 if momentum returns. On the downside, a sustained close below $2,475 could invite pressure toward the $2,420 and $2,315 support zones.
Ethereum Technical Forecast Table – May 29
| Indicator | acSignal | Level/Range |
| Ethereum price today | Neutral–Bearish | $2,630 |
| RSI (14) | Cooling | 42.54 |
| MACD | Bearish Crossover | -2.16 (Signal < MACD) |
| Bollinger Bands | Mean Reversion | Mid-band $2,579 |
| 20/50 EMA | Neutral | $2,602 / $2,569 |
| Ichimoku Cloud | In Cloud | $2,632 (Kumo base) |
| Chande Momentum | Weakening | 13.42 |
| Key Resistance | Sell Pressure Zone | $2,664 / $2,698 |
| Key Support | Demand Zone | $2,575 / $2,476 |
Ethereum remains in a structurally bullish position over the medium term, but Ethereum price volatility is expected to stay high as bulls and bears battle for control near $2,600. With multiple timeframes suggesting temporary weakness, traders should watch for confirmation at key EMA and Fibonacci support zones before positioning for the next major move.
Disclaimer: The information presented in this article is for informational and educational purposes only. The article does not constitute financial advice or advice of any kind. Coin Edition is not responsible for any losses incurred as a result of the utilization of content, products, or services mentioned. Readers are advised to exercise caution before taking any action related to the company.
Jakarta, Pintu News – Dogecoin continues to be under pressure in the crypto market, remaining in the red due to heavy selling pressure. However, there are interesting dynamics happening behind the scenes that point to a potential significant change in direction.
Dogecoin (DOGE) is currently in a critical phase, where its exchange rate continues to decline. Despite this, Open Interest has remained steady between $2.65 billion and $3.70 billion, indicating that liquidity is still holding out in the market. This phase is often regarded as the time when smart investors start preparing for the next big move.
Also Read: Whale’s Big Sale of SAND, Will Prices Plummet as Early as June 2025?
According to analysis from AMBCrypto, Dogecoin (DOGE)’s consolidation during this period of market uncertainty is a structural bullish signal. Unlike the other major crypto assets that experienced a decline, Dogecoin (DOGE) managed to maintain its range. In this highly volatile market, only assets with strong support can survive.
Despite price fluctuations, Open Interest for Dogecoin (DOGE) remains strong, with the dominance of long positions reaching over 75.6% on the DOGE/USDT perpetual contract on Binance. This shows a clear bullish tendency among traders.
 Rise? Last Chance Amidst Market Pressure!")
Over the past 24 hours, long positions have come under immense pressure, with 72% of leverage-driven liquidations coming from long positions. However, traders continue to accumulate long positions, which suggests that they may be following the strategy of smart investors. This situation leaves Dogecoin (DOGE) stuck in a limited price movement, where selling pressure and low FOMO keep it stable within a certain range.
However, if the support from savvy investors continues, it is possible that Dogecoin (DOGE) will experience a sudden surge in price. Conversely, with the buildup of liquidity in derivatives, there is a risk of a big drop that could drag the Dogecoin (DOGE) price below its psychological floor of $0.20.
With stressful market conditions and complex internal dynamics, the future of Dogecoin (DOGE) depends on the ability of savvy investors to maintain current price support. If they succeed, we may witness a spectacular Dogecoin (DOGE) revival. However, if they don’t, Dogecoin (DOGE) may face even tougher challenges.
Also Read: BNB Nearing $700 Again – Time to Buy or Wait?
That’s the latest information about crypto. Follow us on Google News for the latest crypto and blockchain technology updates. Enjoy an easy and secure crypto trading experience by downloading Pintu crypto app via Google Play Store or App Store now.
Experience web trading with advanced trading tools such as pro charting, various order types, and portfolio tracker only at Pintu Pro. Pintu Pro Futures is also available, where you can buy bitcoin leverage, trade btc futures, eth futures and sol futures easily from your desktop!
*Disclaimer
This content aims to enrich readers’ information. Pintu collects this information from various relevant sources and is not influenced by outside parties. Note that an asset’s past performance does not determine its projected future performance. Crypto trading activities are subject to high risk and volatility, always do your own research and use cold hard cash before investing. All activities of buying andselling Bitcoin and other crypto asset investments are the responsibility of the reader.
Jakarta, Pintu News – The cryptocurrency market is always full of unexpected dynamics. Cardano , one of the popular digital assets among investors, has recently shown interesting price movements. This article will take a deeper look at Cardano (ADA)’s recent price trends and what might happen in the near future.
In the last 24 hours, Cardano (ADA) has increased by 1.35%. However, on the hourly chart, the price of ADA is showing a decline after failing to break the resistance at $0.7754. If the daily close is near or below the support, there is a chance that the price will try to reach the $0.75 range in the near future. This suggests that there is uncertainty in the market that might affect traders’ decisions.
Also Read: Crazy Transaction! 11.75 Trillion PEPE Changed Hands in 24 Hours, What Happened?
 Price Prediction for End of May 2025: Will ADA Continue to Fall?")
On the larger time frame, the candlestick almost closed bearishly. If the bulls are unable to seize the initiative, there is a possibility that the price will reach the $0.74 area the following day. This situation suggests that selling pressure may be building, and investors should be wary of a potential further decline. This analysis is important to understand the current market momentum and anticipate further price movements.
From a medium-term point of view, it is still too early to make far-reaching predictions. The low trading volume suggests that there is no clear dominance of buyers or sellers, leading to sideways trading around the current price. This condition could continue until there is a significant change in market sentiment or external factors affecting the cryptocurrency industry as a whole.
Given the current market conditions and the technical analysis that has been presented, Cardano (ADA) investors need to consider various possible scenarios. Closely observing price movements and trading volumes will be key to making the right investment decisions in the future. It is always important to do your own research or consult a financial expert before making any investment decisions.
Also Read: Monero (XMR) Surprises Market with Spectacular Rise in May 2025, How Come?
That’s the latest information about crypto. Follow us on Google News for the latest crypto and blockchain technology updates. Enjoy an easy and secure crypto trading experience by downloading Pintu crypto app via Google Play Store or App Store now.
Experience web trading with advanced trading tools such as pro charting, various order types, and portfolio tracker only at Pintu Pro. Pintu Pro Futures is also available, where you can buy bitcoin leverage, trade btc futures, eth futures and sol futures easily from your desktop!
*Disclaimer
This content aims to enrich readers’ information. Pintu collects this information from various relevant sources and is not influenced by outside parties. Note that an asset’s past performance does not determine its projected future performance. Crypto trading activities are subject to high risk and volatility, always do your own research and use cold hard cash before investing. All activities of buying andselling Bitcoin and other crypto asset investments are the responsibility of the reader.
Crypto analyst EGRAG believes the XRP market cap is on the cusp of a major breakout that could push its market cap as high as $1.5 trillion.
In his latest update, he called attention to the reasoning behind this bold prediction. Notably, EGRAG pointed to a technical chart pattern and previous price cycles that suggest XRP might be on the edge of a massive move.
Back in November 2023, he identified a “W” formation for the XRP market cap chart on the 2-month timeframe. This pattern, which some regard as a double-bottom structure, often indicates a shift from bearish to bullish momentum.
Data from EGRAG’s chart shows the first half of the pattern formed when XRP’s market cap dropped from $128 billion in January 2018 to the first bottom of $5 billion in March 2020 and then bounced back up to $89 billion in April 2021.
Meanwhile, the second leg materialized when the market cap dipped from the $89 billion high to a second bottom of $13.88 billion by June 2022 and then rallied again to $195 billion in January 2025. While EGRAG highlighted the developing pattern in November 2023, it formed fully in January 2025.
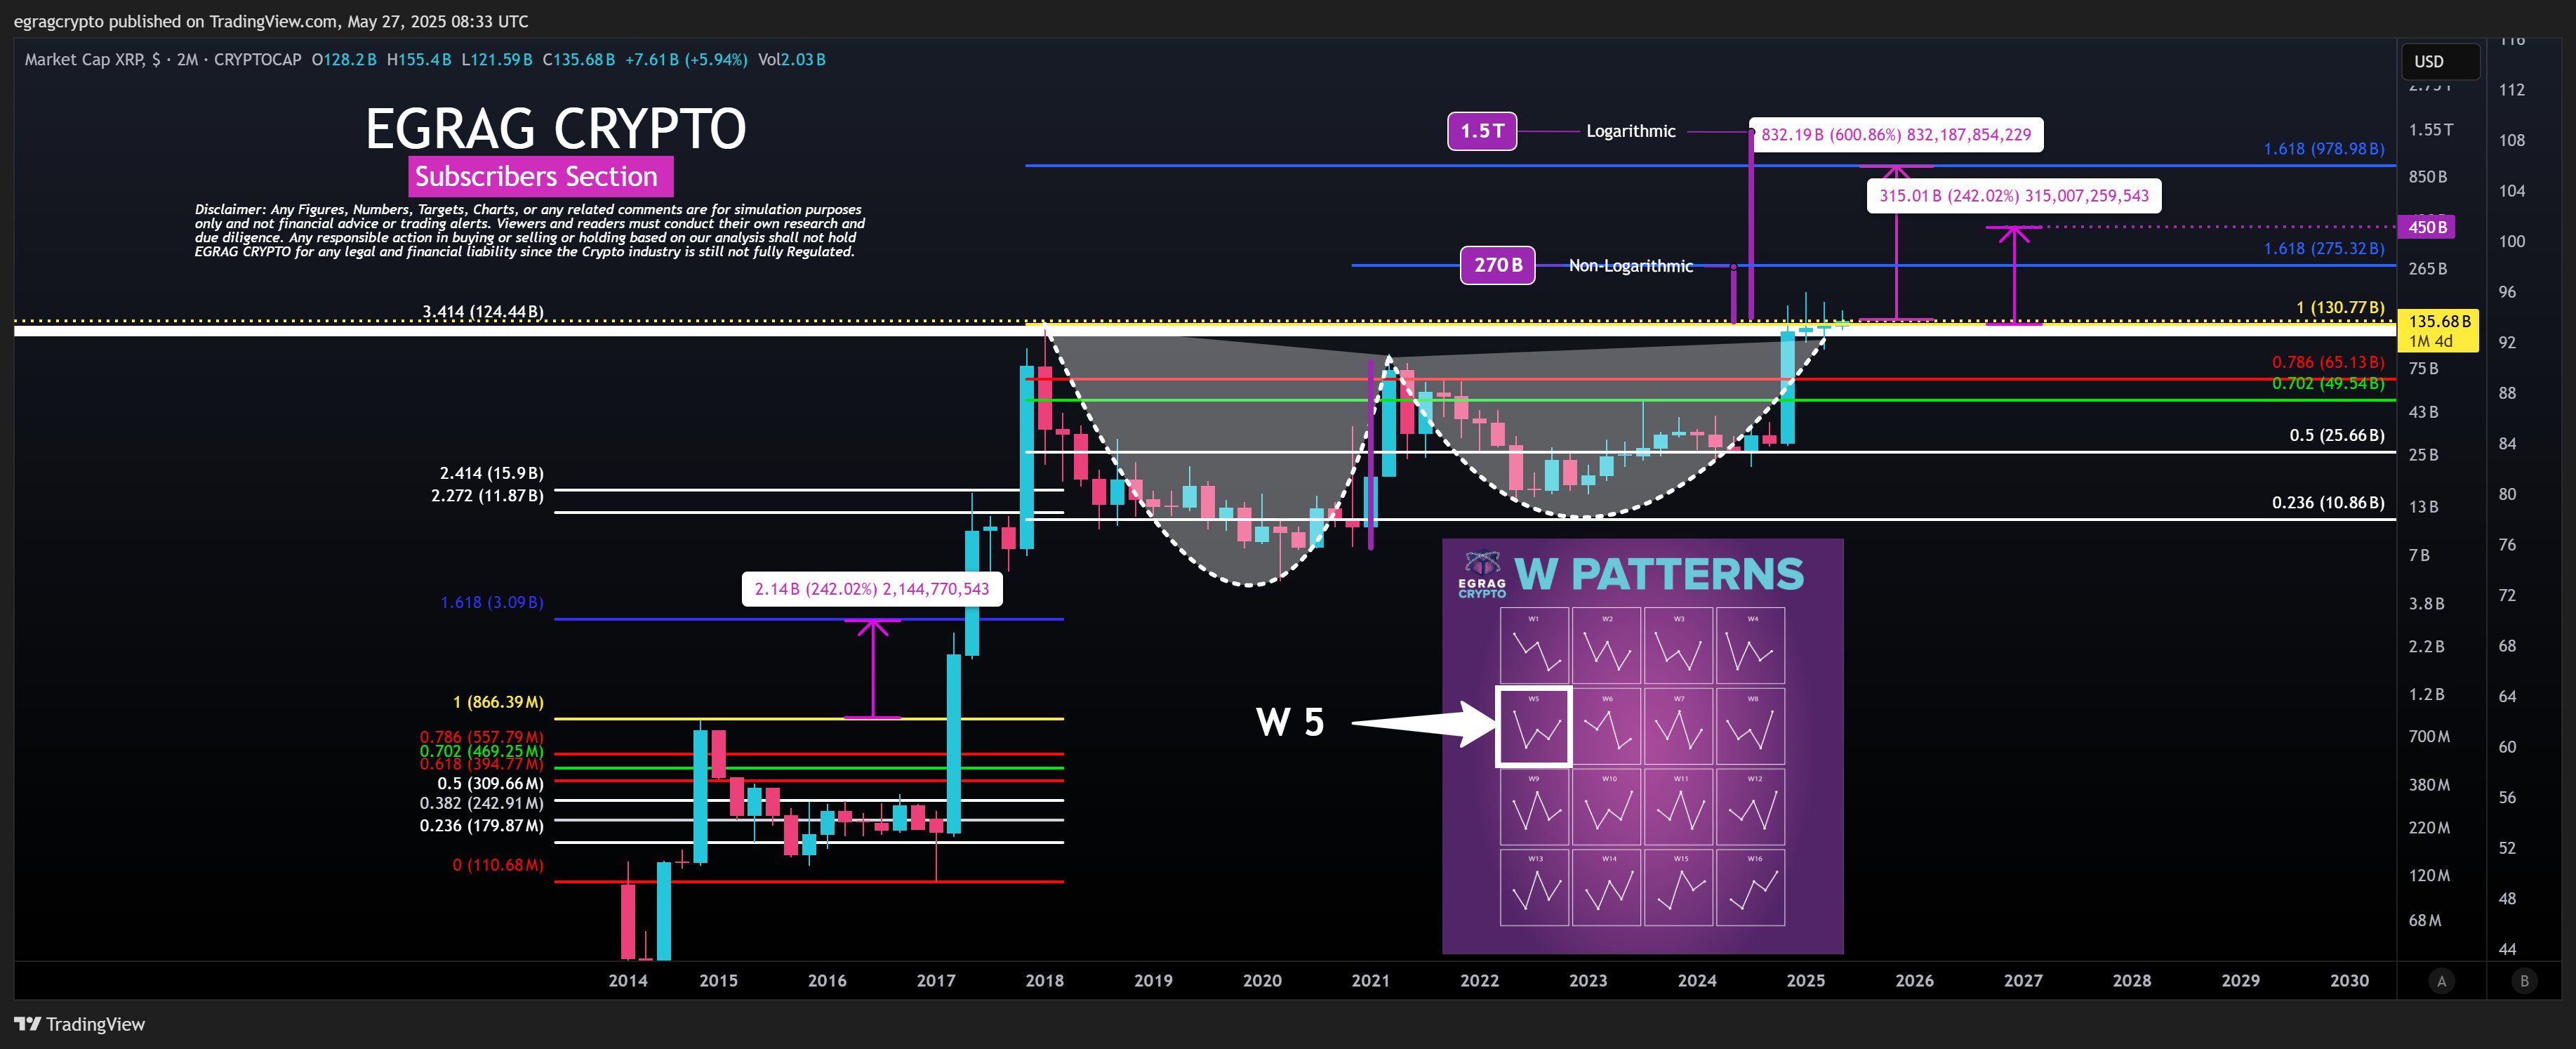
Now, with the pattern fully shaped, the XRP market cap just needs to break above the neckline. If it does, the market analyst expects the market cap to soar.
He outlined two main projections for where the market cap could go next, one based on a non-logarithmic scale and another based on a logarithmic view.
Specifically, the non-log target sits around $270 billion, which lines up with the Fibonacci 1.618 level. However, on the log scale, the picture becomes much more aggressive, with a possible target of $1.5 trillion, nearly $500 billion beyond the 1.618 Fib mark.
Interestingly, EGRAG also takes pointers from historical data. He noted that in the past cycle, the XRP market cap climbed by 242% from the Fib 1.0 level to Fib 1.618.
Using that same growth, he projects a move from $195 billion to $450 billion and potentially beyond. He even considered a 600% increase based on higher cycle extrapolation, pushing the cap up to $978 billion, and, if momentum builds further, up to $1.5 trillion.
EGRAG presented the corresponding price targets Based on XRP’s current circulating supply of 58.68 billion tokens. First, if the market cap hits $270 billion, XRP would trade at around $4.60.
However, at a $450 billion market cap, the price rises to $7.66. Meanwhile, a jump to $978 billion would push the price to roughly $16.65. Further, if XRP reaches the full $1.5 trillion market cap, its price could hit $25.56.
Notably, while EGRAG confirmed that he doesn’t rely heavily on market cap as a primary indicator, since it can mislead new investors by giving the wrong impression about real liquidity or value, he still sees value in using it to identify potential price targets.
He also reminded investors to stay grounded. Even with these exciting projections, he advised market participants to secure profits when they can and avoid falling into the trap of greed. Currently, XRP price changes hands at $2.3, corresponding to a market cap of $135.3 billion.
DisClamier: This content is informational and should not be considered financial advice. The views expressed in this article may include the author’s personal opinions and do not reflect The Crypto Basic opinion. Readers are encouraged to do thorough research before making any investment decisions. The Crypto Basic is not responsible for any financial losses.
British bank Standard Chartered dropped a prediction that Solana (SOL) could rise to $275 by the end of 2025 and $500 by the end of 2029. Geoff Kendrick, head of digital assets research at Standard Chartered, shared these forecasts in a report published Tuesday. Currently, Solana is trading for $178.50, so this outlook is looking at a 54% to 180% surge.
However, even with this, the bank still expects Solana to underperform compared to Ethereum over the next two to three years. Standard Chartered predicts the Ethereum-to-Solana price ratio will increase from about 14 today to 17 by the end of 2027. Kendrick explained this means ETH will keep a lead over SOL during this period.
Solana is known as the favorite blockchain for trading memecoins, which are highly volatile cryptocurrencies because they are driven by internet trends. However, Standard Chartered noted that memecoin activity on Solana seems to be “past its peak.” The bank said, “Declining usage and trading ‘cheap’ are not a good mix.” This means Solana price may suffer because its main use is slowing down.
The bank also pointed out that Solana trades at a low price compared to its application revenue, which they call its GDP. This revenue comes from the projects and apps built on Solana’s blockchain. In comparison, Binance’s BNB trades at a higher value because it benefits from Binance’s centralized exchange.
Looking ahead, Standard Chartered believes Solana is well-positioned to support sectors that require fast transactions with low fees. These include financial services, social media apps, and decentralized physical infrastructure networks. However, they warned that it might take a few years for these areas to grow enough to make a big impact on Solana’s value.
Solana has faced some challenges, including network outages and attacks. Recent upgrades, like the Firedancer validator client and new network tools, aim to improve its reliability. Meanwhile, Ethereum benefits from a more decentralized network and strong developer support. Ethereum also holds a much larger share of total value locked in decentralized finance projects.
Kendrick mentioned, “As a result, Solana is likely to face a two- to three-year period of lower activity (as measured by GDP). SOL is also likely to continue to trade ‘cheap’ relative to its GDP until other sectors become established users of Solana,”
Also Read: Shiba Inu Coin Price Eyes $0.00002 Amid 41M SHIB Token Burn
Some investors believe they could retire by amassing and holding onto their XRP tokens, but this would depend on how high XRP soars in the future.
Currently, XRP changes hands at $2.35, still struggling at the $2 mark despite Bitcoin’s latest uptick. However, this underperformance has not impacted investors’ sentiment. As optimism grows around XRP’s future, many investors are holding on tightly. Importantly, these investors hope the asset will become their ticket to financial freedom.
Notably, community commentators like Edoardo Farina have persistently championed this narrative. Interestingly, Farina has insisted that holding at least 10,000 XRP could be enough to reach that goal one day.
Meanwhile, to better understand what it might take to retire with XRP by 2040, we looked at a few long-term price predictions.
We aimed to find out how much XRP an investor would need to reach different retirement goals: $500,000, $1 million, and $5 million. For this, we asked two leading AI tools, ChatGPT and Google Gemini, as well as checked in with analysts from crypto forecasting site Telegaon.
Specifically, ChatGPT gave a forecast of $22 per XRP by 2040. According to the chatbot, this rise could come from XRP’s growing role in global payments, better regulatory clarity in the U.S., and increased use of the token in financial markets.

Based on this price, an investor who wants to retire with $500,000 would need 22,727 XRP. Notably, buying that many tokens today would cost around $53,409 at the current XRP price of $2.35.
However, for a $1 million target, you’d need 45,454 XRP, which would run about $106,818 at today’s prices.
Further, those aiming higher at $5 million would need to hold 227,272 XRP, which would cost them roughly $534,000 right now.
Meanwhile, Google’s Gemini presented an even more optimistic prediction, suggesting XRP could hit $150 by 2040. The AI tool pointed to massive institutional adoption, XRP’s potential role in replacing systems like SWIFT, and its use in central bank digital currency (CBDC) projects as major drivers.

If this forecast plays out, reaching retirement becomes a lot more affordable. To get to $500,000, you’d need just 3,333 XRP, which would cost around $7,833 today at the prevalent price of $2.35.
However, if you’re aiming for $1 million, you’d need 6,666 XRP, demanding an investment of about $15,666 today.
Those eyeing a $5 million retirement fund would need 33,333 XRP, which can be picked up now for roughly $78,333.
Interestingly, Telegaon analysts are the most bullish, predicting XRP could reach a peak of $160.34 by 2040. If that happens, the amount of XRP needed for retirement drops even lower.

To hit a $500,000 goal at this price, you’d need 3,118 XRP, which you could buy today for about $7,328.
Doubling that to $1 million would require 6,236 XRP, costing around $14,656.
A $5 million retirement would take 31,183 XRP, which would cost about $73,281 at current prices.
DisClamier: This content is informational and should not be considered financial advice. The views expressed in this article may include the author’s personal opinions and do not reflect The Crypto Basic opinion. Readers are encouraged to do thorough research before making any investment decisions. The Crypto Basic is not responsible for any financial losses.
Most of the top 10 coins are again in the green zone, according to CoinStats. CoinMarketCap “>
The rate of Bitcoin ![]() BTCUSD is almost unchanged since yesterday.TradingView”>
BTCUSD is almost unchanged since yesterday.TradingView”>
On the hourly chart, the price of the leading crypto is in the middle of the channel, which means there are low chances for sharp moves until tomorrow. This statement is also confirmed by the ATR, which has almost been passed.TradingView”>
On the bigger time frame, the picture is similar. If the daily bar closes around the current prices, traders are unlikely to witness a test of support or resistance levels shortly.TradingView”>
From the midterm point of view, one should focus on the weekly bar’s closure in terms of the $109,356 level.
If the weekly bar closes near it or above, the accumulated energy might be enough for ongoing growth to new peaks.
Bitcoin is trading at $109,635 at press time.
While the memecoin king DOGE is soaring ahead at a strong pace, the Dogecoin price could deliver notable rallies before Q3 kicks in. Meanwhile, a new DeFi asset management platform is gaining popularity for its explosive presale collection and over 200 million tokens sold in stage 2.
Analysts say this new AI utility coin is positioned to dominate major crypto projects in 2026.
Dogecoin Price Prediction: Analysts Eye Rally As DOGE Surges
The Dogecoin price recently surged to $0.24 and hit the highest point since mid-May and representing a strong 40% gain over the past several days.
This sharp rise follows a breakout above the 200-day exponential moving average (EMA), a technical event that often signals a major trend reversal.
Backed by a spike in on-chain activity and solid trading volumes, the current move appears to be more than just a speculative blip. DOGE’s 24-hour trading volume increased to $23.35 billion (a 41% increase), signaling demand.
Analysts suggest that if the Dogecoin price holds above the key support of $0.21 and sustains, the next target range lies between $0.28 and $0.30.
The latest Dogecoin price analysis highlights a spike in whale accumulation. Data shows that large wallets have collectively added over 1 billion DOGE recently, reflecting renewed confidence from major holders.
This accumulation often precedes further Dogecoin price appreciation and suggests long-term investor interest.
Dogecoin Price Analysts Cite Fundamentals Amid Breakout
Many analysts are optimistic about DOGE’s near-term future. One major catalyst is speculation surrounding a potential Dogecoin-based ETF, which has gained traction following a filing by 21Shares that the U.S. SEC recently acknowledged.
This development has added authenticity to DOGE’s investment case and could increase institutional inflows if approved. On terms of its performance trend, DOGE still faces key hurdles despite the bullish setup.
After peaking at $0.25, the Dogecoin price pulled back to $0.22 amid broader profit-taking and macroeconomic caution. The resistance band between $0.26 and $0.30 remains unbroken, and several traders are watching whether DOGE can decisively close above this level.
Moreover, Elon Musk continues to be a wildcard influence for Dogecoin. Rumors are circulating in the market about ‘X Money,’ a payment service in development by Musk’s platform X, possibly integrating DOGE in its ecosystem.
While unconfirmed, it would drastically expand the coin’s real-world utility among users.
Unilabs Stuns Memecoin Investors With Explosive Presale Debut
With the broader memecoin sector celebrating an overall bullish sentiment, Unilabs (UNIL) is silently dominating the majority of crypto giants with its next-generation investment protocol.
The platform’s state-of-the-art finance blockchain is leading viral memecoin projects like Dogecoin (DOGE) and other mainstream meme-based cryptos with its widespread adoption among.
According to on-chain data, this DeFi asset manager has recently hit a million-dollar jackpot, raising $1 million in stage 2 of its presale.
Unilabs has sold over 228 million UNIL tokens priced at $0.005 right now, with predictions of hitting a higher price point in the upcoming sessions. Based on the current performance trend, Unilabs could dominate the memecoin sector soon.
DOGE Holders Prioritize Unilabs $0.005 Utility Coin Amid AI Hype
Unilabs (UNIL) has outperformed a number of investment protocols through its blend of AI with a DeFi protocol. The platform incorporates an advanced artificial intelligence (AI) algorithm to hunt down top-tier blockchain projects in the crypto market before they hit the mainstream audience.
As a result, UNIL holders get to capitalize on these lucrative opportunities before they break out. The platform is gaining recognition for offering complete transparency, massive gains, and full access to ventures once reserved for institutional investors.
Unilabs delivers exceptional returns by enabling high-profile investment opportunities for retail traders. The platform lets investors claim profits on the potential of high-growth crypto projects.
Conclusion:
As Dogecoin enjoys the bullish sentiment developing amid the broader market development, Unilabs (UNIL) is becoming the talk of the town following its grand presale success.
Discover More About Unilabs:
Presale: https://www.unilabs.finance/
Buy Presale: https://buy.unilabs.finance/
Telegram: https://t.me/s/unilabsofficial
Twitter: https://twitter.com/unilabsofficial


 Price Prediction for May 29")

