The main category of Crypto News.
You can use the search box below to find what you need.
[wd_asp id=1]
The main category of Crypto News.
You can use the search box below to find what you need.
[wd_asp id=1]
BNB USD (BNBUSD) is trading at $909.82 as of January 6, 2026, showing mixed signals in the crypto market. The token gained 1.71% today despite a 0.82% decline over the past 24 hours, reflecting volatility in the broader digital asset space. With a market cap of $133 billion and trading volume of 2.08 billion, BNBUSD remains one of the most actively traded cryptocurrencies. Understanding why BNBUSD is dropping requires examining technical indicators, market sentiment, and price forecasts that suggest both near-term challenges and longer-term opportunities for traders and analysts.
BNBUSD is currently trading near its 50-day moving average of $871.94, indicating consolidation around key support levels. The token’s year-to-date performance shows a 39.21% gain, though it remains 33.6% below its 52-week high of $1,370.55. Today’s 1.71% increase suggests some buying interest despite the broader downward pressure.
The day’s trading range of $890 to $915.89 shows relatively tight price action. Volume at 2.08 billion is 60% of the 90-day average, indicating lighter participation than normal. This reduced activity often precedes larger price moves as traders await clearer directional signals.
The RSI at 57.78 sits in neutral territory, neither overbought nor oversold, suggesting balanced momentum between buyers and sellers. The MACD shows a bearish signal with the line at -9.85 below the signal line at -20.16, though the positive histogram of 10.31 indicates potential bullish divergence forming.
The ADX at 34.83 confirms a strong downtrend is in place, meaning the current directional move has conviction behind it. BNBUSD is trading just above the Bollinger Bands middle line at $863.59, with support at $818.69 and resistance at $908.49. The Stochastic %K at 80.38 signals overbought conditions on shorter timeframes, which could trigger profit-taking in the near term.
Monthly Forecast: BNBUSD is projected to reach $833.08 by end of January, representing an 8.4% decline from current levels. This downside move would test the 200-day moving average at $889.20 and could be driven by profit-taking after recent gains.
Quarterly Forecast: By end of Q1 2026, the forecast rises to $1,032.17, a 13.5% increase from today’s price. This suggests a recovery phase after the monthly pullback, potentially driven by renewed institutional interest or positive regulatory developments.
Yearly Forecast: The 12-month target sits at $810.39, indicating a 10.9% decline from current levels. This longer-term view reflects potential consolidation as the market digests recent gains. Forecasts may change due to market conditions, regulations, or unexpected events.
Trading activity shows mixed signals with volume 60% below average, suggesting traders are cautious about directional commitment. The Money Flow Index at 71.08 indicates strong buying pressure despite price weakness, a bullish divergence that often precedes reversals.
Liquidation data reveals the Awesome Oscillator at 3.56 remains positive, showing momentum hasn’t completely reversed. However, the negative OBV at -18.1 billion suggests institutional selling pressure may be building beneath the surface. This combination indicates a market in transition between downtrend and potential recovery.
BNBUSD is dropping 0.82% today primarily due to profit-taking after the 1.71% daily gain and broader crypto market consolidation. The strong ADX reading confirms sellers maintain control, though oversold conditions on the Stochastic suggest a bounce could occur soon.
The token’s position between key moving averages creates a critical decision point. A break below $890 support could accelerate the decline toward $850, while a hold above $908 resistance might trigger a recovery toward $950. Traders should watch volume closely, as the current light activity suggests the next major move will come with increased participation.
BNB serves as the native token for the Binance Smart Chain ecosystem, which continues expanding with new DeFi protocols and NFT platforms. The token’s utility in transaction fees, staking rewards, and governance gives it fundamental value beyond speculation.
The 145.9 billion shares outstanding and $133 billion market cap position BNBUSD as a top-5 cryptocurrency by market value. Recent ecosystem developments, including enhanced cross-chain bridges and layer-2 scaling solutions, provide long-term growth catalysts. These fundamentals support the quarterly forecast of $1,032.17, though near-term technical weakness suggests patience is required.
BNBUSD at $909.82 presents a complex picture for traders and analysts on January 6, 2026. The token’s 1.71% daily gain masks underlying weakness, with the 0.82% 24-hour decline and strong ADX downtrend suggesting sellers remain in control. Technical indicators show mixed signals: neutral RSI, overbought Stochastic, and bullish MACD divergence all point to a market at an inflection point.
The price forecasts reveal a near-term pullback to $833.08 followed by a recovery to $1,032.17 in Q1, suggesting volatility ahead. Traders should monitor the $890 support level closely, as a break below could accelerate losses. The reduced trading volume indicates the market awaits clearer directional signals before committing fresh capital. For longer-term holders, the yearly forecast of $810.39 and three-year target of $1,017.53 suggest BNBUSD remains within a consolidation range despite short-term weakness. Market sentiment remains cautious but not bearish, with the Money Flow Index and Awesome Oscillator suggesting institutional interest persists beneath the surface.
BNBUSD is dropping 0.82% today due to profit-taking after recent gains and a strong downtrend confirmed by the ADX at 34.83. Lighter trading volume at 60% of average suggests traders are cautious about direction. The Stochastic at 80.38 indicates overbought conditions on shorter timeframes, triggering some selling pressure.
The monthly forecast for BNBUSD is $833.08, representing an 8.4% decline from current $909.82 levels. This pullback would test the 200-day moving average at $889.20. However, the quarterly forecast rises to $1,032.17, suggesting recovery in Q1 2026 after the monthly consolidation phase.
Key support for BNBUSD sits at $890 (day low) and $818.69 (Bollinger Bands lower band). Resistance is at $908.49 (upper Bollinger Band) and $915.89 (day high). A break below $890 could accelerate decline toward $850, while holding above $908 might trigger recovery toward $950.
BNBUSD shows mixed conditions: the RSI at 57.78 is neutral, but the Stochastic %K at 80.38 signals overbought conditions on shorter timeframes. The CCI at 244.77 also indicates overbought status. This suggests potential profit-taking in the near term, supporting the monthly forecast decline to $833.08.
The yearly forecast for BNBUSD is $810.39, while the three-year target reaches $1,017.53 and five-year forecast is $1,226.93. These targets suggest BNBUSD will consolidate around current levels before trending higher over multiple years, driven by ecosystem growth and institutional adoption.
BNBUSD has a market cap of $133 billion, making it one of the top-5 cryptocurrencies globally. With 145.9 billion tokens outstanding, the token maintains significant liquidity and trading volume of 2.08 billion daily. This scale provides stability compared to smaller altcoins.
Disclaimer:
Cryptocurrency markets are highly volatile. This content is for informational purposes only.
The Forecast Prediction Model is provided for informational purposes only and should not be considered financial advice.
Meyka AI PTY LTD provides market data and sentiment analysis, not financial advice.
Always do your own research and consider consulting a licensed financial advisor before making investment decisions.
A top crypto analyst shared the possibility of a $80,000 level retest in a recent Bitcoin price prediction, sparking speculation. The BTC USD prediction comes despite the crypto breaking above $93,000 for the first time in a month.
The recent pump is the highest rebound in weeks and can be attributed to the rising geopolitical tensions. At the time of writing, traders and market watchers are both optimistic and cautious at the same time as they brace for a drop towards $80,000 before the start of any lasting bullish rally.
As such, the majority of traders perceive the recent surge as a tentative price action rather than a clear sign of momentum and strength.
The silver lining is that major technical signals started to improve with Bitcoin’s 4-hour price chart approaching the formation of a golden cross.
In a recent Bitcoin price prediction, a market watcher shared the possibility of the BTC USD pair retesting the $80,000 lows before it can print any meaningful gains. The price prediction surfaced just after the Bitcoin price soared by 5.53% over the last five days.
One particular top trader and analyst on X, CrypNuevo, said that BTC USD price is unlikely to recover immediately from current levels.
He compared the current market action to October 2019, suggesting that Bitcoin will continue to target nearby liquidity on exchange order books.
CrypNuevo noted that the market structure looks almost identical. In 2019, the price first ran through liquidity, then dipped to sweep the lows before staging a strong rally. He expects a similar pattern could play out this time.
That scenario would push Bitcoin price below $80,000 for the first time since April.
On the way down, traders are watching two gaps in CME Group’s Bitcoin futures market as potential support targets: between $90,500 and $91,600, and $88,200 and $88,800.
CoinGlass also released its latest data showing crypto short liquidations reached $250 million in 24 hours. Traders piled liquidity into the weekly close, eyeing $93,700 as the next upside target for Bitcoin bulls.
Keith Alan, cofounder of trading platform Material Indicators, noted on X that further price action could be even more interesting. A previous “wall” of sell orders at $100,000 has disappeared, removing a key resistance point.

Alan highlighted increased buying from smaller Bitcoin whales, signaling that momentum may be shifting. He told X followers that this could mark the start of a more dynamic phase in the market.
Bitcoin’s 5% rebound may look modest, but it could signal a shift in the market. In addition, the 50-period simple moving average (SMA) is almost to cross above the 200-day SMA on the four hour BTC price chart. This suggests a possible reversal of October’s death cross and signals massive potential for a bullish rally.
However, on the daily chart, a golden cross is still a distant possibility, following a death cross that appeared just a month later.
Looking at the longer term, trader SuperBro points to another set of trendlines that are turning bullish. The weekly 100-period SMA and EMA are both flipping green, suggesting stronger momentum.
SuperBro noted that in previous bear markets, the 100-week EMA crossing below the 100-week SMA marked the start of major Bitcoin price declines. In the past, these signals often came before crashes of more than 50% within just a few weeks.
This time, however, the market seems to be moving differently, suggesting the current cycle could play out more slowly.
Dogecoin (DOGE) has been one of the top performers in the crypto market since the beginning of the new year. The number one memecoin gained nearly 30% over the past four days, outperforming major cryptos amid a rise in the broader market sentiment.
The move is reflected in the 21Shares 2x Dogecoin ETF (TXXD), which is one of the best-performing ETFs to start 2026, according to Bloomberg ETF analyst Eric Balchunas.
The speculative interest in Dogecoin also improved slightly in the traditional crypto market, with its open interest (OI) rising to 13.47 billion DOGE on January 2 — its highest level since the October 10 leverage flush, per Coinglass data. However, that figure has slightly retreated to 12.68 billion DOGE despite a steady price rise, indicating some scepticism among traders.
Meanwhile, the rise isn’t limited to Dogecoin as the broader memecoin category has seen its market capitalization rise over 30% to $47.8 billion in the past four days.
The move follows months of underperformance, with the memecoin to altcoin dominance ratio plunging to historic lows of 0.032 in December. This means that memecoins accounted for only 3% of the general altcoins market cap. However, a massive memecoin season kicked off following the last time the metric reached such levels.
With recent gains across several memecoins, the sector could be hinting at a comeback, according to CryptoQuant contributor Darkfost.
DOGE has risen above the 50-day Exponential Moving Average (EMA) and is looking to tackle the $0.166 resistance near the 100-day EMA. A rise above could push the top memecoin to tackle the $0.181 hurdle near the 200-day EMA.
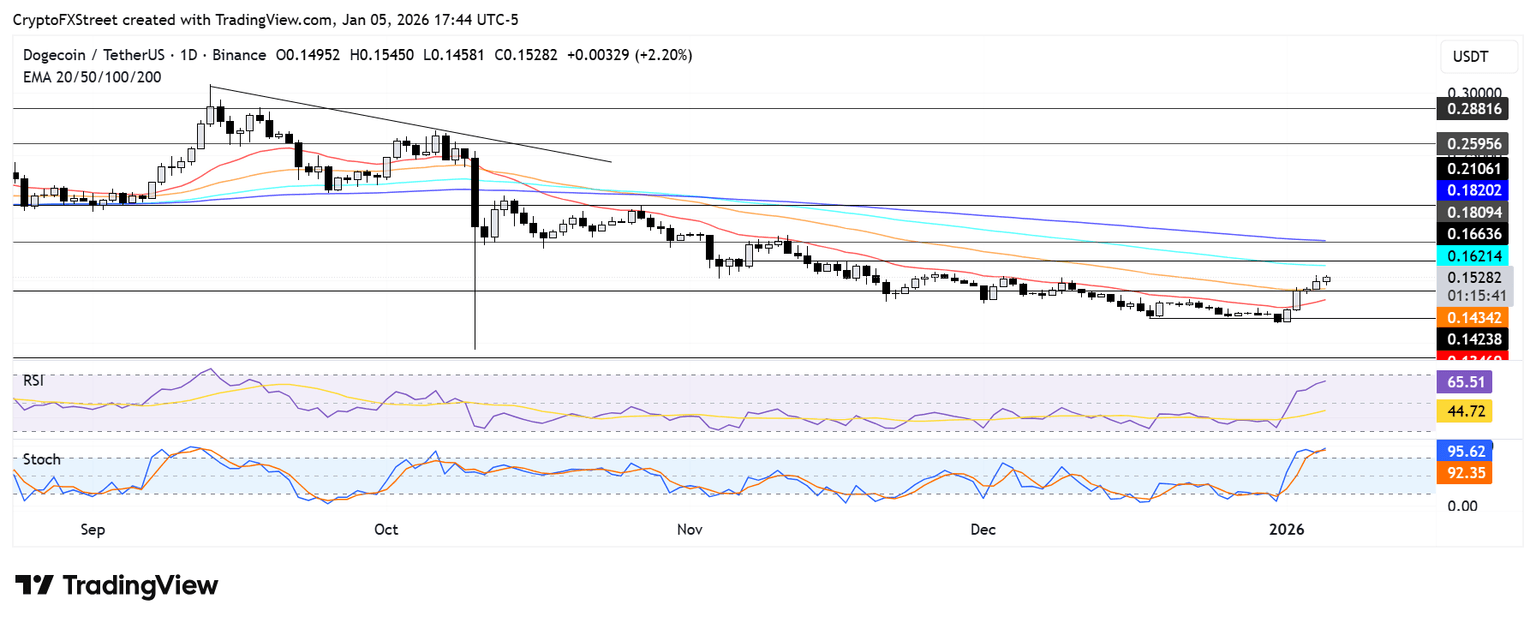
On the downside, Dogecoin could find support at $0.142. A decline below $0.142 and eventually the 20-day EMA could push its price toward $0.121.
The Relative Strength Index (RSI) is above its neutral level, while the Stochastic Oscillator (Stoch) is in its overbought region, indicating a rising bullish momentum. Sustained overbought conditions in the Stoch could spark a pullback.
Dogecoin (DOGE) price opened 2026 with signs of stabilization following a volatile correction in late 2025. Multiple technical studies suggest downside pressure is easing as price holds key support zones. Analysts now point to recovery structures that could guide Dogecoin toward higher levels if momentum continues to build.
According to analyst Trader Tardigrade, the three-month Dogecoin price against USD chart outlines a clear cyclical structure. Price action moved through alternating phases of advances, recoveries, and declines between July 2025 and January 2026. The most recent segment shows a mild upward shift after the drop toward $0.12.
This phased behavior reflects Dogecoin’s tendency to rotate through sentiment-driven cycles. The latest green recovery bars indicate reduced downside pressure compared to prior red phases. Stabilization near $0.125 suggests buyers are beginning to absorb the remaining supply.
Moreover, the structure implies a potential transition toward an uptrend if support remains intact. Sustained price action above the current range could open the door to a move toward $0.15. Failure to hold the range would instead extend consolidation.
Additionally, analyst BitGuru analyzed the DOGE price chart covering mid-2025 through early 2026. The chart highlights a sharp liquidity sweep in November that pushed the price briefly below $0.12. That move was followed by a tight consolidation range into the new year.
 SOURCE: X

This consolidation phase shows narrowing candles and fading selling pressure. Such behavior often points to accumulation after forced liquidations. Price has continued to respect the $0.12 to $0.13 band, suggesting a balance between buyers and sellers.
In addition, the structure reflects a classic reset following a strong rally earlier in the cycle. A confirmed break above $0.13 would indicate renewed upside momentum. A move below $0.115 would reopen downside risk.
Meanwhile, according to analyst Berke Oktay, the long-term Dogecoin price chart places current price action within a descending wedge spanning more than a decade. DOGE price has compressed into a major support zone between $0.10 and $0.12. This zone has historically acted as a defensive level.
 SOURCE: X
The chart also highlights developing divergences as price holds support despite prior declines. Such conditions often precede trend shifts when selling momentum weakens. Holding this zone prevents a deeper structural breakdown.
Furthermore, the wedge formation suggests energy is building as price compresses. A sustained defense of support could allow Dogecoin to challenge higher resistance levels over time. A breakdown below the zone would invalidate the reversal scenario.
XRP is showing signs of renewed strength, as technical patterns and smart money accumulation hint at a potential breakout toward the $2.80–$3 range.
The cryptocurrency has recently demonstrated increased buying interest, with momentum building after tracing key support levels. Analysts point to Wyckoff reaccumulation patterns and long-term Elliott Wave structures, suggesting that XRP may be preparing for a sustained bullish phase in the near term. Current trading sits around $2.15, up 2.86% in the last 24 hours, with a daily trading volume of 3.63 billion XRP, highlighting growing market activity.
Recent observations indicate that XRP/USD is tracing a Wyckoff reaccumulation pattern, a technical structure often interpreted as a period of strategic accumulation before upward movement. @ChartingGuy, a market analyst with a focus on XRP charts, notes: “$XRP is following the Wyckoff reaccumulation phases closely, with a spring low near $1.61 in late 2025. The pattern points to accumulation by smart money before a potential markup.”
XRP/USD traces a Wyckoff reaccumulation pattern, with a “spring” low near $1.61 signaling smart money accumulation before potential markup. Source: @ChartingGuy via X
It is important to clarify that “smart money accumulation” in this context refers to volume and price behavior suggestive of institutional buying, such as:
The Wyckoff phases observed include:
Price activity around $1.68 aligns with this structure, though a daily close below $1.60 could invalidate the pattern and suggest additional consolidation. Analysts now view a breakout scenario toward $2.80–$3 as a probabilistic, not guaranteed, outcome.
Long-term charts analyzed by @MaeliusCrypto apply an Elliott Wave count, mapping XRP’s historical price movements. Maelius commented, “Current price action is in the final stages of wave (4) within a larger impulse. Only one subwave remains before wave (5) could push XRP higher.”

XRP RSI signals a breakout in Q1, pointing to a potential upward price move with a conservative one-week count. Source: @MaeliusCrypto via X
The breakdown includes:
Wave I: Initial rise (2013 onward)
Wave II: Market correction
Wave III: Peak around $3.84 in 2018
Wave IV: Extended multi-year correction
The RSI (14-period) is testing a long-term descending trendline from the 2018 overbought peak. A breakout here, potentially in Q1 2026, could indicate a momentum shift. Conservative projections suggest XRP may initially target $2.80–$3, while more optimistic scenarios extend toward $10, but these long-term estimates are contingent on broader market health and Bitcoin’s trend. A failure to hold key support around $2.00 would invalidate the Elliott Wave setup.
TradingView analyst BTC-HONDA notes that XRP is forming a long-term falling wedge, characterized by declining volume and multiple breakout attempts. He observes, “The setup is remarkably clean. Price has teased upside potential several times, and a bullish resolution appears probable, especially if Bitcoin confirms strength.”

XRP forms a clean falling wedge, teasing $2.40–$2.80 upside, with BTC strength key to confirming the bullish breakout. Source: BTC-HONDA on TradingView
The wedge implies an initial target zone of $2.40–$2.80, with potential for higher gains if the broader crypto market strengthens. XRP’s near-term movement remains closely correlated with BTC performance, making confirmation from Bitcoin critical for sustaining any breakout.
XRP appears positioned for a potential breakout, supported by Wyckoff reaccumulation, Elliott Wave patterns, and a falling wedge. The technical structure suggests accumulation and a higher probability of upward momentum, but market conditions, Bitcoin performance, and regulatory developments remain critical factors.

XRP was trading at around 2.15, up 2.86% in the last 24 hours at press time. Source: XRP price via Brave New Coin
Short-term projections point to $2.80–$3, while long-term scenarios could extend toward $10, contingent on favorable conditions. Traders and investors are advised to monitor volume expansion, daily closes, and key support/resistance levels to gauge the validity of these setups and manage potential risks effectively.
Solana price continued rising on Monday, reaching its highest point since December 12. SOL token rose to a high of $135 on Monday, up by over 15% from its lowest point this year. So, will the token rebound like Solana meme coins?
The main reason why the Solana price is soaring is that sentiment in the crypto industry has improved in the past few days. Indeed, the popular Crypto Fear and Greed Index has jumped from the extreme fear zone of 8 in 2025 to the current 41.
The surge has also coincided with the ongoing rebound of Solana meme coins. Data show that the market capitalization of these meme coins rose 15.7% over the last 24 hours to over $6.69 billion, while their 24-hour volume rose to over $3 billion.
READ MORE: Will the CLARITY Act Boost Crypto Prices in 2026?
Official Trump and Bonk tokens jumped, reaching a market capitalization of over $1 billion. Other top Solana meme coins like Pudgy Penguins, Pippin, Dogwifhat, and Fartcoin have jumped by double digits in the past few days.
Data compiled by DeFi Llama shows that Solana has continued to benefit from this surge. For example, the volume handled by Solana DEX networks jumped to over $102 billion in the last 30 days. Its volume was much higher than Ethereum and BSC combined. The two had over $44 billion and $55 billion in combined assets.
Solana has other bullish catalysts. For example, Solana’s futures open interest has started rising, reaching a high of $8 billion, its highest level since November 5. It has been in a strong uptrend after bottoming at $7.2 billion in December.
Meanwhile, spot Solana ETF inflows have continued rising. These funds added over $775 million in the past few months, bringing the total assets to $1.02 billion. Bitwise, Grayscale, Fidelity, and VanEck funds are leading this gain.
Solana is also preparing for the Alpenglow upgrade, which aims to boost its speeds over time. It aims to make it much better than other chains, such as Ethereum and BNB Smart Chain.

The daily chart shows that the Solana price has rebounded in the past few days. It bottomed at $119.38 and has moved above the 25-day Exponential Moving Average (EMA).
The two lines of the Percentage Price Oscillator (PPO) have crossed above the zero line and are nearing it. Also, the Stochastic Oscillator has continued to rise and moved above the overbought level.
Therefore, the token will likely continue to rise as bulls target the psychological $150 level. A move above that level will signal more gains, potentially to the $200 resistance level. However, a drop below the key $120 support will invalidate the bullish forecast.
READ MORE: Here’s Why the Shiba Inu Coin Price is Going Parabolic
Iris Coleman
Jan 05, 2026 11:49
MATIC price prediction suggests potential 18% upside to $0.45 within 4-6 weeks if bulls break $0.58 resistance, though bearish momentum persists below this critical level.
Polygon’s MATIC token sits at a critical juncture as we enter 2026, with technical indicators painting a mixed picture for the cryptocurrency’s near-term trajectory. Currently trading at $0.38, MATIC faces a decisive test at the $0.58 resistance level that will determine whether bulls can mount a sustainable recovery or bears maintain their grip on the market.
• MATIC short-term target (1 week): $0.42 (+11%) – testing SMA 20 resistance
• Polygon medium-term forecast (1 month): $0.45-$0.52 range if $0.58 breaks
• Key level to break for bullish continuation: $0.58 (critical resistance)
• Critical support if bearish: $0.35, then $0.33 (strong support zone)
The latest MATIC price prediction consensus among analysts reveals cautious optimism tempered by technical realities. Blockchain.News has consistently maintained a $0.45-$0.52 price target for the medium term, representing potential upside of 18-37% from current levels. This Polygon forecast hinges critically on MATIC’s ability to decisively break above the $0.58 resistance level.
More aggressive predictions emerge from CoinLore, projecting a $3.50 long-term target based on historical crypto cycle analysis, though this carries low confidence given the speculative nature of such extended forecasts. Meanwhile, CoinMarketCap focuses on fundamental catalysts, particularly the AggLayer v0.3 upgrade scheduled for January 2026, which could drive increased demand for POL tokens.
The analyst consensus reveals a clear pattern: short-term recovery depends entirely on technical breakouts, while longer-term bullishness relies on successful protocol upgrades and adoption metrics.
The current Polygon technical analysis reveals MATIC trading in a compression zone, with several indicators suggesting an impending directional move. At $0.38, the token sits precisely at its pivot point, creating a neutral setup that could break either way.
Key technical factors supporting a potential reversal include MATIC’s position within the Bollinger Bands at 0.29, indicating the token trades in the lower portion of its recent range but hasn’t reached oversold extremes. The RSI reading of 38.00 remains in neutral territory, providing room for upward movement without hitting overbought conditions.
However, bearish momentum persists with the MACD histogram at -0.0045, suggesting selling pressure continues to outweigh buying interest. The distance between current price and key moving averages tells the story: MATIC trades 11% below its SMA 20 ($0.43) and significantly below longer-term averages, indicating the broader trend remains challenged.
Volume analysis from Binance spot markets shows $1.07 million in 24-hour turnover, which remains relatively subdued and suggests limited conviction from either bulls or bears at current levels.
The primary MATIC price target of $0.45-$0.52 becomes achievable if bulls can accomplish two critical technical objectives. First, a decisive break above $0.58 resistance would invalidate the current bearish structure and open the path toward the SMA 50 at $0.45. This level represents the minimum target in any meaningful recovery scenario.
For the bullish case to strengthen, MATIC needs to reclaim its SMA 20 at $0.43, which would signal the beginning of a trend reversal. From there, sustained buying pressure could propel the token toward the upper Bollinger Band at $0.56, setting up the crucial test of $0.58 resistance.
The fundamental backdrop supports this scenario through the upcoming AggLayer v0.3 upgrade, which aims to unify liquidity across Polygon chains. Successful implementation could drive increased utility and demand for the native token.
The bearish scenario becomes probable if MATIC fails to hold current support levels around $0.35. A break below this immediate support would likely trigger stops and accelerate selling toward the strong support zone at $0.33, representing the 52-week low territory.
Technical indicators suggest this downside risk remains elevated, with the MACD histogram showing continued bearish momentum and price trading well below all major moving averages. The distance from the 52-week high of $1.27 reflects the challenging environment MATIC faces in attempting any meaningful recovery.
Risk factors to monitor include broader cryptocurrency market sentiment, Bitcoin’s price action, and any delays or complications with the planned protocol upgrades that underpin the fundamental bullish case.
The current technical setup suggests a measured approach to MATIC positioning rather than aggressive accumulation. For those considering entry, the most logical strategy involves waiting for confirmation of directional movement rather than attempting to catch a falling knife.
Conservative entry points should focus on reclaiming the SMA 20 at $0.43, which would provide the first technical confirmation of trend change. More aggressive traders might consider scaling into positions around current levels ($0.38) with tight stops below $0.35 to limit downside risk.
Risk management becomes crucial given the mixed technical picture. Stop-loss levels should be placed below $0.33 for any long positions, representing approximately 13% risk from current levels. Position sizing should reflect this technical uncertainty, with reduced allocation until clearer directional signals emerge.
Based on current technical analysis, our MATIC price prediction anticipates a test of $0.45 within the next 4-6 weeks, contingent on breaking the critical $0.58 resistance level. This represents a medium confidence forecast given the mixed technical signals and dependency on specific breakout levels.
The key indicators to watch for confirmation include RSI movement above 50, MACD histogram turning positive, and most importantly, sustained trading above $0.43. Invalidation signals would include breaks below $0.35 support or continued rejection at current resistance levels.
This Polygon forecast carries a February 2026 timeline for the $0.45 target, assuming successful navigation of immediate technical hurdles and positive momentum from the upcoming protocol upgrades. Traders should remain flexible and ready to adjust positions based on how MATIC responds at these critical technical junctures.
Image source: Shutterstock
Dogecoin price rose for five consecutive days, reaching its highest point since November last year. The DOGE token has jumped by 30% from its lowest level this year, bringing its market capitalization to over $25 billion. So, is this the start of a new Dogecoin rally or a dead-cat bounce?
The DOGE token rose as meme coins rebounded sharply in the past few days. Most of these coins, including popular names like Pepe Coin, Shiba Inu, Bonk, and Official Trump, have rebounded in the past few days, with their market capitalization rising to over $52 billion.
Dogecoin price rose as futures open interest continued to rise, moving from a low of $1.27 billion on December 9 to $1.8 billion today, its highest level since October 28. The daily trading volume of DOGE jumped to over $3.24 billion, up sharply from a low of $1.17 billion in December.
The token also rose as DOGE ETF inflows rose by $2.3 million on Friday, bringing cumulative net inflows to $4.64 million. Its funds now hold $8.34 million, a tiny amount for a coin with a market capitalization of over $20 billion.
READ MORE: Will the CLARITY Act Boost Crypto Prices in 2026?
One main reason for the Dogecoin price rally is that the Bitcoin price has moved above the key $91,000 resistance level. It is common for meme coins to rally when Bitcoin and the broader futures open interest are soaring.
Also, the token is rising as investors buy the dip after it plunged by double digits in 2025. It dropped by over 62% from its peak in September to its trough in December. As such, it is common for investors to buy an asset after it has plunged hard over a specific period.
The coin has also risen as the January Effect continued. The January Effect is a phenomenon in which financial assets jump sharply in January as investors begin buying. We experienced this surge happening in January last year, towards Donald Trump’s inauguration.

The daily timeframe chart also explains why the DOGE price is rising. As the chart above shows, it happened after the token formed a giant falling wedge pattern, a common bullish reversal sign.
Dogecoin price has now moved above the upper side of the wedge, while the Supertrend indicator has turned green. It also moved above the 50-day Exponential Moving Average (EMA).
The token has also hit the target of the falling wedge pattern at $0.1540. This target is estimated by measuring the widest part of the wedge and the same distance from the breakout point.
Top oscillators such as the Chaikin, Relative Strength Index, and On-Balance Volume (OBV) have all pointed upward. Therefore, the most likely scenario is where the coin continues rising as FOMO continues.
However, the persistent risk is that the ongoing rally is a dead-cat bounce, which could lead to a retreat in the coming weeks.
Bitcoin (BTC) price surged
past $93,000 on Monday, January 5, 2026, marking the fifth consecutive session
of gains across major cryptocurrencies. Ethereum climbed to $3,162, XRP tested
$2.14, and Dogecoin rallied following a breakout from its bearish channel.
The total
crypto market capitalization climbed above $3.01 trillion, driven by stronger
investor sentiment, slowing ETF outflows, and renewed interest from
institutional players. This early-2026 momentum shows a stark reversal from the
disappointing fourth-quarter performance that saw excessive leverage unwound
and sentiment reset.
Why are cryptocurrencies rising today? What are the
latest price forecasts, and what does technical analysis show for the BTC/USDT,
XRP/USDT, ETH/USDT, and DOGE/USDT charts? This article takes a closer look.
“Cryptocurrency
markets are in the green as investors add digital gold to their portfolios amid
positioning for the year ahead,” explains Petr Kozyakov, Co-Founder and
CEO at Mercuryo. The payment infrastructure leader notes that Bitcoin’s push
past $92,000 has led the market higher alongside gains in Ethereum and Solana.
Kozyakov
highlights a notable shift in market dynamics: “A shift in mood across the
digital token space has been underlined by a resurgence in interest in the meme
coin sector, with Shiba Inu and Pepe making a loud entry to 2026.” Beyond meme coin speculation, the cryptocurrency industry is experiencing a broader transformation as market structure reform and legislative architecture take precedence over pure price action, with stablecoin capitalization hitting $312.63 billion in December 2025.
Despite the
severe drop in sentiment during the final months of 2025, he emphasizes that
“fundamentals in the sector remain strong as the underlying infrastructure
evolves with assets such as stablecoins continuing to attract increasing levels
of liquidity.”
Joel
Kruger, crypto strategist at LMAX, provides important context for the recovery.
“The crypto market delivered an undeniably disappointing fourth-quarter
performance,” he acknowledges, noting frustration given that Bitcoin and
ETH had already reached fresh record highs earlier in 2025 alongside
significant regulatory and adoption progress.
However,
Kruger views the pullback constructively: “The weaker headline performance
can also be viewed as a healthy reset. The pullback helped unwind overleveraged
positions and clear excess froth, a necessary process that often improves
market structure and supports more sustainable upside over time.”
It’s also certainly relevant what’s happening in Venezuela and Donald Trump’s “war on oil.” But what do the charts say?
Bitcoin
briefly touched $93,000 on Monday, with Yahoo Finance data showing an intraday
high of $93,155 and closing at $92,798. The world’s largest cryptocurrency is
trading at its highest level in nearly one month, up over 2% in the last 24
hours. However, my technical analysis reveals Bitcoin remains trapped in a
nearly two-month consolidation between $84,000 and $94,000.
Why Bitcoin
price is going up today? Source: Tradingview.com
|
Support Zones |
Resistance Zones |
|
$88,000 (major downside invalidation) |
$94,800-$95,500 (descending trendline) |
|
$90,000-$92,000 |
$100,000 (200 EMA, bull confirmation) |
|
$84,000-$87,000 (consolidation floor) |
$103,000 (trend separator) |
|
$74,000 (bear target, 161.8% Fibo) |
$126,000 (October ATH) |
The price
action shows Bitcoin testing the upper boundary of its range, defined by the
50-day moving average and 100% Fibonacci extension near $92,000-$94,000. On the
daily chart, Bitcoin continues moving in an increasingly narrowing wedge
pattern, with the lower boundary rising since mid-December from around $80,500.
“BTC
has been respecting a descending trendline for weeks. Price recently tested
this trendline near 94,800 and showed a reaction,” observes Areeb Khan
from Traders’ Hub. He identifies several key technical observations:
Khan’s Technical Breakdown:
Khan
provides specific levels to monitor: “Resistance: 94,800-95,500. Support:
92,000 going down to 90,000. Major downside invalidation below 88,000.” He
warns that “a clean breakout and hold above the trendline could shift
short-term structure bullish. Rejection here keeps BTC in a range-to-bearish
continuation setup.”
Despite the
bullish momentum, Bitcoin remains below its 200-day exponential moving average,
which resides above $103,000 and represents the separator between uptrend and
downtrend. My
bearish scenario targets $74,000, representing 2025 yearly lows last tested
in April and confirmed by the 161.8% Fibonacci extension.
If you like my work, please also check previous crypto analyses and follow me on X:
Ethereum (ETH) gained 0.7% on
Monday to reach $3,168, with CoinGecko data showing current trading at $3,162.
The second-largest cryptocurrency is testing its fifth consecutive rising
session and three-week highs, breaking above its 50-day exponential moving
average for the first time in nearly a month. Below is how I see it.
Why Ethereum
price is going up today? Source: Tradingview.com
Ethereum’s Technical Position:
The price
has stopped at local resistance around the 50% Fibonacci retracement level near
$3,200, which coincides with resistance formed by local lows from early
November. This represents a critical juncture, as Ethereum briefly traded close
to $3,010 at the start of 2026 before accelerating higher.
However,
medium-term technical factors remain bearish. Both
moving averages formed a death cross pattern in late November, and the
price continues moving below the 200-day EMA. The main resistance zone between
$3,350 and $3,400 remains untouched, representing a formidable barrier for
bulls.
Ethereum is
consolidating between this upper resistance zone and support defined by
November-December lows in the $2,650-$2,800 range, reinforced by the 61.8%
Fibonacci retracement.
In a
sideways movement, price can move both up and down, but the overall my chart
structure suggesting continuation of declines targets June lows at $2,200 and
ultimately 2025 yearly minimums around $1,400 last tested in April.
XRP is trading at $2.14,
marking its fifth consecutive rising session and the highest value since early
December. The cryptocurrency gained over 2% during Monday’s session, with
intraday highs testing $2.16 before pulling back slightly.
Why XRP
price is going up today? Source: Tradingview.com
The
positive development for XRP is its breakout from the bearish regression
channel drawn from July highs, which had been tested multiple times from both
below and above. This dynamic breakout saw the price distance itself
significantly from the channel, providing technical confirmation that selling
pressure may be exhausting.
|
Level |
Significance |
Status |
|
$2.35 |
200 EMA (ultimate confirmation) |
Not reached |
|
$2.20-$2.30 |
Resistance zone (breakout confirmation) |
Testing |
|
$2.14 |
Current price |
Fifth rising session |
|
$1.80-$1.83 |
Consolidation support |
Holding |
|
$1.61 |
April minimums (bear target) |
Risk level |
|
$1.25 |
Extreme scenario |
However,
caution is warranted. A similar breakout was observed in early October, but the
price subsequently returned to the channel range. The ultimate confirmation of
the breakout requires XRP to return above the resistance zone between $2.20 and
$2.30, and most importantly above the 200 EMA at $2.35.
XRP remains
in a trend structure similar to Bitcoin and Ethereum, moving below the 200 EMA
(downtrend) and in a consolidation drawn since late November at medium-term
lows.
Until the
breakout is confirmed, the possibility remains of a return to the lower
consolidation boundary with support at $1.80-$1.83.
If you want to trade Bitcoin, XRP and others, check out the 5 best CFD crypto brokers in 2026.
Dogecoin (DOGE) experienced
four consecutive days of gains, testing the highest level since late November
before pulling back 1.2% to $0.1477 at the time of writing.
The meme
coin has stopped at the upper boundary of its current consolidation at the
lowest levels since October 2024.
Why Dogecoin
price is going up today? Source: Tradingview.com
Dogecoin Technical Structure:
This
resistance level coincides with the 50 EMA and minimums from June, April, and
March 2025. The lower consolidation boundary is defined by lows from the turn
of 2025/2026 around $0.11-$0.12.
The meme
coin resurgence extends beyond Dogecoin. Market data shows renewed interest in
Shiba Inu and Pepe, with the broader meme coin sector experiencing a
retail-driven rally in early 2026 after languishing through much of 2025.
If current
resistance at $0.15 holds, my favored scenario is a downward movement and
retest of the $0.11 area, or
even $0.10 representing 2025 yearly minimums from the October flash crash.
Crypto is
surging due to year-ahead portfolio positioning, Q4 2025 sentiment reset
completion (deleveraging and excess froth clearing), meme coin sector
resurgence, strong fundamentals in infrastructure evolution, and stablecoin
liquidity growth. Kozyakov from Mercuryo notes investors are adding
“digital gold” to portfolios amid 2026 positioning. Bitcoin,
Ethereum, XRP and Dogecoin all posted fifth consecutive rising sessions on
January 5, 2026.
Bitcoin
tested $93,155 intraday, representing one-month highs, as traders positioned
for 2026 amid improved sentiment. The rally tests critical resistance at
$94,800-$95,000 where descending trendline and 50 MA converge, according to
Areeb Khan from Traders’ Hub. Joel Kruger identifies sustained hold above
$95,000 as key technical signal for broader uptrend resumption toward record
highs.
Ethereum’s
fifth rising session brought price to $3,168, testing 50% Fibonacci retracement
at $3,200 after breaking above 50 EMA for first time in nearly a month.
However, death cross remains active since late November, and major resistance
zone at $3,350-$3,400 stays untouched.
XRP gained
over 2% to test $2.16 intraday (fifth consecutive rising session), reaching
highest levels since early December after breaking bearish regression channel
from July highs. However, confirmation requires sustained move above
$2.20-$2.30 resistance and 200 EMA at $2.35, as similar October breakout proved
false.
Dogecoin
broke bearish regression channel dynamically, testing $0.1477 at upper
consolidation boundary representing late November highs. Mercuryo’s Kozyakov
notes meme coin sector experiencing resurgence with Shiba Inu and Pepe leading
2026 entry. However, resistance at $0.15 (50 EMA) remains untested with risk of
return to $0.11-$0.12 support zone.
Technical
analysis shows Bitcoin, Ethereum and XRP still in consolidation below 200 EMAs
with death crosses active for Bitcoin and Ethereum since late November. Kruger
from LMAX characterizes the Q4 pullback as a “healthy reset” that
unwound overleveraged positions and improved market structure, but sustained
breakouts above key resistance levels are needed for trend reversal
confirmation.
1: Why could Dogecoin hit a new low in early 2026?
Dogecoin faces pressure from weak market liquidity, high interest rates, fading hype, and selling risk from large holders.
2: Does Bitcoin affect Dogecoin price movement?
Dogecoin usually follows Bitcoin trends, and a weak Bitcoin market often leads to deeper losses for meme coins.
3: Is Dogecoin still popular among investors?
Dogecoin still has a strong community, but investor interest has slowed compared to earlier hype-driven cycles.
4: How does Dogecoin supply impact its price?
Dogecoin has no fixed supply cap, so new coins enter the market each year, adding ongoing selling pressure.
5: What could help Dogecoin avoid a new low?
A strong crypto market recovery, interest rate cuts, renewed hype, or large buying activity could support the price.


