The main category of Crypto News.
You can use the search box below to find what you need.
[wd_asp id=1]
The main category of Crypto News.
You can use the search box below to find what you need.
[wd_asp id=1]
Bitcoin (BTC), Ethereum (ETH), and Ripple (XRP) begin the week on a cautious note, trading near their respective support levels. Market sentiment remains fragile following last week’s volatility, with BTC, ETH, and XRP correcting by nearly 10%, 14%, and 7%, respectively. If these three cryptocurrencies hold their support levels, BTC, ETH, and XRP could extend their recoveries.
Bitcoin price faced rejection at the 38.20% Fibonacci retracement level at $106,453 (drawn from the April 7 low of $74,508 to the all-time high of $126,299 set on October 6) last week and declined nearly 10%. At the time of writing on Monday, BTC hovers around $95,300.
If BTC finds support around the 61.8% Fibonacci retracement level at $94,253, it could extend the recovery toward the 38.20% Fibonacci retracement level at $106,453.
The Relative Strength Index (RSI) on the daily chart is 33, rebounding from oversold territory, suggesting fading bearish momentum. For the recovery rally to be sustained, the RSI must move above its neutral level.
On the other hand, if BTC closes below the $94,253 support level, it could extend the decline toward the key psychological level of $90,000.
Ethereum price faced rejection at the previous broken trendline around $3,592 last week and declined by nearly 14%. At the time of writing on Monday, ETH hovers around $3,100.
If ETH finds support around $3,017, it could extend the recovery toward the key resistance level at $3,592.
Like Bitcoin, Ethereum’s RSI is rebounding from oversold territory, suggesting fading bearish momentum and early signs of recovery.

However, if ETH closes below $3,017, it could extend the decline toward the next key support at $2,749.
XRP price found rejection from the 50-day EMA at $2.49 last week and declined nearly 7%. At the time of writing on Monday, XRP hovers around $2.25.
If XRP continues its recovery, it could extend the rally toward the 50-day EMA at $2.49.
The RSI on the daily chart is 42, near its neutral level of 50, suggesting fading bearish momentum. For the recovery rally to be sustained, the RSI must move above the neutral level.

However, if XRP continues its correction, it could extend the decline toward the next daily support at $1.96.
SOL Solana price sits at a pivotal zone between macro strength and short-term weakness, with participants watching the $144–$150 region closely to see whether a breakout forms or deeper downside opens.
The Solana price is entering a tense phase where both bulls and bears are engaging in a fight. Although the price has cooled off recently, the bigger picture still leans bullish, with a long consolidation forming right under major resistance. Participants now want to know whether this pause is just a shakeout or the final squeeze before a much larger breakout.
Solana continues to hold a broader bullish structure on the macro chart, where a clear rounded-base formation is developing beneath a long-standing resistance band. Price has repeatedly tested the same supply zone, showing compression that typically precedes a major breakout. The longer this consolidation stretches under the ceiling, the more energy builds for the next impulsive leg higher.
Solana holds a firm macro structure with a rounded-base setup despite short-term pullbacks. Source: Jesse Peralta via X
Short-term, however, Jesse Peralta’s chart leaves room for dips. Structure has pulled back from the upper resistance line, and a retest of the rising trendline or mid-range levels can still unfold before any macro continuation. Even with these near-term fluctuations, the underlying setup remains constructive as analyst highlights that prolonged consolidation here would translate into a stronger breakout when it finally triggers.
Solana’s liquidity data paints a straightforward picture: heavy short positioning is stacked around the $150 zone, creating a wall that continues to cap upside attempts. Solana Price has been grinding just below this block, with visible liquidity clusters waiting to be taken if buyers manage to push through. These pockets often act as magnets, setting up a high-probability reclaim if momentum returns.

Liquidity shows heavy short positioning around $150, creating a major resistance wall for SOL. Source: CW8900 via X
Below current price, liquidity thins quickly, leaving only light absorption zones and suggesting that most of the battle is above, not below. A clean sweep of the $150 level could force short closures and accelerate the price back towards previous ranges. Until then, Solana remains pinned under one of its most important short-term resistance areas.
Ali Martinez’s shared Solana on-chain realized distribution exposes a concerning gap beneath $144, where very little historical demand sits. If price loses this level decisively, the SOL chart opens into a low-volume zone that stretches far lower, with the next meaningful concentration of buyers not appearing until much deeper levels. This makes the $144–$150 region more critical than it initially appears.
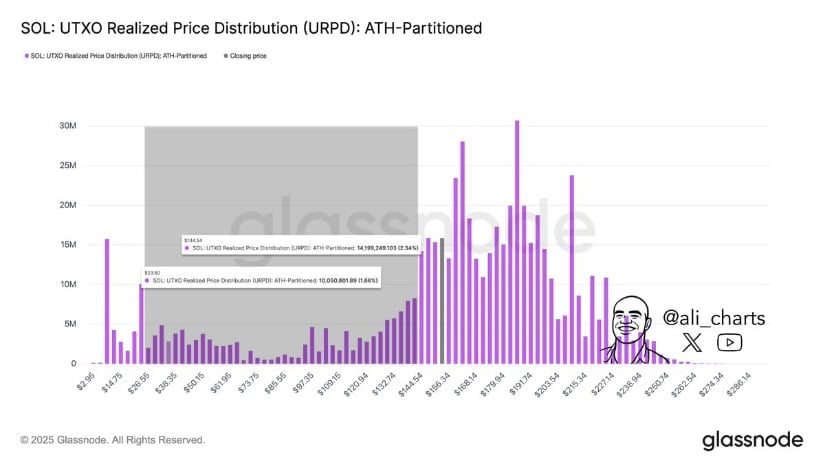
On-chain data reveals a demand gap below $144, making current support levels crucial for SOL. Source: Ali Martinez via X
Despite this bearish perspective, strong inflow periods earlier in the cycle still support the idea that Solana has retained committed holders above key levels. But the on-chain void cannot be ignored, it simply means defending current support becomes absolutely necessary to avoid a momentum vacuum to the downside.
Solana price continues to move inside a corrective wave structure, with lower highs and steady rejections confirming the downward bias. The push towards the mid-$130s keeps the chart vulnerable, especially while price struggles to reclaim overhead resistance aligning around the $160 to $177 range. This ceiling has repeatedly shut down bullish attempts and remains the line that must break to neutralize the downtrend.
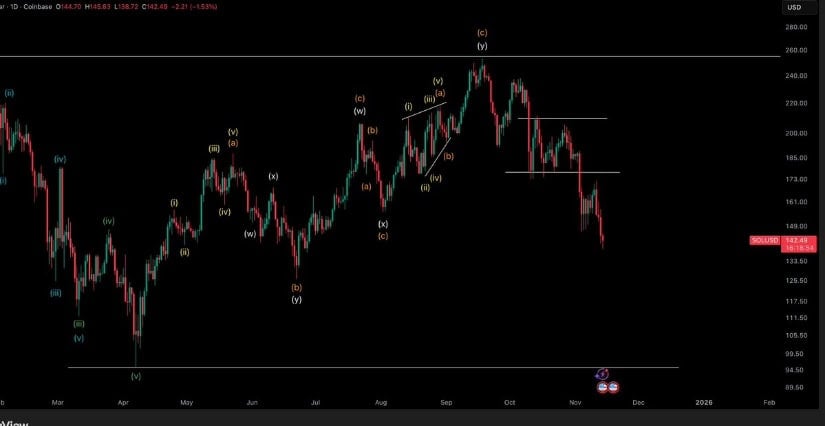
Corrective structure and lower highs keep bearish pressure intact for SOL, with $95 still on the table. Source: Crypto Tony via X
With SOL’s downside targets still open, a grind towards the $95 zone remains possible if selling pressure persists. Support tests continue to weaken, and until the trendline breaks upward or structure confirms a higher low, rallies are likely to face heavy supply. Reclaiming $177 flips momentum; anything below it keeps the bearish scenario active.
Solana price now sits at a decisive point where macro strength meets short-term pressure. Liquidity dynamics, on-chain gaps, and corrective patterns all introduce caution, yet the larger structure still hints at a powerful breakout once consolidation resolves. The next major reaction around $144 to $150 will determine whether SOL stabilizes for continuation or sinks into a deeper retracement.
Analysts at JPMorgan have pinpointed the lowest point of the ongoing Bitcoin (CRYPTO: BTC) price fall and also projected a substantial challenge to gold’s market capitalization by 2026.
What Happened: Bitcoin’s price experienced a steep decline to slightly above $94,000 per Bitcoin this week from a peak of $126,000 in October.
Nonetheless, analysts at the JPMorgan have determined the Bitcoin price floor, asserting that a $94,000 production cost suggests a very limited downside to the current Bitcoin price.
In addition, a team of JPMorgan analysts, headed by managing director Nikolaos Panigirtzoglou, restated a 2026 Bitcoin price forecast that could witness Bitcoin posing a challenge to gold’s $28.3 trillion market cap, reports the Forbes.
They highlighted that the Bitcoin-to-gold volatility ratio has trended downwards, indicating a potential Bitcoin price of nearly $170,000 in 2026.
This year, gold has soared to a market cap of $28.3 trillion, significantly outperforming Bitcoin’s $1.9 trillion. However, JPMorgan analysts are of the view that this signifies a considerable upside for Bitcoin in the coming 6-12 months.
Also Read: Bitcoin Tumbles Deeper Into Bear Territory, Hard-Won Rally Could Be On Verge Of Vanishing
Despite the recent fluctuations in Bitcoin’s price, several Bitcoin and crypto market observers continue to hold a positive outlook.
As per the outlet, Zhong Yang Chan, the head of research at CoinGecko, cited encouraging factors such as the expansion of Bitcoin and ETFs, crypto treasury companies, adoption of stablecoins, and Wall Street’s drive towards asset tokenization as bolstering the Bitcoin price.
Why It Matters: The prediction from JPMorgan analysts comes at a time when Bitcoin and other cryptocurrencies are increasingly being recognized as legitimate forms of investment. The potential challenge to gold’s market cap underscores the growing acceptance and adoption of Bitcoin and other digital assets.
With the increasing integration of cryptocurrencies into mainstream finance, the predicted price surge could significantly impact the global financial landscape.
Read Next
Robert Kiyosaki Predicts Bitcoin Will Soar to $250,000
Up Next: Transform your trading with Benzinga Edge’s one-of-a-kind market trade ideas and tools. Click now to access unique insights that can set you ahead in today’s competitive market.
This article JPMorgan Forecasts Bitcoin Bottom, Anticipates $28.3 Trillion Challenge To Gold By 2026 originally appeared on Benzinga.com
© 2025 Benzinga.com. Benzinga does not provide investment advice. All rights reserved.
Dogecoin (DOGE) is once again in the spotlight, drawing attention from traders and investors curious whether this meme-driven cryptocurrency can sustain gains amid a cautious market recovery.
As of November 16, 2025, TradingView data shows DOGE trading around $0.16 with rising daily volume. While some speculation mentions a surge to $3.60, current technical indicators and historical patterns suggest such levels are highly unlikely without major market catalysts. Investors are focusing on verifiable trends, including support and resistance levels, momentum indicators, and community activity, to navigate the cryptocurrency’s inherent volatility responsibly.
Recent market charts from TradingView indicate Dogecoin has maintained support above $0.164, reclaiming a previously descending trendline that may suggest the early stages of a bullish reversal.
Dogecoin is currently showing a weekly sell signal, and bullish momentum is needed to reach the $1.00+ target. Source: @Shan_Specter via X
Shan Specter, a crypto market analyst active since 2016 and contributor to CoinMetrics research, notes:
“DOGE could approach $1 if sustained trading interest and community engagement continue. Short-term fluctuations are expected, but support levels around $0.16 remain critical for maintaining stability.”
Technical tools support this cautious outlook. A bullish Relative Strength Index (RSI) divergence—where DOGE price forms lower lows while RSI forms higher lows—signals reduced selling pressure and potential accumulation. The Gaussian Channel (3-day) indicates that dips below the lower band historically precede short-to-medium-term recoveries. A confirmed upward move would require a breakout above $0.168. Conversely, a failure to hold $0.16 could trigger sharp retracements toward historically lower liquidity zones.
Community sentiment remains polarized. Optimists point to historical endorsements from public figures and potential platform integrations, such as X, as reasons for bullish expectations. Skeptics caution that extreme price targets, like $3.60, are unrealistic without unprecedented market catalysts.

Dogecoin is showing upward momentum, with speculative talk of reaching $3.60.Source: @_dogegod_ via X
Retail activity continues to drive short-term volatility. Data from CoinGecko shows trading volume often spikes in tandem with social media trends, illustrating how sentiment can generate rapid but transient price swings. Analysts emphasize that recognizing this interplay between social engagement and technical fundamentals is crucial for responsible trading.
Despite early bullish signs, risks remain significant. Ali Charts, a crypto research platform, notes that support below $0.16 is thin, with a liquidity gap extending toward $0.073. Loss of momentum in this zone could trigger sharp declines. Additionally, Dogecoin’s price frequently mirrors broader cryptocurrency trends, especially Bitcoin’s performance, due to the predominance of retail traders.
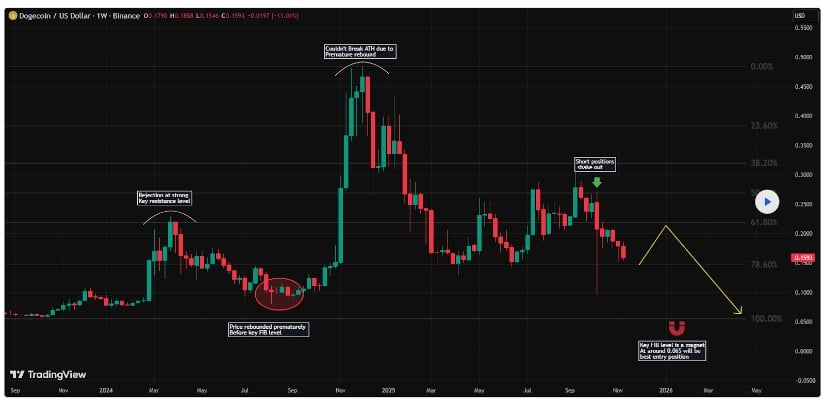
Dogecoin may experience a short-term rise, but a key Fibonacci level at $0.06 is considered the safest entry before any significant upward move. Source: Crypto-Shrimp on Tradingview
Investors must consider macro factors—such as BTC price movements, global market sentiment, and potential regulatory shifts—when evaluating DOGE risk. Technical signals are conditional and cannot guarantee outcomes; all projections should be treated as probabilistic, not definitive.
For the remainder of 2025, analysts recommend focusing on realistic technical and market indicators rather than sensationalized price targets. Short-term resistance near $0.18 aligns with recovery trends, while extreme projections like $3.60 remain highly unlikely without major catalysts.
Key factors to monitor in the next 1–2 weeks include:
Support levels: Holding $0.16 is crucial to prevent sharp corrections.
Trading volume: Sustained buying interest can validate recovery patterns.
Community sentiment: Positive engagement may influence short-term momentum but remains volatile.
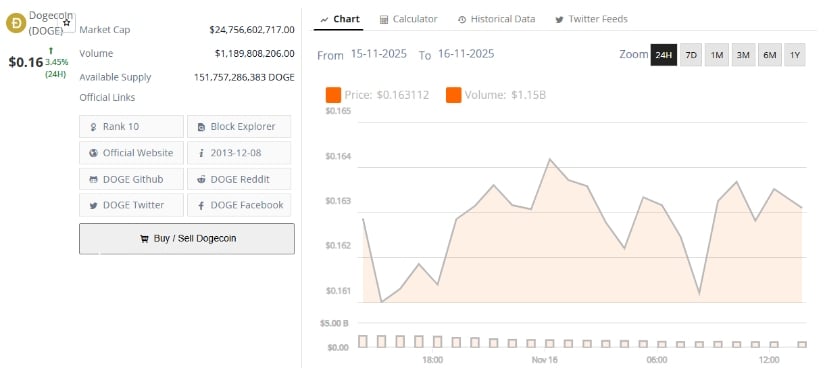
Dogecoin was trading at around $0.16, up 3.45% in the last 24 hours. Source: Brave New Coin
Dogecoin continues to generate market attention, but its trajectory is best understood through a combination of technical analysis, trading activity, and market fundamentals. Informed strategies and risk management remain essential when navigating this highly speculative, sentiment-driven cryptocurrency.
XRP whale activity has surged to a four-month high, signaling growing institutional interest and hinting at potential market movements that could influence XRP price and trading sentiment.
Recent data shows 716 XRP transactions exceeding $1 million alongside a $768 million accumulation by large holders, highlighting strategic positioning in the market. Analysts suggest that such concentrated activity often precedes short-term volatility, making XRP one of the most closely monitored cryptocurrencies this week.
XRP price has dipped slightly, trading at $2.24 as of November 15, 2025, down 1.61% over the past 24 hours. According to CoinMarketCap data, XRP’s market capitalization stands at $135.33 billion, while trading volume has declined to $3.26 billion, a 56.5% drop from previous periods.
$2.26 (−0.61%), Market Cap $136.3, 24h Volume $3.02B, 489K holders, Supply 99.98B/100B XRP. Source: CoinMarketCap
Despite this downturn, analysts point to short-term bullish signals that could influence XRP’s trajectory. A TD Buy signal recently appeared on the XRP chart, suggesting a potential rebound as the weekend approaches. While the market remains in a consolidation phase, the signal hints at an opportunity for upward movement if support levels hold.
A notable development in XRP news today is the surge in whale activity. Data from Santiment, highlighted by analyst Ali Charts, shows 716 XRP transactions exceeding $1 million, marking a four-month peak. This spike in large transactions corresponds with market stability around $2.20, suggesting strategic positioning by institutional and high-net-worth holders.

XRP has hit a four-month high with 716 whale transactions exceeding $1 million each, signaling heightened institutional activity. Source: Ali Martinez via X
BeInCrypto reports that these whales have collectively accumulated $768 million worth of XRP over the past four days. While this accumulation could point to potential upside, analysts caution that simultaneous inflows to exchanges may indicate distribution risks.
From a technical perspective, XRP remains in a descending channel, currently testing support around $2.43. Price recently pulled back from resistance at $2.55, forming a consolidation pattern that may indicate pent-up buying pressure. Analysts tracking moving averages and Fibonacci retracement levels highlight several bullish indicators:
Blue moving average above red: Suggesting a continuation of an upward trend.
Fibonacci retracement at 38.2%: Price rebounded from this support level, a common zone for trend reversals.
MACD above zero: Indicating stronger buyer momentum.
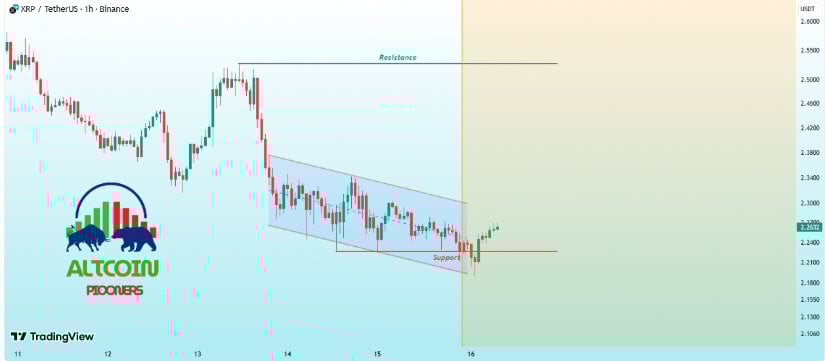
XRP tests $2.43 support in a descending channel; holding may spark a bounce to $2.52–$2.65; a breach risks $2.35. Source: AltcoinPiooners on TradingView
Should the weekly candle close above the green support zone, XRP could see an upside move toward $2.52, with potential resistance levels at $3.66, $4.12, and $4.71 based on Fibonacci extensions and higher-timeframe structure.
Analysts remain cautiously optimistic about XRP’s near-term prospects. While short-term volatility is possible, the combination of whale accumulation, technical support, and TD Buy signals presents a favorable setup for potential upside.
XRP’s recent whale activity and accumulation trends indicate growing institutional interest, making it one of the most closely watched cryptocurrencies this week. While the market has experienced short-term weakness, the combination of TD Buy signals, technical support levels, and large whale movements suggests that XRP may be poised for a rebound.
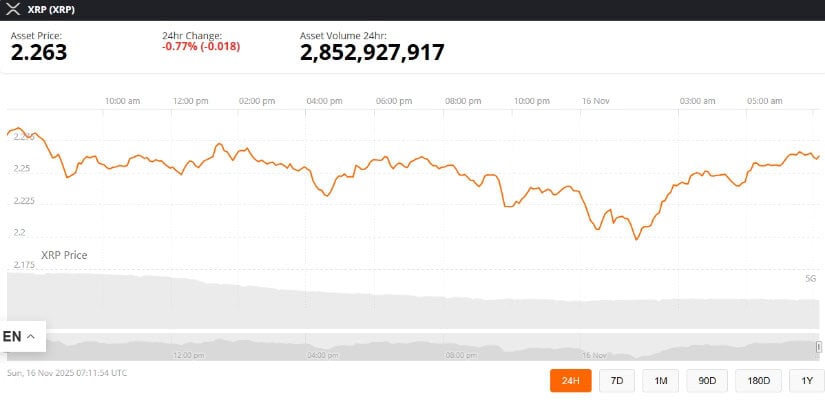
XRP was trading at around 2.26, down 0.77% in the last 24 hours at press time. Source: XRP price via Brave New Coin
Investors should remain cautious and monitor both the XRP price today and regulatory developments, including any updates related to the XRP SEC case, as these factors could significantly influence the token’s trajectory.
Overall, the current market conditions highlight the potential for XRP price growth but also emphasize the importance of risk management given ongoing volatility. Traders and long-term holders alike may find opportunities in XRP’s near-term consolidation and possible breakout scenarios.
Interest in Solana price prediction has risen sharply this week as traders reassess momentum across major altcoins even as new Solana predictions point to sub $100. The market is shifting toward projects with clear utility, especially those offering payments-driven use cases.
While Solana continues to hold its position among large-cap networks, some investors are taking note of alternatives gaining traction in the PayFi sector.
Remittix (RTX) https://remittix.io is one of those names appearing more frequently in discussions as users search for solutions built for real transactions rather than speculation. This shift is also influencing how traders compare Solana’s stability to the narrative forming around Bitcoin Hyper and other high-volume tokens.
Solana Price Prediction Trends as Trading Volume Drops
Solana is selling at $142.64, a significant drop of 0.74% over the last 24 hours, with a market cap of $78.98 billion, while trading volume has declined sharply to $3.91 billion, a drop of more than 60%.
This cooling volume is shaping the latest Solana Price Prediction outlook, especially as volatility rises across major assets.
Bitcoin Hyper, which is mostly tracked in companies with high-activity altcoins, trades at $38.82 after adding 3.55% in price. Its volume has slipped to $321.65 million, down 46.87%, showing similar cooling pressures.
This divergence between price and volume is driving new conversations about market rotation, and it explains why some traders are shifting into projects offering clearer real-world functions instead of purely market-driven cycles.
Why Remittix Is Standing Out in a Shifting Market
As trading slows for Solana and Bitcoin Hyper, Remittix https://remittix.io is becoming a stronger talking point due to its utility-focused design. The token, priced at $0.1166, continues to attract interest after raising over $28 million from private funding and distributing more than 685 million tokens.
By offering a more straightforward way to move between crypto and fiat, the platform enables users to transfer digital assets directly into bank accounts within over 30 countries.
Remittix is also opening access through its Beta Wallet testing, now available for more iOS users. It admits the top 10 buyers every week, ensuring a tight feedback loop to expedite product refinement.
The community has become more active after two major announcements: forthcoming future listings on BitMart and LBANK, announced upon hitting key funding milestones. A big boost in credibility came with the verification by CertiK, which for the first time ranked Remittix as #1 among pre-launch tokens, a further manifestation of confidence in the technology and team.
The Advancements Pushing Remittix Into the Spotlight:
● Verified #1 by CertiK for pre-launch security
● Crypto-to-bank transfers across 30+ supported countries
● Beta Wallet expansion for active community testers
● Future listings confirmed on BitMart and LBANK
Market Outlook – A New Direction for Utility-Driven Assets
The latest Solana Price Prediction cycle shows how quickly sentiment can shift when volume fades. Bitcoin Hyper traders are tracking similar patterns.
But utility-driven tokens like Remittix illustrate where many investors see long-term relevance forming, especially with clear payment infrastructure, verified security, and active ecosystem growth. The next wave of interest may favor exactly this type of real-use asset.
Discover the future of PayFi with Remittix by checking out their project here:
Website: https://remittix.io/
Socials: https://linktr.ee/remittix
$250,000 Giveaway: https://gleam.io/competitions/nz84L-250000-remittix-giveaway
Disclaimer: This article is for informational purposes only and does not constitute financial advice. Cryptocurrency investments carry risk, including total loss of capital. Readers should conduct independent research and consult licensed advisors before making any financial decisions.
Crypto Press Release Distribution by https://btcpresswire.com
This release was published on openPR.
Ethereum enters the new trading week at a fragile point, with the price hovering around $3,160 after a slight 0.16% gain in the last 24 hours. As the second-largest cryptocurrency with a $381.6bn market cap, ETH is now squeezed inside one of its most important technical structures of 2024–2025: a broad symmetrical triangle that has been contracting since the August highs.
What makes this moment pivotal is the convergence of two major trendlines. The long-term rising trendline that originated from the April breakout continues to act as structural support, while a firm descending trendline has rejected every rally for nearly three months. ETH is sitting directly at this apex, a point where markets rarely stay neutral for long.
The recent candles reflect this uncertainty.
Long lower wicks indicate buyers are defending the $3,060 demand zone, while small-bodied recoveries signal hesitation near the descending trendline. The 20-day EMA has also turned lower, creating dynamic resistance that sellers continue to lean on.
ETH’s momentum profile leans bearish, with the RSI sitting at 34, firmly below midline but not yet forming bullish divergence. This means price and momentum are aligned to the downside, not working against each other, a sign that sellers are still influencing direction.
Historically, ETH has staged recoveries from similar RSI levels, but only when paired with a firm reaction at trendline support.
Key near-term technical levels include:
ETH’s positioning inside the triangle suggests that a decisive move is close. If buyers manage to hold $3,060 and print a bullish engulfing candle, the first upside target becomes the triangle’s upper boundary near $3,485, followed by the critical $3,653 level that would formally flip the bearish structure.
A breakout here would allow ETH to reclaim the 20-day EMA, retest the trendline from above, and potentially accelerate toward $4,242—a major resistance shelf.
Ethereum price prediction seems neutral as symmetrical triangle is in play. A clean breakdown below $3,060 would snap the long-term rising trendline, exposing ETH to a deeper pullback into $2,632 and then $2,192, the next two liquidity pockets on the daily chart.
Given how tightly ETH is currently compressed, any violation of support could trigger a fast, momentum-driven move.
But if ETH reclaims $3,653, the narrative flips instantly. That level represents both structural reversal and a psychological shift back in favor of buyers. A close above it would confirm a bullish breakout from the triangle, setting the stage for a renewed uptrend.
Bitcoin Hyper ($HYPER) is bringing a new phase to the Bitcoin ecosystem. While BTC remains the gold standard for security, Bitcoin Hyper adds what it always lacked: Solana-level speed. The result: lightning-fast, low-cost smart contracts, decentralized apps, and even meme coin creation, all secured by Bitcoin.
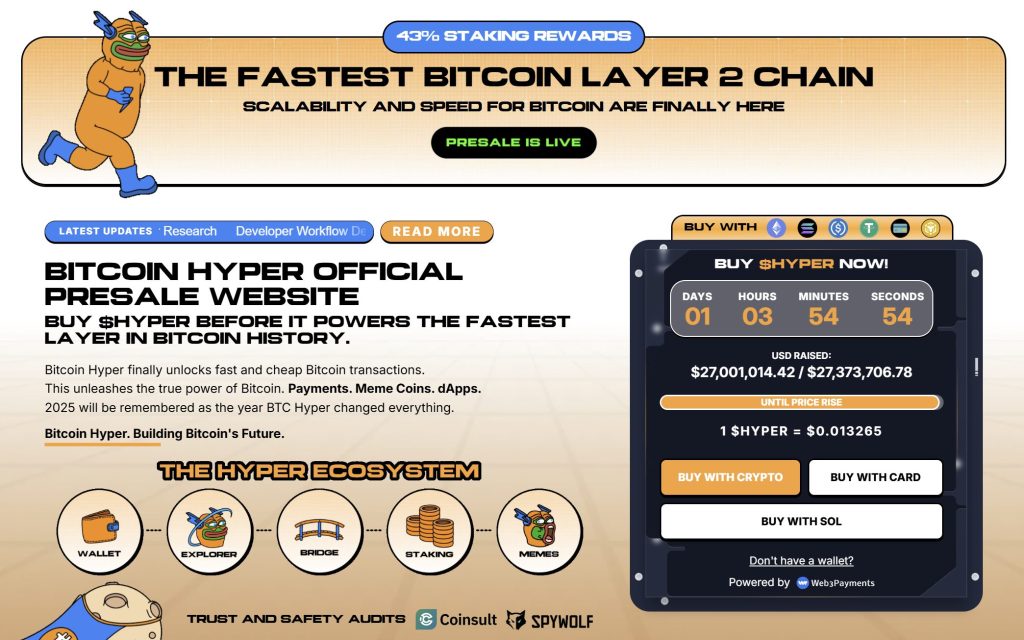
Audited by Consult, the project emphasizes trust and scalability as adoption builds. And momentum is already strong. The presale has surpassed $27 million, with tokens priced at just $0.013265 before the next increase.
As Bitcoin activity climbs and demand for efficient BTC-based apps rises, Bitcoin Hyper stands out as the bridge uniting two of crypto’s biggest ecosystems. If Bitcoin built the foundation, Bitcoin Hyper could make it fast, flexible, and fun again.
Click Here to Participate in the Presale
The post Ethereum Price Prediction: ETH Must Reclaim $3,653 to Flip Bearish Structure appeared first on Cryptonews.
Zach Anderson
Nov 15, 2025 15:37
MATIC price prediction shows potential for 18-92% gains targeting $0.45-0.73 range despite bearish momentum, with key resistance break at $0.43 needed for bullish confirmation.
Polygon’s native token MATIC is showing signs of potential recovery despite recent bearish momentum, with multiple analysts projecting significant upside in the coming weeks. Our comprehensive MATIC price prediction analysis reveals a complex technical setup that could deliver substantial gains for patient investors.
• MATIC short-term target (1 week): $0.45 (+18.4% from current $0.38)
• Polygon medium-term forecast (1 month): $0.45-$0.73 range (+18% to +92%)
• Key level to break for bullish continuation: $0.43 (SMA 20 resistance)
• Critical support if bearish: $0.33 (strong support level)
The latest Polygon forecast from multiple sources presents an intriguing divergence in analyst sentiment. Changelly maintains a conservative MATIC price target of $0.163, suggesting further downside risk. However, this contrasts sharply with PricePredictions.com’s bullish projection of $0.732773, representing a potential 92% gain from current levels.
CoinArbitrageBot’s AI-driven analysis points to $0.22541 as a near-term target, while Blockchain.News identifies $0.45 as a realistic short-term objective based on technical recovery patterns. The wide range in predictions reflects the current uncertainty in MATIC’s price action, but the majority lean toward eventual recovery.
The market consensus appears cautiously optimistic, with three out of four predictions suggesting upside potential. This divergence creates an opportunity for traders who can accurately time the technical breakout.
Current Polygon technical analysis reveals MATIC trading at a critical juncture. At $0.38, the token sits just above its 52-week low of $0.37, indicating we may be near a significant bottom formation.
The RSI reading of 38.00 places MATIC in neutral territory, suggesting the oversold pressure from earlier declines has begun to ease. While the MACD histogram shows -0.0045 bearish momentum, this negative reading has been diminishing, potentially signaling momentum exhaustion.
MATIC’s position within the Bollinger Bands is particularly telling. With a %B position of 0.2879, the token trades in the lower portion of the bands, but well above the lower band at $0.31. This suggests selling pressure may be moderating without indicating immediate oversold conditions.
The moving average structure presents the primary challenge for any Polygon forecast. MATIC trades below all major moving averages, with the SMA 20 at $0.43 serving as immediate resistance. However, the proximity of the 7-day SMA at $0.37 to current price suggests short-term momentum could shift quickly with any buying pressure.
Our optimistic MATIC price prediction centers on a breakout above the $0.43 resistance level (SMA 20). Success here would likely trigger momentum toward the $0.45 level identified by multiple analysts, representing an 18% gain.
Beyond $0.45, the next significant target aligns with the SMA 50 at $0.45, followed by the upper Bollinger Band at $0.56. The most ambitious MATIC price target of $0.73 would require sustained buying pressure and broader crypto market recovery.
For this bullish scenario to unfold, MATIC needs to see daily trading volume exceed the current $1.07 million, preferably reaching $2-3 million to confirm institutional interest. Additionally, the RSI would need to break above 50, confirming momentum shift from bearish to bullish.
The bearish case for our MATIC price prediction involves a break below the critical $0.35 support level. This would expose the strong support at $0.33, and failure here could target the 52-week low near $0.31.
A decline to these levels would align with Changelly’s conservative prediction of $0.163, though such a move would likely require broader crypto market deterioration. The lower Bollinger Band at $0.31 represents a technical floor, but breakdown below this level could accelerate selling toward $0.25.
Traders should monitor the MACD for further deterioration and watch for RSI breaks below 30, which would confirm oversold conditions and potential for further decline.
Based on our Polygon technical analysis, the current risk-reward profile suggests a measured approach. Conservative buyers should wait for a confirmed break above $0.43 with volume confirmation before establishing positions.
Aggressive traders might consider accumulating near current levels around $0.38-$0.40, but should implement strict risk management with stop-losses below $0.33. This approach limits downside to roughly 13% while targeting upside of 18-92% based on various analyst predictions.
Position sizing should remain conservative given the technical uncertainty. Consider allocating no more than 2-3% of portfolio to MATIC until clearer directional bias emerges above $0.45 or below $0.33.
Our comprehensive MATIC price prediction suggests a 60% probability of recovery toward $0.45-$0.73 over the next 1-4 weeks, contingent on breaking above $0.43 resistance. The convergence of multiple analyst targets in this range, combined with oversold technical conditions, supports this moderately bullish outlook.
Key indicators to watch for confirmation include RSI breaking above 50, MACD histogram turning positive, and daily volume exceeding $2 million. Invalidation would occur on breaks below $0.33 support, which would shift the Polygon forecast decidedly bearish.
The timeline for this prediction extends through December 2025, with initial signals expected within 7-10 days based on MATIC’s response to the $0.43 resistance test. Whether you buy or sell MATIC should ultimately depend on your risk tolerance and ability to monitor these critical technical levels closely.
Confidence Level: Medium – Technical setup supports potential recovery, but broader market conditions and volume confirmation remain essential variables.
Image source: Shutterstock
The Cardano Price Prediction conversation is heating up as ADA moves toward late 2025 with major ecosystem upgrades and renewed market interest. At the same time, investors are eyeing Remittix, a payment-focused token priced under $1 that offers an alternative growth path within the same broader crypto wave.
While ADA targets protocol frames and DeFi infrastructure, Remittix https://remittix.io targets real-world payments across borders. This piece compares ADA’s outlook with Remittix’s potential and shows why Remittix may stand out among early-stage crypto investment options today.
Cardano Price Prediction: ADA Outlook As Key Benchmark
Cardano currently holds a market cap of $18.2 billion, with daily trading volume exceeding $1.3 billion. ADA trades near $0.51 as the market weighs Cardano’s upcoming Vasil upgrades and staking yields. Technically, ADA has found support around the $0.48 level and faces resistance near $0.55.
Analysts on TradingView note that the weekly RSI is recovering and volume is slowly picking up, suggesting a bullish setup if the breakout holds. Recent news shows Cardano’s network grew 4.2% in active addresses over the past week, reinforcing the ecosystem growth thesis.
According to a report from Santiment, rising development activity has added credibility to the Cardano Price Prediction for late 2025. That said, until ADA breaks above $0.53 with strong volume, gains may remain limited.
Why Remittix Offers A Distinct Payment Angle
Compared with ADA’s broad protocol ambition, Remittix https://remittix.io is highly focused on payments and utility, making it a standout in the upcoming crypto projects space. The Remittix DeFi project is positioned at the intersection of crypto, payments, and global remittance in a $19 trillion market.
It is audited and verified by CertiK and ranked #1 among pre-launch tokens on Skynet, giving it trust credentials that many early tokens lack. Remittix has sold over 685 million tokens, is priced at $0.1166 and has raised over $28 million. Listings on BitMart and LBank are secured after reaching key milestones of $20 million and $22 million raised, and the team is preparing for a third major exchange listing.
The wallet beta is live and community testing is expanding, and the token offers a 15% USDT referral reward paid every 24 hours, plus a $250,000 community giveaway. Investors looking for a top crypto under $1 with a real-world use case should take note of Remittix.
Key Reasons RTX Is Gaining Ground:
● Built for borderless payments with global reach
● Send crypto to real bank accounts in seconds
● Supports many cryptocurrencies and multiple fiat currencies at launch
● Real-time FX conversion with transparent rates
● Audited by CertiK with team verification and ongoing monitoring
Payments-Led Growth Versus Protocol Expansion
The Cardano Price Prediction for late 2025 is modestly optimistic, driven by protocol enhancements and ecosystem growth. Meanwhile, Remittix presents a clear payment-first narrative with live user testing, strong audit credentials and early market traction.
When comparing ADA and Remittix https://remittix.io, the payments angle gives Remittix an edge for those seeking the next big altcoin in 2025. For investors focused on utility, scalability and upside, Remittix is the next 100x crypto candidate to watch as Cardano handles heavier technical upgrade execution.
Discover the future of PayFi with Remittix by checking out their project here:
Website: https://remittix.io/
Socials: https://linktr.ee/remittix
$250,000 Giveaway: https://gleam.io/competitions/nz84L-250000-remittix-giveaway
Disclaimer: This article is for informational purposes only and does not constitute financial advice. Cryptocurrency investments carry risk, including total loss of capital. Readers should conduct independent research and consult licensed advisors before making any financial decisions.
Crypto Press Release Distribution by https://btcpresswire.com
This release was published on openPR.
While short-term volatility remains elevated across the crypto market, XRP’s chart structure and liquidity profile suggest the asset may be entering a critical pre-breakout phase.
XRP is currently trading near $2.31 following several days of moderate selling pressure. FenzoFx’s daily chart data shows a tightening consolidation range between $2.072 and $2.223, an area where XRP historically attracts buy-side interest.
XRP is trading near $2.309 under mild selling pressure, consolidating between $2.072 and $2.223, with a potential short-term rebound toward $2.456 before facing resistance. Source: FenzoFxBroker on TradingView
Accumulation phases typically occur when sellers weaken and long-term holders absorb supply. In XRP’s past cycles—such as April 2021 and July 2023—multi-week accumulation preceded strong directional moves as volatility compressed and liquidity clustered at higher time-frame support.
The current structure exhibits similar characteristics: reduced range expansion, stable funding sentiment, and rising spot volume relative to futures trading.
Although XRP remains within a sideways channel, this pattern can often act as a base for volatility expansion. Still, consolidation does not guarantee an upward breakout, particularly in unstable macro conditions.
Data from Bloomberg ETF analyst Eric Balchunas confirms that Canary Capital’s spot XRP ETF attracted approximately $250 million in launch-day inflows, marking one of 2025’s strongest crypto ETF debuts and signaling early institutional interest in gaining exposure through regulated investment vehicles rather than direct token custody.

$XRPC tops this year’s ETF launches with $58M Day One volume, narrowly beating $BSOL’s $57M and staying well ahead of third place. Source: Eric Balchunas via X
The ETF’s in-kind swap mechanism allows liquidity providers to exchange XRP for ETF shares without relying solely on open-market purchases, which helps reduce slippage during large allocations and can temporarily stabilize order books during periods of inflow. However, this structural feature does not inherently push XRP’s price higher; inflows can reverse, demand fluctuates with overall risk sentiment, and ETFs do not protect investors from the inherent volatility of crypto markets.
While the ETF’s launch represents a meaningful step for institutional access and regulatory clarity, significant uncertainties remain regarding long-term inflow sustainability, broader macroeconomic conditions, and evolving global regulations.
Based on standard daily support and resistance analysis along with recent price action, XRP’s immediate resistance sits at $2.456, while major support is positioned between $2.072 and $2.223, with an additional secondary support area near the liquidity pocket around $1.922.
A move toward the $2.456 resistance would require a clear increase in trading volume and broader market stabilization, whereas failure to break above this level could lead to another retest of the support zones outlined above.
According to Brave New Coin historical index data, XRP has returned an average of ~134% in Q4 across the last 12 years. While this seasonal trend is notable, past performance does not guarantee future results, especially given ongoing macro uncertainty and Bitcoin-driven volatility.
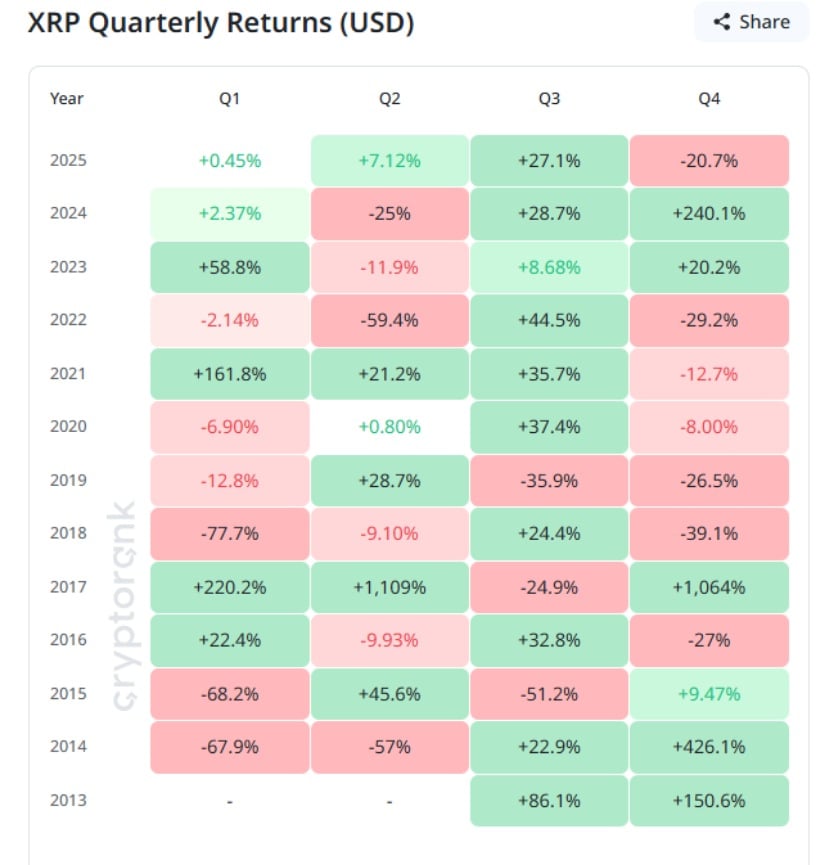
Tracks XRP’s performance each quarter in USD, highlighting trends, volatility, and patterns useful for price analysis and predictions. Source: XRP Quarterly Returns
Additionally, past cycle data—including unrealized loss levels from Glassnode-style on-chain metrics—show that rebounds often follow peak stress periods such as November 2024 and April 2025. However, these indicators are probabilistic, not predictive.
Bitcoin’s recent drop below $100,000 has increased risk-off sentiment across the crypto market. Correlation data from Kaiko shows that XRP remains strongly linked to BTC during macro-driven sell-offs.

XRPUSDT holds $2.24 support amid a downtrend, with resistance at $2.315–$2.4465 and support at $2.153–$2.097; a break below $2.153 may trigger further declines. Source: RLinda on TradingView
If Bitcoin stabilizes, XRP could revisit the $2.41–$2.456 resistance band. If broader weakness continues, XRP is more likely to remain range-bound or revisit lower support.
The introduction of a U.S.-listed XRP ETF carries secondary implications for international markets that are still developing their own digital asset frameworks. Under Pakistan’s provisional Virtual Assets Ordinance 2025 (PVARA), for instance, local investors still cannot directly access U.S. crypto ETFs, and the regulatory framework remains subject to final parliamentary approval.
Even so, the ETF’s approval in the United States may shape how policymakers and financial institutions in other regions perceive XRP’s legitimacy as a regulated asset. This influence is best understood as a reputational shift rather than an immediate change in market access or legal rights for investors outside the U.S.
To make informed decisions, traders and investors may want to monitor several key signals. These include price behavior and volume near the $2.456 resistance level, as a breakout without strong volume often fails, as well as the direction of ETF flows, since sustained inflows typically indicate structural demand while outflows may reflect weakening sentiment.
Bitcoin’s stability around major psychological levels also remains important because XRP has historically struggled during Bitcoin-led corrections. Regulatory developments should be watched closely, as U.S. ETF approvals often influence global policy discussions. Finally, shifts in funding rates and market liquidity depth can reveal whether the market is leaning toward overheated long positioning. Together, these factors help confirm or challenge the prevailing technical outlook.
XRP is navigating a critical consolidation phase supported by strong ETF debut inflows and a well-defined technical base. Resistance remains at $2.456, with key support between $2.072 and $2.223. While historical Q4 performance and ETF-driven attention offer reasons for cautious optimism, risks from broader market volatility and shifting liquidity conditions remain significant.
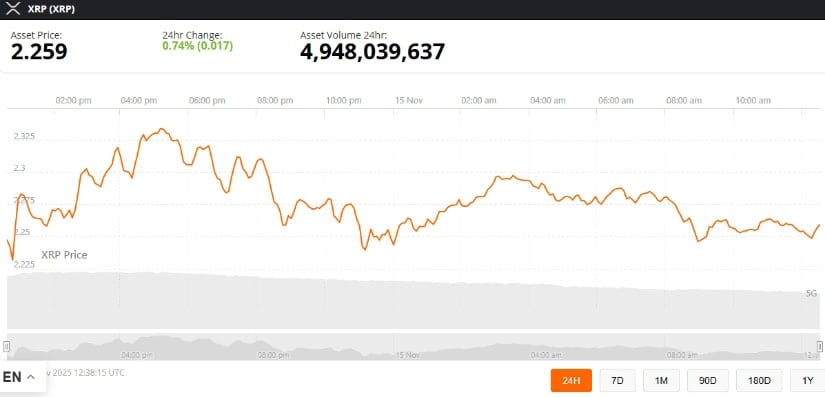
XRP was trading at around 2.25, up 0.74% in the last 24 hours at press time. Source: XRP price via Brave New Coin
Investors should treat technical patterns as probability tools, not guarantees, and continue monitoring both macro trends and ecosystem developments to understand XRP’s evolving market trajectory.


