The main category of Crypto News.
You can use the search box below to find what you need.
[wd_asp id=1]
The main category of Crypto News.
You can use the search box below to find what you need.
[wd_asp id=1]
Dogecoin (DOGE) is holding firm at critical support levels as traders eye a breakout above $0.31, a move that could unlock fresh momentum toward $0.38.
Despite recent volatility, market data shows higher lows since April 2025 and surging trading volume, fueling speculation that Dogecoin may be entering a new phase of accumulation and recovery.
While short-term volatility has shaken retail confidence, long-term Dogecoin predictions remain bullish. Analysts argue that if accumulation continues, DOGE could revisit major highs not seen since 2021.
Dogecoin (DOGE) is consolidating above the $0.23 support level, with $0.31 as key resistance, signaling steady accumulation and growing investor confidence since April. Source: Joe Swanson via X
Crypto expert Crypto Rover has highlighted repeating historical cycles in Dogecoin price. According to his research, each phase of growth has been followed by sharp corrections, yet every cycle has ultimately expanded in scale. This recurring market rhythm suggests a strong foundation for the next rally.
Ether Nasyonal highlighted Dogecoin’s market dominance chart, noting that after years of trading below a descending trendline, DOGE recently broke above it and completed a successful retest. This technical shift is often seen as a bullish indicator, suggesting renewed buyer strength and the potential for further upside momentum.
Institutional interest continues to add fuel to bullish Dogecoin price forecasts. Grayscale recently amended its S-1 filing with the U.S. Securities and Exchange Commission in a bid to convert its Dogecoin Trust into a spot ETF. If approved, the product would be listed on NYSE Arca under the ticker symbol GDOG, with Coinbase serving as the custodian.
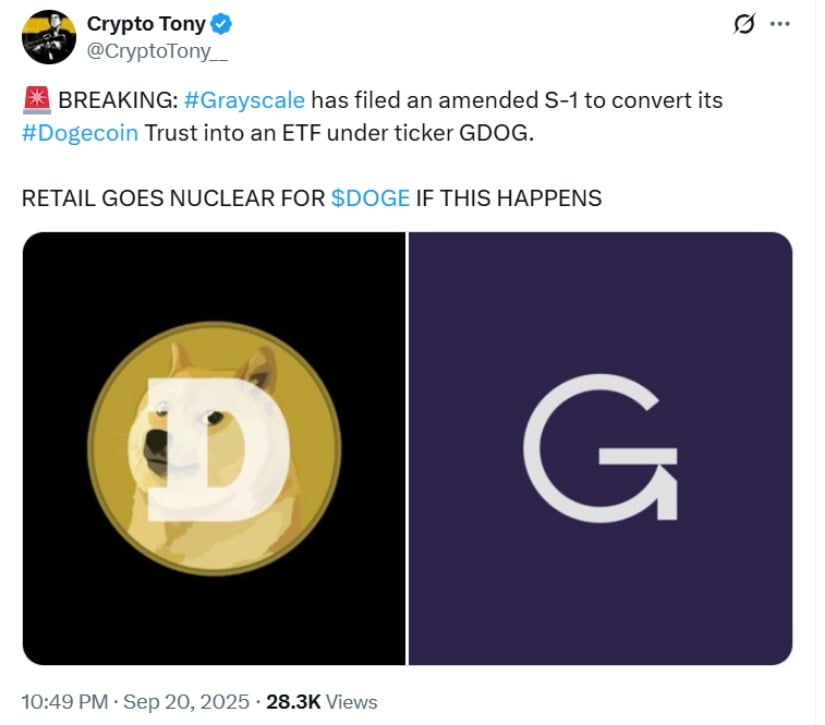
Grayscale filed to convert its Dogecoin Trust into a GDOG ETF. Source: Crypto Tony via X
This move mirrors developments in Ethereum and Bitcoin ETFs, potentially opening the door for Dogecoin to attract institutional capital. Analysts suggest such milestones could boost liquidity and stability, two factors often cited as crucial for the future of Dogecoin.
Despite optimism, Dogecoin price prediction today remains divided. A sharp dip to $0.238 earlier this week underscored how fragile sentiment can be. CoinMarketCap data showed a nearly 10% drop in a single day, with market cap falling to $35.9 billion. Analysts warn that failure to hold above $0.22 could lead to retesting the $0.20–$0.21 accumulation zone.
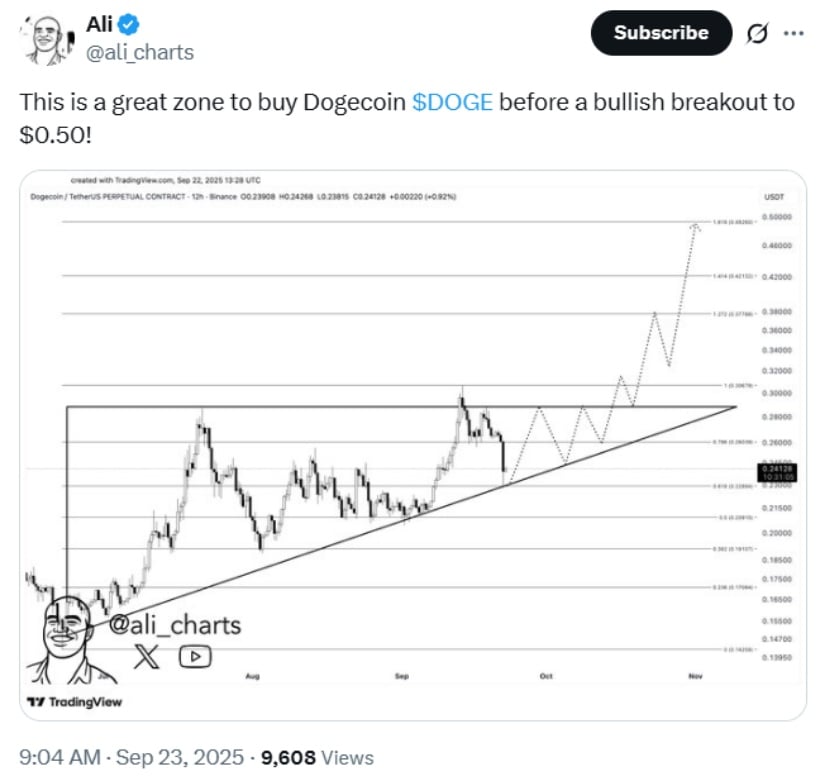
This zone offers an attractive entry for DOGE ahead of a potential breakout toward $0.50. Source: Ali Martinez via X
Still, many traders remain upbeat. Ali Martinez, another crypto analyst, argued, “If DOGE can reclaim the $0.27–$0.28 range, it could rally toward $0.45, a level not seen since late 2021.”
Some long-term Dogecoin predictions go further, with projections for 2025 placing the coin above $0.50 in bullish scenarios. A few forecasts even point to the possibility of DOGE crossing $2 if momentum builds and meme coin ETFs gain traction.
The question of “Will Dogecoin reach $1?” continues to dominate investor discussions. Despite ongoing short-term resistance at $0.31 remaining the largest hurdle, experts agree that DOGE is showing stronger structural support than seen in earlier cycles. Instead of crazy spikes, Dogecoin now appears to be based within more stable zones, suggesting institutional forces might be reshaping its view.
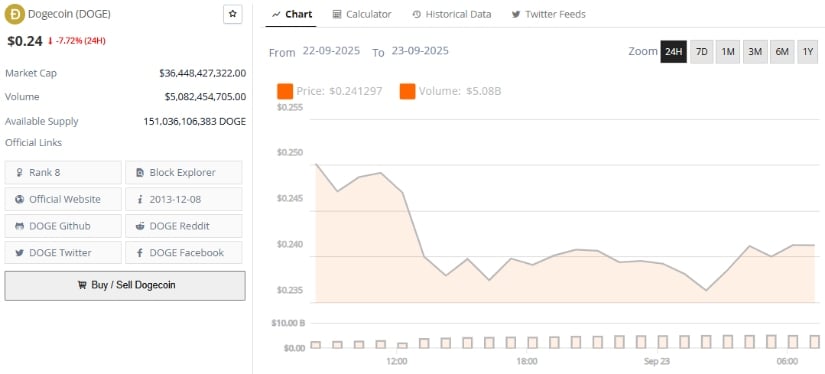
Dogecoin was trading at around $0.24, down 7.72% in the last 24 hours at press time. Source: Brave New Coin
With whale accumulation, rising trading volumes, and ETF speculation in play, the Dogecoin price forecast for the coming months points toward sustained volatility—but also the potential for another rally. Whether DOGE can break resistance and sustain momentum will determine if the 2025 narrative shifts from cautious optimism to full-scale bullish momentum.
Cardano price today is trading near $0.82, down from the $0.84 resistance level after sellers forced a break below key trendline support. The token’s latest slide has erased much of September’s recovery, leaving ADA pinned near its weakest levels in three weeks. The market now faces the question of whether on-chain demand and fresh fundamental catalysts can stabilize price action.
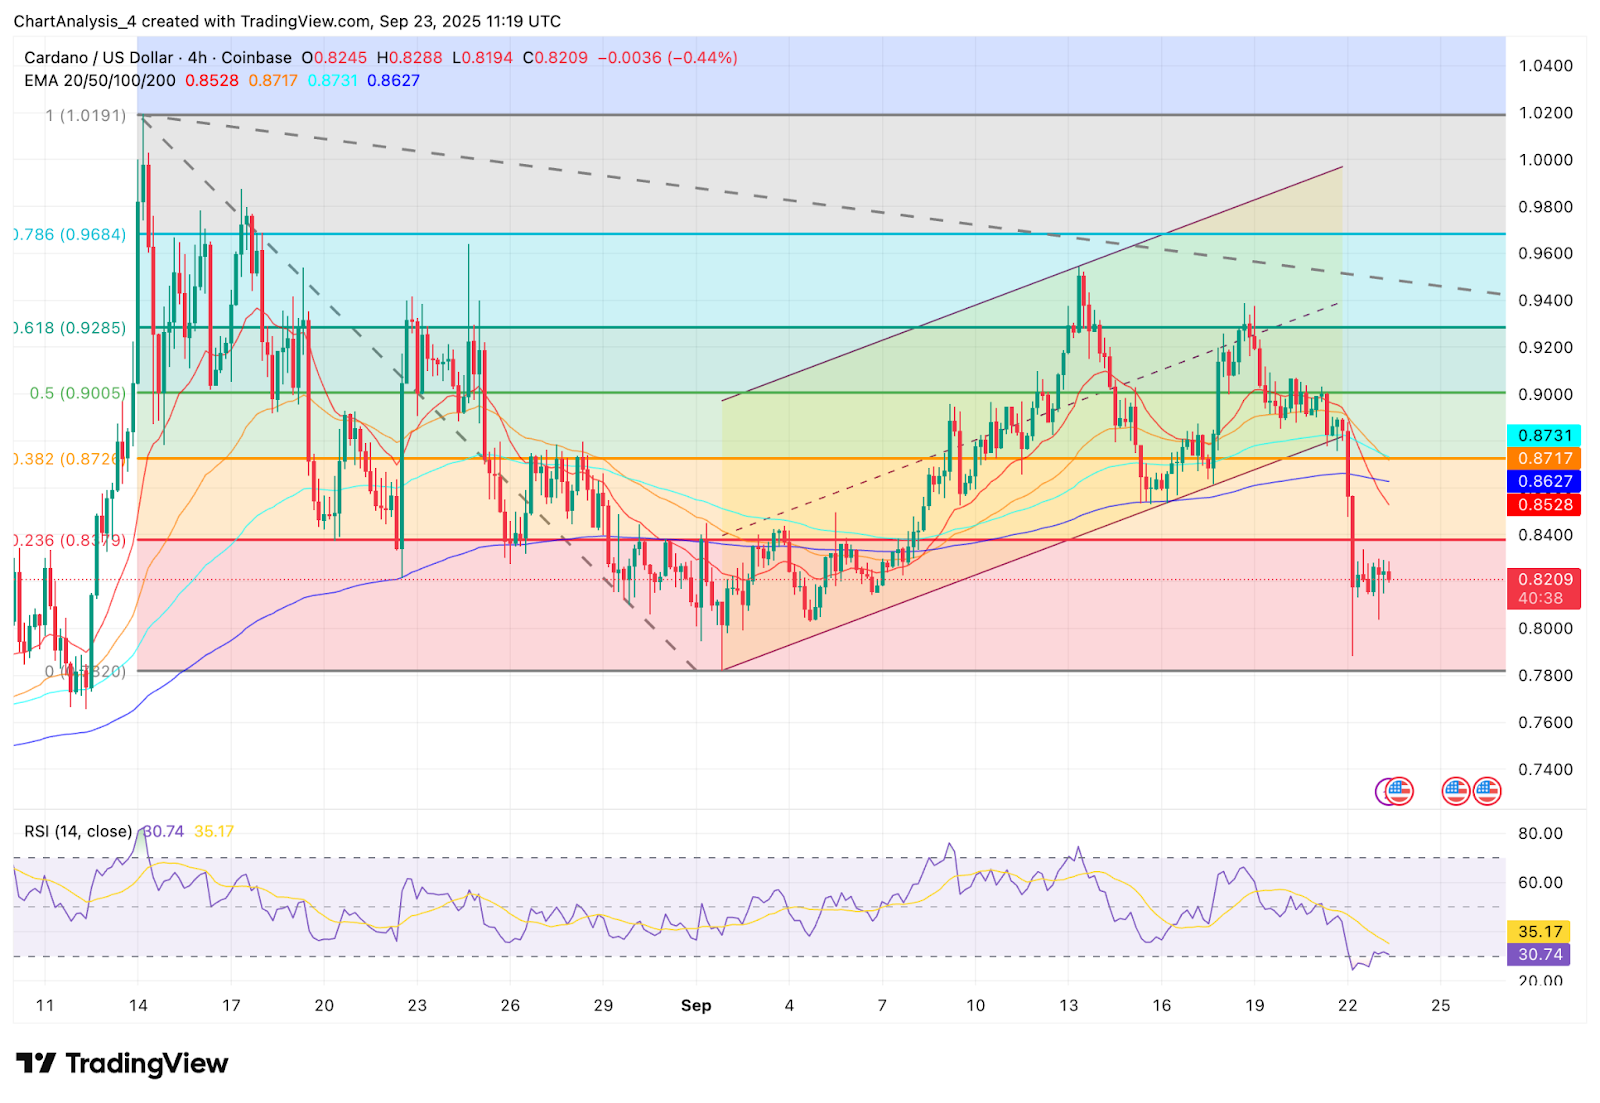
The 4-hour chart shows ADA slipping beneath the rising channel that had guided its advance since early Septem…
Read The Full Article Cardano Price Prediction: ADA Stalls Below $0.84 Amid RWA Tokenization Hype On Coin Edition.
The spotlight is firmly on Ripple as XRP leads the discussion in terms of long-term growth in the crypto universe. Traders are furiously discussing whether XRP Price Prediction trends can push the token above $50 by 2030. With its impeccable use case for cross-border payments, XRP remains the key player in blockchain adoption despite consistent volatility.
At the same time, fresh initiatives like Remittix (RTX) https://remittix.io at $0.1130 are emerging with the same aim of revolutionizing cross-border payments. Together, they reflect how established as well as budding crypto projects are setting the tone for future digital finance.
XRP Price Forecast and Current Market Trends
Ripple’s present condition is a reflection of the overall volatility in the wider crypto market. With its selling price at $2.86, XRP has declined by 4.44% over the last 24 hours. Its market capitalization is a robust $170.29 billion even during its decline, and it ranks as one of the largest digital tokens globally.
These figures obviously indicate investor confidence and ongoing speculation on Ripple’s future. Everyone is watching how adoption patterns and regulation continue to shape Ripple’s position in cross-border payments. XRP Price Prediction discussion always indexes to the token’s usability as the long-term growth force.
Remittix: A New Altcoin to Watch
While Ripple continues to dominate the headlines in global remittance solutions, there are other new ventures emerging with identical purposes. Remittix (RTX) is one of them, offering a practical crypto-to-fiat gateway allowing for instant bank account fund transfers to over 30 countries.
Having sold over 668.7 million tokens and raised well over $26.3 million at its current presale price of $0.1130 per token, https://remittix.io Remittix is off to a strong start.
The project has also locked in future listings on BitMart and LBank, following hitting crucial presale milestones. With beta testing of its wallet already commencing, Remittix is establishing itself as a DeFi project with real utility. With investors on the lookout for the best crypto presale 2025, RTX has emerged among the most trending crypto under $1 worth considering.
Why Remittix Is Getting Noticed:
● $26.3M+ raised in presale
● Future listings on top centralized exchanges announced
● Ranking #1 pre-launch token validated by CertiK
● $250,000 Remittix Giveaway now active for new holders
Security and Worldwide Momentum
The largest breakthrough for Remittix may be its CertiK verification. Not only is the project verified but #1 ranked on CertiK pre-launch tokens, which helps inspire investor confidence in its security and long-term viability. Such certification, combined with its presale increase, further establishes Remittix as among the top DeFi projects 2025.
As the crypto market searches for the next big altcoin 2025, RTX is notable for having a focus on driving real-world solutions. Its mission is also aligned with the same type of story surrounding global adoption that made Ripple popular, but with advanced infrastructure to facilitate lower fees and faster transactions.
Discover the future of PayFi with Remittix by checking out their project here:
Website: https://remittix.io/
Socials: https://linktr.ee/remittix
$250,000 Giveaway: https://gleam.io/competitions/nz84L-250000-remittix-giveaway
Source: https://btcpresswire.com/
Disclaimer:
This article is for informational purposes only and does not constitute financial advice. Cryptocurrency investments carry risk, including total loss of capital. Readers should conduct independent research and consult licensed advisors before making any financial decisions.
This release was published on openPR.
The crypto world never stops churning out headlines, from bold Solana price prediction chatter to the latest Pi Network news about faster KYC. But while traders debate established names, a new contender is smashing through the spotlight. Layer Brett, priced at just $0.0058, has already surged toward a sensational $4 million presale milestone in a matter of weeks. The Ethereum L2 + memecoin hybrid is attracting attention as the kind of early-stage play that could deliver gains far outpacing the giants.
Solana has been trading around $237, slipping a few points over the week after briefly crossing $245 earlier in September. Analysts are watching the $250 line as a key resistance point, and the launch of CME options has added a layer of legitimacy for institutional players. Talk of a possible ETF approval looms large, but at a market cap near $130 billion, the question is not whether Solana is credible—it is whether it can still multiply in value the way retail investors hope. For a coin of that size, the math gets harder every cycle.
Meanwhile, Pi Network has been busy refining its ecosystem with the new Fast Track KYC feature. This lets new users skip the old 30-session wait and move straight into verification and wallet activation. It is a clever piece of engineering that brings accessibility to its 14.8 million verified pioneers. But the complexity of its compliance systems, paired with the reality that mined balances are not yet fully migrated, makes Pi feel more like an experiment in bureaucracy than a straightforward bet on crypto gains.

In sharp contrast, Layer Brett is simplicity itself. It’s a next-generation Ethereum Layer 2 that harnesses meme culture but improves the Ethereum experience with real speed, low transaction costs, and high staking rewards. At just $0.0058, its presale has already drawn nearly $4 million in funding within weeks. Unlike established projects weighed down by size or red tape, $LBRETT gives everyday buyers a chance to step in when the ceiling for growth is at its widest.
What makes the project stand out is its alignment with the broader Ethereum ecosystem. As institutions pour money into ETH through ETFs and other vehicles, that liquidity often spills into connected projects. Layer Brett is perfectly positioned to benefit from that dynamic, meaning when Ethereum pumps, its Layer 2 offshoots could surge even harder. For investors priced out of Solana or fatigued by Pi Network’s intricate mechanics, Layer Brett represents a fresh entry point with far greater room to run.

The appeal is not only financial but cultural. It blends the viral power of a meme token with the real utility of a Layer 2 crypto, offering quick settlement, low gas fees, and staking rewards that dwarf anything found on older networks. For those who once dreamed of buying Shiba Inu or Dogecoin at their earliest stages, this presale feels like a second chance.
Layer Brett is not just another internet fad. It is a presale anchored to one of the most powerful blockchains in existence, primed for institutional spillover and community-driven growth. The presale will not last forever, and once it closes, today’s entry point disappears. At under a penny, with millions already raised, this is the moment to pay attention—before the coin climbs to heights that legacy tokens can no longer reach.
LBRETT is available now at $0.0058. Don’t miss out on the next 100x—join the Layer Brett presale today.
Website: https://layerbrett.com
Telegram: https://t.me/layerbrett
BNB’s past corrections have found footing around these EMA bands before resuming their broader uptrend. Therefore, these levels remain critical gauges of market sentiment.
BNB’s broader trend remains bullish, still trading comfortably above its 20-, 50-, and 200-day EMAs, and volume trends suggesting healthy participation during rallies.
If bulls defend the 20-day EMA, BNB could quickly resume its upside toward $1,100 and beyond, especially if Bitcoin steadies after its recent correction.
BNB looks poised for a cooldown, with the $947–$882 range as the first downside cushion. A breach below could drag the token toward $747, but the path of least resistance remains upward as long as EMA support levels hold.
Onchain data paint a more nuanced picture for BNB.
Glassnode data shows that BNB whales holding over 100,000 tokens have been quietly adding to their balances recently, pushing total holdings to fresh highs.
The Dogecoin Price Prediction for the next two years is again dominating crypto discussions. DOGE has shown resilience but many investors want to know if $1 is within reach by 2025 or 2026.
Analysts suggest that while the odds are challenging, three conditions could align to make it possible. Meanwhile, Remittix (RTX) has already raised over $26.3M in its presale and is emerging as a PayFi token that offers fresh upside opportunities.
The latest Dogecoin price prediction has DOGE trading near $0.24 after bouncing off support at $0.23. Resistance remains around $0.30, with analysts saying a clean breakout could send it toward $0.35–$0.40 in the short term.

For DOGE to hit $1 in 2025/26, three things need to happen. First, it must expand beyond memes and gain broader merchant payment adoption. Second, institutional inflows would require regulatory clarification or maybe a Dogecoin ETF. Lastly, DOGE needs to control its inflationary supply while maintaining community enthusiasm.
Many analysts are aiming for a price surge between $0.40 to $0.50 in the upcoming cycle. However, DOGE’s branding, community and liquidity make sure it remains firmly in the discussion.

While the Dogecoin Price Prediction debate continues, Remittix (RTX) is creating momentum in a completely different market corner: PayFi. Built to connect crypto wallets directly to bank accounts, it enables seamless cross-border transfers with real-time FX conversion.
The presale has already surpassed $26.3M, making it one of the biggest launches of 2025. Wallet beta testing is live, allowing the community to try out features before the official rollout.
On top of that, the team is fully verified by CertiK and RTX holds the #1 ranking on CertiK Skynet for pre-launch tokens. The project also activated a 15% USDT referral program, paying daily rewards to participants through the Remittix dashboard.
Why Remittix (RTX) is winning attention:
By tackling the $19 trillion remittance market, Remittix is positioning itself as a crypto with real utility, not just hype. For investors comparing opportunities, RTX is being tipped as one of the best crypto presale 2025 candidates with genuine long-term adoption potential.
The Dogecoin Price Prediction of $1 by 2025/26 depends on adoption, regulation and sustained sentiment. Without those drivers, more modest gains are likely. Remittix, meanwhile, is proving that a new PayFi model with utility, security and incentives can deliver growth today.
For many traders, the strategy is simple: keep DOGE for brand-driven upside, but look at RTX for high-growth potential in 2025.
Discover the future of PayFi with Remittix by checking out their project here:
Website: https://remittix.io/
Socials: https://linktr.ee/remittix
$250,000 Giveaway: https://gleam.io/competitions/nz84L-250000-remittix-giveaway
Disclaimer: This is a Press Release provided by a third party who is responsible for the content. Please conduct your own research before taking any action based on the content.
The cryptocurrency market continues to evolve at breakneck speed, with new projects constantly challenging established players. Cardano and Shiba Inu have both managed to secure loyal communities and name recognition, but investors have also seen how volatile these tokens can be. Cardano’s development-driven approach and Shiba Inu’s meme-driven popularity have delivered periods of rapid price rises and equally abrupt corrections. Against this backdrop, BlockchainFX (BFX) has entered the scene with a presale model and a broader vision that could make it one of the best cryptos to buy today, blending innovation, utility and passive income in a way that sets it apart from single-purpose altcoins.
Cardano is well known for its peer-reviewed research, staking protocol and gradual rollout of smart-contract functionality. Yet its focus on slow, methodical upgrades has sometimes frustrated investors looking for faster ecosystem growth and diversified use cases. Shiba Inu, meanwhile, has captured headlines as a meme token with a sprawling community and spin-off projects like Shibarium. However, its price action still largely tracks speculative sentiment rather than long-term utility. For investors hoping for stability and multiple income streams, both ecosystems can present challenges despite their popularity.
BlockchainFX aims to sidestep those limitations by creating a decentralised “super app” for digital finance. Instead of confining itself to a single blockchain or a meme narrative, BFX’s platform will allow users to trade crypto, stocks, forex, ETFs and more, all from one dashboard. This breadth of assets is designed to shield investors from the single-sector volatility that often plagues traditional altcoins. The model offers a much larger potential addressable market than the narrow lanes occupied by many existing tokens, making it a compelling alternative for those looking at the best crypto price predictions for you in 2025 and beyond.
Source: Blockchain Reporter
One of the most attractive elements of BFX right now is its presale pricing structure. Tokens are being offered at $0.024, with a planned market launch at $0.05, effectively giving early buyers a significant built-in upside if launch projections hold. On top of this, BlockchainFX is running a time-limited 30% bonus on tokens for anyone using the BLOCK30 code during the presale. This “extra tokens for the same spend” incentive allows participants to accumulate larger stakes at a discounted cost, potentially boosting their returns once the platform goes live.
Beyond price appreciation, BFX offers a staking model designed to generate real passive income. The platform redistributes trading fees back to its community, enabling stakers to earn both BFX and USDT rewards. This dual-currency reward system creates a more predictable income stream than the one-off staking returns seen on many other platforms. In essence, users benefit from the activity and growth of the entire ecosystem rather than relying solely on market speculation.
Adding to the real-world utility is the presale-exclusive BFX Visa Card, available in Metal or 18-karat Gold editions. Holders can top up with BFX and over 20 other cryptocurrencies, process transactions up to $100,000 each and withdraw up to $10,000 monthly from ATMs. Rewards earned in BFX and USDT can be spent directly for purchases worldwide, both online and in-store. Crucially, this card is only available during the presale, adding an element of exclusivity and immediate usability that few crypto projects can match.
While some altcoins rely heavily on centralised exchanges or intermediaries, BlockchainFX has been designed from the ground up to operate as a completely decentralised platform. This not only increases transparency and security but also aligns with the ethos of Web3 by giving users full control over their assets and data. For investors considering the best presales to buy now or looking for crypto with high ROI, decentralisation can be a key differentiator in long-term resilience and trust.
With over $7.5 million already raised and the presale price at $0.024, BlockchainFX offers early buyers a straightforward gain ahead of its $0.05 market launch target. Analysts watching the presale suggest that, if the platform captures even a small slice of the multi-asset trading market, BFX could outperform many traditional altcoins in the next cycle. The combination of presale discounts, staking rewards and real-world payment features may place it among the best cryptos to buy in 2025 for those seeking both appreciation and income.
| Stage | Price (USD) | ROI vs Presale |
| Presale (Current) | $0.024 | – |
| Market Launch Target | $0.05 | +108% |
| Hypothetical 12-Month Target | $0.10 | +316% |
While all forecasts remain speculative, this simple projection illustrates why investors are increasingly paying attention to BFX’s presale.
Cardano and Shiba Inu will likely continue to attract their respective communities, but their narrower focus leaves them more exposed to market shifts. BlockchainFX, by contrast, combines multi-asset trading, high-yield staking and global payment capabilities into one decentralised platform, a model with the potential to provide both stability and growth.
For investors weighing the best crypto to buy today or searching for the best presales to buy now, BlockchainFX stands out as a unique proposition. Its discounted presale price, innovative staking model, broad trading capabilities and exclusive Visa Card position it as more than just another token launch. With sales already surpassing $7.7 million and momentum building ahead of its market debut at $0.05, BFX is shaping up to be one of the most promising cryptocurrencies with high ROI opportunities on the horizon.
Website: https://blockchainfx.com/
X: https://x.com/BlockchainFXcom
Telegram Chat: https://t.me/blockchainfx_chat
Disclaimer: This media platform provides the content of this article on an “as-is” basis, without any warranties or representations of any kind, express or implied. We assume no responsibility for any inaccuracies, errors, or omissions. We do not assume any responsibility or liability for the accuracy, content, images, videos, licenses, completeness, legality, or reliability of the information presented herein. Any concerns, complaints, or copyright issues related to this article should be directed to the content provider mentioned above.
/div>
Disclaimer: This is a Press Release provided by a third party who is responsible for the content. Please conduct your own research before taking any action based on the content.
The XRP price today stands at around $2.86, responding to macroeconomic uncertainty and market sentiment. Stellar (XLM) is trading at $0.36, with predictions suggesting modest gains ahead if support holds.
Remittix enters the picture as the crypto “almost breaking the internet,” with nearly 40,000 investors showing interest and raising over $26.3 million while trading at around $0.108. The contrast between XRP’s current price moves, XLM’s potential for rebound, and Remittix’s surge offers insight into where attention is flowing in crypto right now.
XRP is priced at about $2.86 and is struggling with resistance near $3.00 to $3.20, and bearish sentiment is increasing as long as it fails to break above those zones. Investors are watching broader market cues: Bitcoin and other majors are under pressure from rate uncertainty, leverage, and macro headwinds.
XRP’s price today could see more downside if sentiment does not improve, or it might bounce back slightly if it reclaims support and benefits from any positive regulatory or ETF-related news.
Stellar (XLM) currently trades at $0.36 per coin. It has dropped by nearly 7% in the last 24 hours and 5 to 6% in the last 7 days. Predictors believe XLM could touch $0.44 to $0.46 in subsequent months in the event of added momentum, and October 2025 averages stay at $0.43 to $0.44.
Compared with XRP and XLM, Remittix is generating buzz in a different way. While XRP price today reflects reactive moves to macro and regulatory signals, and XLM price depends heavily on technical support and upgrades, Remittix is proactive: nearly 40,000 investors have snapped up RTX, fueling hype and attention that many say “almost broke the internet.”
Remittix has raised over $26.3 million USD, sold more than 668 million tokens, and trades around $0.113 per token. Remittix’s features stack up strongly versus what XRP and XLM offer under current conditions. The team is verified by CertiK, and Remittix is ranked number one among CertiK pre-launch tokens. The project has launched a beta wallet under community testing.
It offers a 15% USDT referral program with rewards claimable every 24 hours via the dashboard, a $250,000 giveaway, and secured two centralized exchange listings after passing $20 million and $22 million funding milestones, with a third listing in view.
Here are what many see as its biggest advantages:

XRP price today points toward a period of consolidation unless it beats resistance and gains fresh positive triggers. Stellar’s price prediction indicates modest upside, especially if support around $0.38 holds and utility-driven developments such as stablecoin rails gain traction.
Remittix, meanwhile, is capturing buzz that many analysts see as meaningful. For those seeking explosive growth, its metrics, community size, and utility suggest it might be the asset turning heads.
Discover the future of PayFi with Remittix by checking out their project here:
Website: https://remittix.io/
Socials: https://linktr.ee/remittix
$250,000 Giveaway: https://gleam.io/competitions/nz84L-250000-remittix-giveaway
Disclaimer: This media platform provides the content of this article on an “as-is” basis, without any warranties or representations of any kind, express or implied. We assume no responsibility for any inaccuracies, errors, or omissions. We do not assume any responsibility or liability for the accuracy, content, images, videos, licenses, completeness, legality, or reliability of the information presented herein. Any concerns, complaints, or copyright issues related to this article should be directed to the content provider mentioned above.
/div>
The cryptocurrency market is witnessing a significant shift as institutional investors increasingly turn their attention to Solana. What was once considered primarily a retail-driven asset is now attracting serious money from corporate treasuries and investment firms, with accumulation reaching historic levels that could reshape SOL’s trajectory.
The numbers tell a compelling story. Corporate treasuries have amassed 4.3 million SOL tokens, valued at roughly $905 million. This isn’t just gradual accumulation—it’s a coordinated institutional push that crypto analyst @MarkETHreal describes as unprecedented in strength.
July’s trading data reveals the scale of this institutional interest. SOL-focused firms generated $4 billion in trading volume, completely dwarfing other major cryptocurrencies. XRP, by comparison, managed only $460 million in institutional flows during the same timeframe. This massive disparity shows how quickly Solana has become the preferred choice for institutional portfolios.
Perhaps the most eye-catching move came from Sharps Technologies, which secured $400 million specifically to buy more SOL. This isn’t speculative trading—it’s a strategic bet on Solana’s long-term potential within the broader blockchain landscape.
Such substantial investments suggest that major players view Solana’s ecosystem of DeFi protocols, NFT marketplaces, and scalable infrastructure as more than just hype. They’re backing it with serious capital that could drive sustained growth.
SOL is currently testing the $200 level while institutional accumulation continues. If this buying pressure persists, the token could maintain its current strength and potentially challenge resistance levels between $220-$250.
The message from the market is clear: institutional FOMO has arrived, and Solana sits squarely in the spotlight.
Dogecoin is back in the spotlight after surging 10% in a single day, reclaiming the $0.24 mark and reigniting debate over whether $0.60 is within reach.
The sudden rally has sparked fresh optimism among traders and longtime holders, with whale accumulation, technical signals, and upcoming macro events positioning the meme-inspired cryptocurrency for a potentially explosive run.
Charts hint at a promising setup. Dogecoin recently clawed above a descending resistance and retested the $0.24 level successfully—a classic retest that often signals continuation. Analysts liken the current pattern to formations that preceded prior explosive moves. If sustained, targets in the $0.50 to $0.60 range could be within reach.
Dogecoin could target $0.40 if it breaks above the trendline, with wave-3 momentum potentially extending toward $0.45–$0.50 after a pullback entry. Source: TheAlaskanTrader on TradingView
Some technical models forecast even more ambitious moves—pointing to a potential rally into the $0.60–$0.70 zone, spurred by a breakout from long-standing upper trendlines.
Analysts remain cautiously optimistic about Dogecoin’s trajectory. Several technical forecasts point to the development of a bullish double bottom pattern, which historically signals strong potential for a trend reversal. If confirmed, this setup could provide the momentum needed for Dogecoin to push toward the $0.42 level in the coming weeks. The pattern reflects improving investor confidence, suggesting that buyers are beginning to step back in after periods of consolidation and profit-taking.

DOGE may be setting up for a Wave 3 breakout, with targets near $0.37–$0.50 if it clears the trendline and holds the pullback. Source: Surf via X
At the same time, broader sentiment models are highlighting strong demand within the market. Recent data shows that Dogecoin could approach the $0.308 mark by August, supported by a “Greed” index reading of 72, which reflects high investor appetite for risk assets.
This renewed enthusiasm has been bolstered by both whale accumulation and an uptick in retail participation, signaling that confidence in Dogecoin is not only technical but also rooted in broader market psychology. Together, these factors suggest that while volatility will remain constant, the underlying sentiment for Dogecoin continues to tilt in favor of further upside.
Factoring in all the variables, the outlook for Dogecoin is optimistically positive. Whales’ accumulation is steadfast support at $0.22–$0.24 levels, and recent technical breakouts suggest that a successful retest can trigger momentum to the $0.50–$0.60 range.
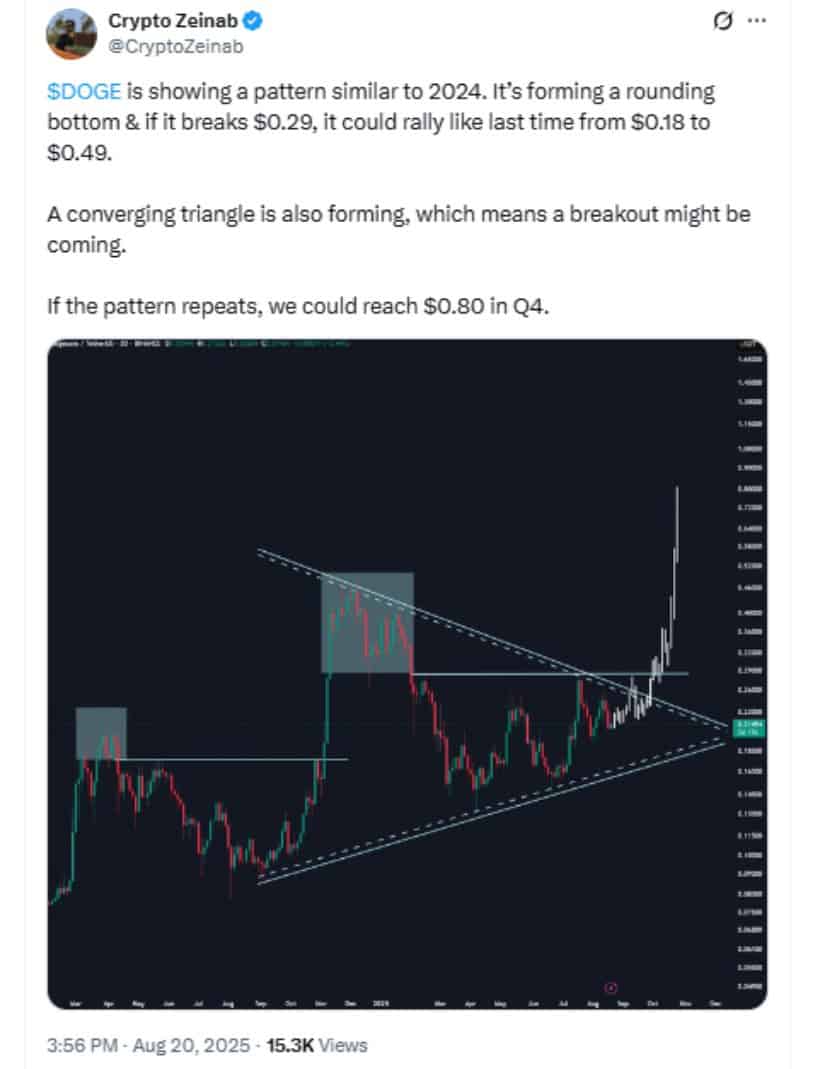
Dogecoin is mirroring its 2024 setup, forming a rounding bottom and converging triangle. A breakout above $0.29 could trigger a rally toward $0.80 in Q4. Source: Crypto Zeinab via X
Patterns forming, such as the forming double bottom and megaphone patterns, reinforce the bulls even more, showing potential upside targets in the band of $0.42 to $0.60. Institutional selling and profit-taking, however, still pose a threat, and the bulls need to maintain the $0.23–$0.24 level to sustain the momentum. While a move to $0.60 in a month may appear bullish, the majority of analysts are looking towards such levels for mid-to-late 2025 if overall crypto sentiment is bullish and Dogecoin can get good weekly and monthly closes above resistance.
Dogecoin’s 10% surge and recapture of the $0.24 level showcase regained strength in the meme-coin sector. Aggressive whale accumulation, bullish technical patterns, and rising retail interest all point toward momentum being on the side of further upside. These signals complement Dogecoin’s strength in attracting interest even during overall market volatility.
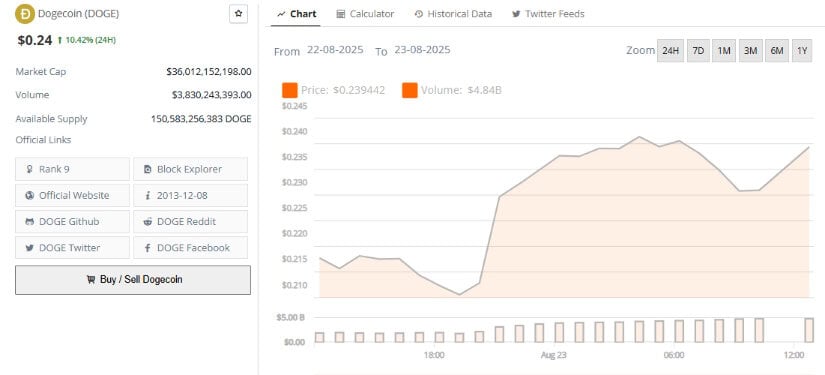
Dogecoin was trading at around $0.24, up 10.42% in the last 24 hours at press time. Source: Brave New Coin
Whether Dogecoin can hit $0.60 by September will be left to market sentiment, macro trends, and its capacity to sustain above important resistance levels. While the target may seem high, history has a way of always surprising Dogecoin. With favorable trends, mid-to-late 2025 could be the inflection point for the coin’s direction.