The main category of Crypto News.
You can use the search box below to find what you need.
[wd_asp id=1]
The main category of Crypto News.
You can use the search box below to find what you need.
[wd_asp id=1]
XRP (XRP) is facing a crucial moment in its 2025 rally. The cryptocurrency, native to the Ripple ecosystem, is trading around $2.26–$2.36 USD, testing key support levels.
Market watchers are debating whether XRP will stabilize above $2 or suffer a deeper correction before resuming its upward trend.
After rallying from lows near $0.60 earlier this year, XRP has seen significant gains, climbing above $2.30. On-chain data indicate strong accumulation, including over 21,000 new wallets created in the last 48 hours, signaling growing investor interest. However, the cryptocurrency faces resistance around $2.55–$2.70, where overbought conditions could trigger short-term pullbacks.
The $1.90–$2 range is a key support level for XRP, drawing price stability and possible upward moves. Source: @ali_charts via X
Crypto analyst Ali (@ali_charts) notes, “$1.90–$2 looks like a magnet for XRP. This zone has repeatedly acted as support and could hold during the current pullback.” On the flip side, a breach below $2 could expose XRP to $1.80–$1.90 levels amid broader market weakness.
Recent on-chain data show whales distributed 500,000 XRP (~$1.1 million) over 48 hours, coinciding with a temporary 13% drop from $2.7. While some community members dismiss this as minor, it reflects heightened short-term volatility. Despite this, the overall circulating supply remains stable, suggesting potential stabilization above $2.10.

Could XRP Price Hit a New All-Time High (ATH) Before the End of the Month? Source: @amonbuy via X
Amonyx (@amonbuy) highlighted the upside potential, posting, “If XRP maintains momentum, a new all-time high above $3.65 could be achievable by November 30.” Analysts warn, though, that resistance at $2.55 and RSI overbought levels could create a 20–30% pullback risk before any major breakout.
Institutional interest remains a key catalyst for XRP. Ripple’s recent strategic moves, including a $500M funding round at a $40B valuation, bolster confidence in the token’s utility for stablecoin custody and payment services. Meanwhile, ETF filings and Ripple-backed initiatives continue to support XRP’s adoption.
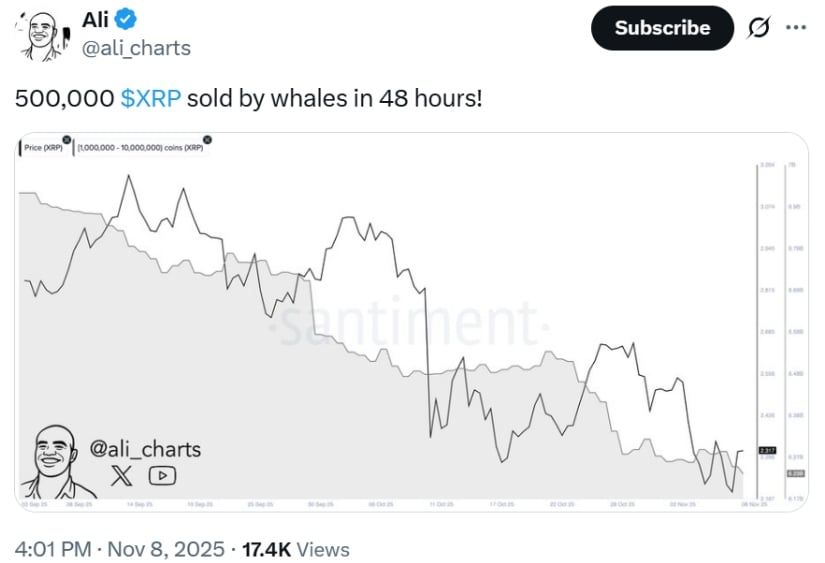
Whales Sell 500,000 XRP in 48 Hours, Impacting XRP Price and Market Sentiment. Source: @ali_charts via X
However, regulatory outcomes—particularly in the ongoing SEC vs. Ripple case—remain a major uncertainty. A favorable ruling or positive developments could act as a bullish trigger, while setbacks may increase downside pressure.
If XRP maintains support and benefits from ongoing institutional momentum, analysts suggest it could test $2.80–$3.00+ by year-end. Conversely, a breakdown below key support might see XRP revisiting sub-$2 territory, potentially dropping to $1.70–$1.80.
Traders should watch volume trends, whale activity, and ETF-related announcements closely. Market dynamics over the next few days could decide whether XRP crashes below $2 or soars toward a new all-time high.
Support: $2.10–$2.20—crucial accumulation zone
Resistance: $2.50–$2.70—key technical band with EMA convergence
Bearish risk: A drop below $2.10 could target $1.80–$1.90
Bullish trigger: Sustained move above $2.75–$2.80 could open the path to $3+
For XRP investors, the current market action represents a critical make-or-break moment. The $2.10–$2.20 support zone is key to maintaining bullish momentum, as holding this level could prevent a deeper correction. Traders are closely monitoring XRP price today, XRP chart trends, and whale activity, all of which influence short-term market sentiment. With Ripple’s expanding ecosystem and ongoing institutional interest, XRP continues to be one of the most closely watched altcoins in 2025.
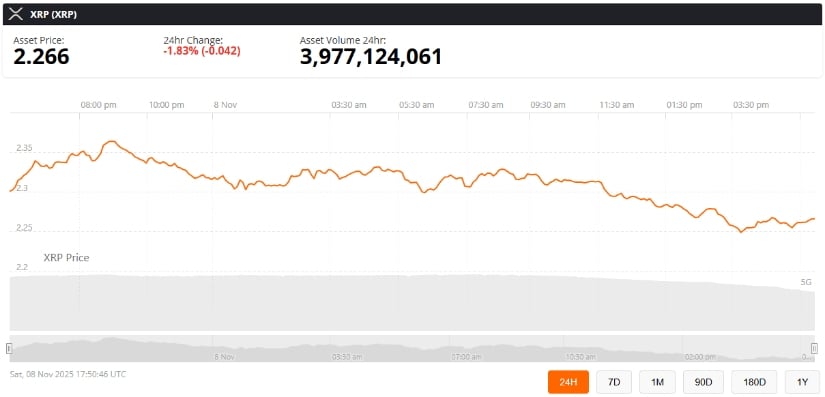
XRP was trading at around $2.26, down 1.83% in the last 24 hours at press time. Source: XRP price via Brave New Coin
Clearing resistance near $2.75–$2.80 could reignite the ongoing rally, paving the way for a potential push toward XRP’s next highs. Analysts note that regulatory updates, ETF filings, and on-chain accumulation will play a crucial role in determining XRP’s trajectory. For those tracking XRP crypto news, the combination of technical support, institutional adoption, and market momentum makes this a pivotal period for forecasting whether XRP will soar to a new all-time high or face further downside.
Bitcoin is currently valued at $101,468.15, showing a modest increase of 0.18% today. With a fluctuating day range, Bitcoin enthusiasts are questioning if BTCUSD could climb to $142K this month. Let’s dig into the numbers and sentiment driving these projections.
Bitcoin’s current journey involves navigating a price range from today’s low of $98,892.97 to a high of $107,269.85. Though the year high of $126,296 remains a distant peak, the monthly forecast of $142,555.95 sparks interest. These projections account for Bitcoin’s inherent volatility.
The recent price changes include a monthly gain of 1.56%, but a three-month decline of 15.77%. This dynamic suggests a cautious yet hopeful market, adjusting strategies amid price swings.
Analyzing Bitcoin’s market signals reveals critical insights:
The Bollinger Bands display a broad range with the lower band at $100,996.52, indicating potential volatility. Forecasts can change due to macroeconomic shifts, regulations, or unexpected events affecting the crypto market.
The market sentiment for Bitcoin remains cautiously optimistic. Despite recent downward trends, long-term believers see potential, as illustrated by the five-year forecast of $161,345.54.
⚈ Volume Metrics: With a substantial daily volume of 110,967,184,773, compared to an average of 780,514,552, increased trading activity reflects a vibrant market.
⚈ Sentiment Trends: Meyka AI highlights that investor sentiment is a blend of cautious watching and hopeful investment, guided by performance trends and future technology expectations.
Bitcoin’s path to reaching $142K this month involves navigating intricate market movements, sentiment, and technical interpretations. While predictions show promise, potential risks from regulatory changes and macroeconomic factors cannot be overlooked.
The current price of BTCUSD is $101,468.15, with slight positive movement seen today at 0.18% increase. For detailed fluctuations, visit our BTCUSD page.
The ADX at 27.8 indicates a strong trend, and although RSI is neutral, it suggests a potential for reevaluation into oversold territory. Such metrics reflect underlying trends that may support upward momentum.
Regulatory shifts, macroeconomic changes, or unexpected events in the crypto market could alter forecasts, emphasizing the importance of monitoring global economic events.
Trading activity is robust with a daily volume of 110,967,184,773, which is significantly higher than the average daily volume, indicating active market participation.
Long-term forecasts suggest Bitcoin reaching $161,345.54 in five years and $205,008.82 in seven years, driven by technological advancements and market maturity.
Disclaimer:
Cryptocurrency markets are highly volatile. This content is for informational purposes only.
The Forecast Prediction Model is provided for informational purposes only and should not be considered financial advice.
Meyka AI PTY LTD provides market data and sentiment analysis, not financial advice.
Always do your own research and consider consulting a licensed financial advisor before making investment decisions.
Dogecoin (DOGE) is roaring back with a 9.4% daily jump to $0.178 on November 8, 2025, as Bitcoin’s rally past $70,000 sparks renewed enthusiasm across the meme coin market.
A post from the Dogecoin news account @dogegod highlighted the recent momentum, labeling the coin as “back in action,” and projecting a bold $2.40 target. While this would require over 13x growth from current levels, historical patterns suggest such gains are feasible during extended bull cycles, as evidenced by Dogecoin’s 2021 surge of nearly 10,000%.
Analysts, however, caution that the path to $2.40 remains challenging due to high volatility and the coin’s reliance on social sentiment and hype-driven buying. Dogecoin price prediction 2025 models emphasize that short-term fluctuations are likely, even amid strong technical setups.
A weekly Dogecoin chart shows the price hovering near a $0.37 demand support block, indicating a critical level for potential bullish continuation. Analysts note that a candle close above this support, combined with green volume spikes and upward momentum indicators, could trigger a breakout toward $1+ in the near term.
Dogecoin (DOGE) has resumed upward momentum, targeting a potential price of $2.40. Source: @_dogegod_ via X
Recent social media discussions on X highlight hidden bullish divergences on the Stochastic RSI and the formation of a falling wedge pattern, setups historically associated with rallies exceeding 200%, as seen in 2021. These technical patterns suggest that Dogecoin may have the foundation for a substantial rebound if market conditions remain favorable.
On November 7, 2025, Dogecoin climbed 11.66% to close around $0.167, outperforming many top cryptocurrencies despite lagging slightly behind projected chart levels. The recent gains reflect renewed buying pressure and a shift in trader sentiment, with investors showing interest in accumulating DOGE near key support zones.
 Price Prediction: Can Dogecoin’s alt=")
Dogecoin (DOGE) bulls aim to close a weekly candle above the demand support block, targeting a potential price above $1.00. Source: @Shan_Specter via X
Despite these gains, Dogecoin remains approximately 85% below its all-time high of $0.74 from 2021, underscoring the significant upside required to reach the $2.40 target. Market experts suggest that Dogecoin price analysis should account for both historical volatility and the coin’s sensitivity to broader crypto trends.
While technical setups and recent momentum indicate potential for a strong rally, analysts stress caution. Achieving a $2.40 price of Dogecoin would require sustained buying pressure, supportive market conditions, and continued hype among retail traders.
Historical data show that Dogecoin rallies often depend heavily on social media-driven sentiment, including tweets from influential figures and community-driven campaigns. As such, short-term corrections and choppy price movements are possible, even if the overall trend remains bullish.
Dogecoin’s recent rebound highlights growing optimism within the Dogecoin ecosystem, supported by strong technical setups and market recovery. If DOGE holds its current support levels and breaks decisively above key resistance, the coin could see a meaningful upward trajectory, with $1 and beyond becoming realistic milestones.
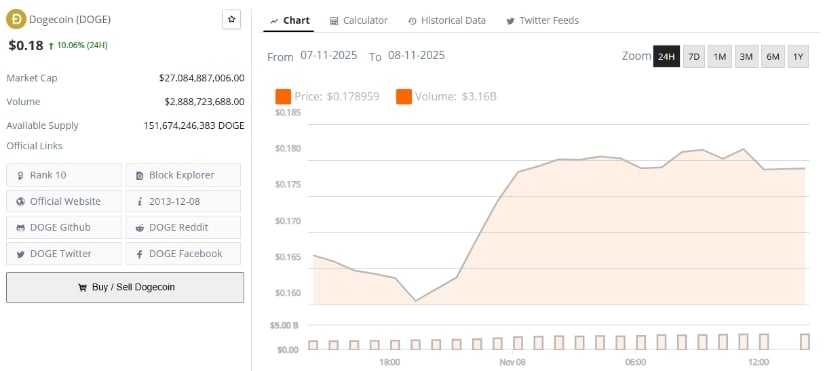
Dogecoin was trading at around $0.18, up 10.06% in the last 24 hours. Source: Brave New Coin
Ultimately, whether Dogecoin can achieve the long-term $2.40 target depends on a combination of technical confirmation, broader crypto market trends, and sustained community engagement. For now, traders and investors are closely watching DOGE’s price action, where every candle could define the next phase of this meme coin’s evolving story.
Cardano chatter is heating up again as liquidity rotates across the majors and headlines pile in. On-chain data confirms the mainnet has surpassed 115 million transactions, underscoring that network activity remains strong even during quieter price phases. Weekly market digests continue to note how buyers consistently defend key support zones, keeping ADA’s rebound setups firmly in play. Some portfolio strategists are now pairing ADA with community-driven projects like PepeNode (https://pepenode.io/) to balance narrative exposure and utility potential. For real-time insight into structure and flows, check live price dashboards at CoinMarketCap (https://coinmarketcap.com/currencies/cardano/).
Cardano Crosses 115 Million Transactions as Market Eyes Key Zones
When analyzing Cardano’s next move, usage tells the real story. Surpassing 115 million transactions shows demand hasn’t flinched through different market moods. Chart watchers keep circling familiar levels – $0.64 as the line bulls defend, and the $0.77 pocket where sellers tend to reappear.
Since mid-October, excess leverage has been flushed out, clearing the field of crowded longs. That kind of reset often stabilizes funding rates and opens the door for spot-led accumulation. For a clean look at the setup, pull up ADAUSD on TradingView (https://www.tradingview.com/symbols/ADAUSD/).
Watching ADA’s Technical Map Into Year-End
The structure stays simple. Hold above $0.64, grind through $0.68-$0.70, and bulls can aim for $0.74-$0.77, where earlier rallies stalled. A confirmed close above $0.77 flips the short-term bias bullish and brings $0.85 back into focus for traders tracking continuation patterns. If price loses $0.64, a fade toward $0.59 becomes likely before another wave of dip buyers emerges. Momentum confirmation will depend more on expanding volume than single candle spikes – consistency over drama.
Layered Growth: Smart Contracts Meet Utility Chains
Cardano’s vision remains steady – a slow, structured build toward a scalable smart-contract economy. Alongside that, PepeNode (https://pepenode.io/) is shaping its identity around networked participation and creator-driven utility rather than payments alone. The pairing makes sense for investors who want contrast: ADA as the infrastructure backbone, and PepeNode as a social-utility experiment that blends community, staking, and cultural traction. When market cycles turn volatile, exposure across these different lanes can smooth out swings while keeping upside tied to real activity.
Cardano’s Hidden Upside and PepeNode’s Expanding Reach
If Cardano can defend $0.64 and reclaim $0.70 with conviction, the path toward $0.77 opens up once again. Sustained strength above that level could push momentum toward $0.85, while a failure to hold support risks keeping ADA trapped in a sideways range until fresh liquidity enters. For investors seeking a complementary angle, PepeNode (https://pepenode.io/) offers a community-driven and utility-rich ecosystem that contrasts ADA’s technical focus. Track ADA’s market structure and confirmation signals on TradingView for timing clarity.
Buchenweg, Karlsruhe, Germany
For more information about Pepenode (PEPENODE) visit the links below:
Website: https://pepenode.io/
Whitepaper: https://pepenode.io/assets/documents/whitepaper.pdf
Telegram: https://t.me/pepe_node
Twitter/X: https://x.com/pepenode_io
Disclosure: Crypto is a high-risk asset class. This article is provided for informational purposes and does not constitute investment advice.
CryptoTimes24 is a digital media and analytics platform dedicated to providing timely, accurate, and insightful information about the cryptocurrency and blockchain industry. The enterprise focuses on delivering high-quality news coverage, market analysis, project reviews, and educational resources for both investors and enthusiasts. By combining data-driven journalism with expert commentary, CryptoTimes24 aims to become a trusted global source for emerging trends in decentralized finance (DeFi), NFTs, Web3 technologies, and digital asset markets.
This release was published on openPR.
XRP is drawing attention again after a stretch of calm trading. The token has held firm between $2.38 and $2.46, with renewed ETF chatter bringing sidelined capital back into play. Thanks to its sizable market cap and entrenched role in blockchain payments, XRP remains one of the clearest gauges of sentiment around real-world crypto utility. When XRP starts to move, speculation about testing old highs usually follows. These shifts often coincide with rising liquidity and stronger narratives across the payments sector. Alongside XRP, traders keeping an eye on utility-driven plays are also watching projects like Bitcoin Hyper (HYPER) (https://bitcoinhyper.com/), which could benefit from any broader rotation toward functional, payment-focused tokens.
What’s Powering XRP’s Momentum Right Now
XRP is back on traders’ radar as ETF speculation heats up. The token’s steady climb between $2.38 and $2.46 reflects a cautious accumulation phase rather than pure hype. The main catalyst remains ETF expectations, with market desks gradually adjusting exposure in anticipation of potential product approvals. On-chain data adds weight to the story – large wallet activity has picked up, and spot trading volumes have increased across major exchanges, signaling renewed institutional interest. While timing for any formal ETF decision remains unclear, sentiment around XRP has shifted from passive optimism to quiet confidence.
The market now treats Ripple’s token less like a speculative trade and more like a bellwether for blockchain-based payment adoption. Analysts often look to aggregated projections and technical models such as CoinCodex’s XRP forecast to shape their positioning, mapping out likely ranges as filings progress and liquidity deepens.
XRP Price Outlook: Technical Setup and Market Structure
Technically, XRP’s chart looks coiled for a larger move. Overhead resistance remains strong between $2.50 and $3.00 – a zone that has repeatedly capped rallies over recent months. On the downside, buyers continue to step in between $2.20 and $2.30, keeping the structure intact. A clean daily close above $3.00 would likely trigger momentum algos and open a path toward the $3.35 to $4.47 region. Failure to clear that ceiling, however, could keep XRP locked in consolidation until new catalysts arrive. Short-term traders are watching liquidity spikes and volume expansion closely.
Tools like XRPUSD charts on TradingView (https://www.tradingview.com/symbols/XRPUSD/) provide real-time insight into whether a breakout has genuine buying pressure behind it or if it’s just noise before another reset. The next few sessions will likely determine whether XRP enters a sustained uptrend or continues oscillating within its current range.
Why This ETF Narrative Matters for Crypto Markets
An XRP-linked ETF approval would mark a watershed moment for digital payments infrastructure. It would bring Ripple’s settlement technology closer to traditional finance rails, boosting credibility not just for XRP but for utility-driven assets in general. Reports such as Coinpedia’s coverage of the first actively managed XRP ETF filing show how institutional coverage is expanding, pulling new capital into both large-cap and mid-tier assets. Even though XRP’s massive circulating supply can limit short-term volatility, its direction tends to anchor broader market sentiment. When XRP moves, it often signals how traders view blockchain’s integration into real-world finance. A confident, orderly rise in XRP typically draws liquidity toward payment-oriented projects, setting off secondary rallies in networks that share similar fundamentals.
Bitcoin Hyper: A Utility Play Gaining Traction
As capital rotates toward functional, high-performance networks, emerging projects like Bitcoin Hyper (HYPER) (https://bitcoinhyper.com/) are drawing increased attention. Unlike meme-based tokens chasing viral cycles, HYPER focuses on throughput, stability, and practical payment utility. Its architecture is designed to handle rapid settlement with minimal transaction costs, aligning neatly with the same themes driving interest in XRP. If investors continue to favor networks that solve real adoption problems rather than those built purely on narrative, HYPER could benefit from that rotation.
Both XRP and Bitcoin Hyper represent a shift in market maturity – a pivot away from speculative froth toward sustainable infrastructure that can actually power on-chain economies.
While each carries its own risks, together they frame the next phase of blockchain evolution: a cycle where speed, interoperability, and usability dictate value more than meme momentum ever could. For traders tracking the utility narrative, keeping XRP and HYPER on the same screen isn’t just smart – it’s strategic.
Buchenweg, Karlsruhe, Germany
For more information about Bitcoin Hyper (HYPER) visit the links below:
Website: https://bitcoinhyper.com
Whitepaper: https://bitcoinhyper.com/assets/documents/whitepaper.pdf
Telegram: https://t.me/btchyperz
Twitter/X: https://x.com/BTC_Hyper2
Disclosure: Crypto is a high-risk asset class. This article is provided for informational purposes and does not constitute investment advice.
CryptoTimes24 is a digital media and analytics platform dedicated to providing timely, accurate, and insightful information about the cryptocurrency and blockchain industry. The enterprise focuses on delivering high-quality news coverage, market analysis, project reviews, and educational resources for both investors and enthusiasts. By combining data-driven journalism with expert commentary, CryptoTimes24 aims to become a trusted global source for emerging trends in decentralized finance (DeFi), NFTs, Web3 technologies, and digital asset markets.
This release was published on openPR.
Solana price is hovering near a key demand zone, with participants eyeing whether the recent selloff marks a final shakeout before a major bullish reversal.
Volatility remains high across Solana, but history suggests the current drop may be setting up something bigger. SOL has built a reputation for sharp recoveries after fear-driven selloffs, and this time appears no different. With prices hovering near key demand zones and traders split between caution and anticipation, the market seems to be preparing for its next major move.
Solana current price is $162.15, up 3.55% in the last 24 hours. Source: Brave New Coin
The current Solana weekly chart highlights a classic setup where bearish candles often precede sharp reversals. The price has been repeatedly showing this pattern, deep red closes followed by multi-week recoveries. Historical data support this view, with similar formations around $120, $150, and $175 leading to strong upside reversals. This time, the pattern looks nearly identical, but traders are cautious that it could still be a manipulative sweep before a breakout.

Solana’s weekly structure mirrors previous recovery phases, where deep red candles often preceded major rallies. Source: Batman via X
Famous crypto analyst Batman suggests that such candle structures typically act as liquidity traps, luring late shorts before trend expansion resumes. With wicks extending towards the $140 zone and demand forming above $145 to $150, the market seems to be preparing for volatility compression. If the reaction mirrors past phases, the coming weeks could see a rebound towards $185 to $200, confirming another bear trap in Solana’s historical cycle.
According to Trader Koala, a critical range is forming between $155 to $160, where Solana price is showing its first signs of stabilization since the breakdown. Price is currently basing near this zone, testing previous imbalance support while reclaiming the short-term EMA cluster on the 4H chart. Volume behavior shows clear absorption, and RSI divergence hints that sellers may be losing momentum.
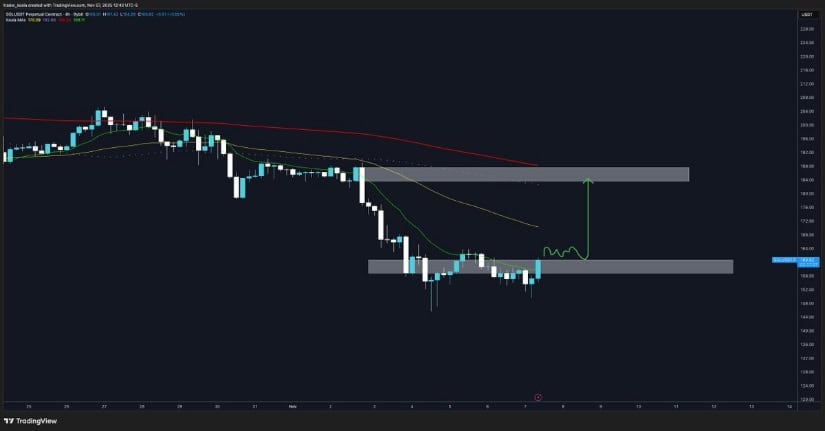
Solana price is stabilizing between $155 and $160 as early bullish signals reappear across lower timeframes. Source: Trader Koala via X
A weekly close above $160 would mark the confirmation point for a rally towards $185 to $190, filling the previous inefficiency visible on the chart. If Solana price manages to sustain that level, market structure would shift bullishly for the first time since September, signaling the beginning of a recovery leg within a broader corrective cycle.
Macro structure remains encouraging, even after months of pullback. Solana continues to respect the 0.618 Fibonacci retracement, bouncing sharply from $150. The overall higher-timeframe picture shows a series of higher lows, reflecting steady accumulation through each correction phase.
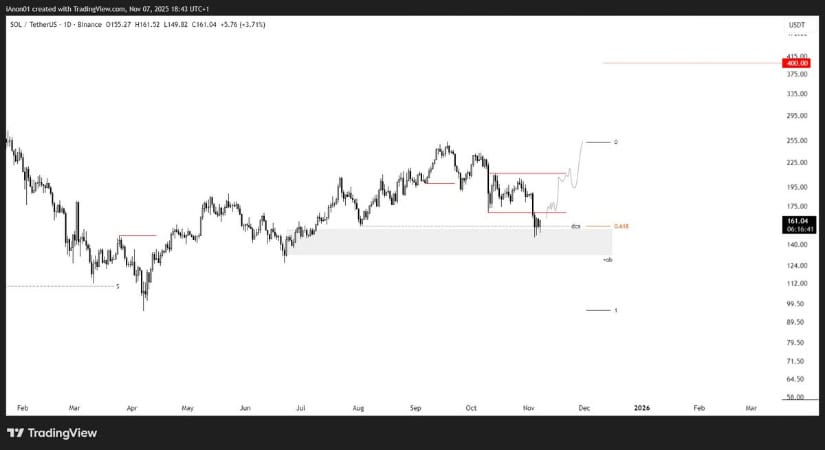
Solana maintains its long-term bullish structure, with analysts eyeing a potential continuation towards the $375–$400 zone. Source: iWantCoinNews via X
As iWantCoinNews outlines, if this base holds and Solana price continues reclaiming $185 and $255, the broader path towards $375 to $400 remains valid. This projection fits the same cyclical expansion patterns observed in prior market phases, making the current retracement a potential reaccumulation period before the next macro impulse wave.
A major on-chain event further supports Solana’s strong fundamentals. Lookonchain reported that Circle minted 1.25 billion USDC on the Solana blockchain within just 24 hours, one of the largest single-day injections of stablecoin liquidity on any network this quarter.
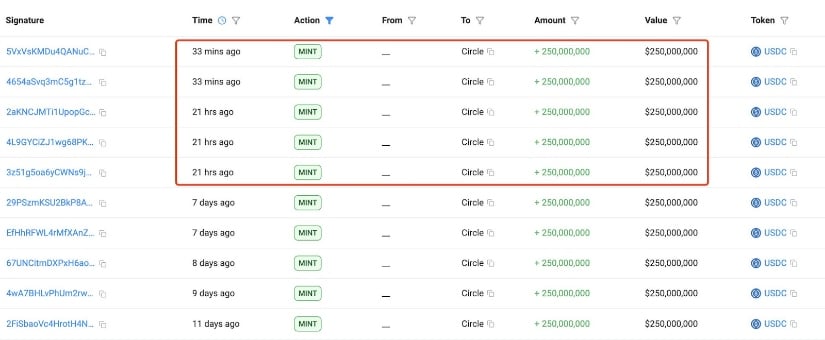
Circle’s 1.25 billion USDC mint on Solana marks one of the largest liquidity injections this quarter, signaling renewed network strength. Source: Lookonchain via X
This minting spree effectively increases liquidity depth, indirectly benefiting SOL’s price dynamics. Historically, similar events have coincided with transaction surges and fee revenue spikes, reinforcing Solana’s position as a leading smart contract platform.
Solana’s structure continues to show signs of underlying resilience despite recent volatility. Price is consolidating above $150 to $155, setting the stage for a potential bullish reversal as long as it maintains momentum above this key base. The repeated historical pattern of bearish-to-bullish weekly candles further strengthens the case for near-term recovery.
If Solana price reclaims $160 to $165, upside continuation towards $190 and later $350 to $400 becomes highly plausible. Combined with liquidity expansion from USDC minting and solid technical confluence, the market appears poised for a steady rebound phase, supported by both price structure and fundamentals.
Bitcoin (BTCUSD) is currently trading at $101,468.15, experiencing a slight uptick of 0.18% today. With a recent day low of $98,892.97 and a high of $107,269.85, Bitcoin’s price action continues to draw the market’s attention. What does this mean for the future, especially with forecasts touching the $142,555 mark? Let’s dive into the numbers.
Bitcoin’s current market dynamics suggest intriguing potential. The price averages—$112,816 over 50 days and $110,126 over 200 days—indicate a pullback. However, short-term forecasts from Meyka AI predict a monthly target of $142,555.95, alongside a quarterly forecast of $141,151.74. Despite a yearly forecast dip to $96,114.59, the long-term outlook remains bullish, projecting $161,345 in five years. Such targets indicate potential growth, but always consider that forecasts can change due to macroeconomic shifts and other factors.
Technical analysis shows a mix of strengths and weaknesses. The Relative Strength Index (RSI) at 40.72 signifies that Bitcoin is not in overbought territory yet, while the Average Directional Index (ADX) of 27.80 suggests a strong trend existing. However, bearish signals like a negative MACD of -2912.91 and Awesome Oscillator at -8953.15 might concern some traders. Nevertheless, the Bollinger Bands show the price currently trading near its lower band, suggesting a potential upward correction.
Market sentiment is a blend of caution and optimism. With a market cap of approximately $2 trillion and a rising trading volume surpassing average levels (1.21 relative volume), investor interest appears robust. News about Bitcoin’s widespread adoption and evolving regulatory landscape continues to impact sentiment positively. Still, with a Money Flow Index (MFI) at 37.54, investors are advised to monitor liquidity flows closely. Past fluctuations, such as a 15.77% decline over three months, underscore the market’s volatility.
In summary, while Bitcoin’s path to $142,500 or beyond is filled with both challenges and potential, market indicators and sentiments reflect a complex yet optimistic scenario. Investors should remain vigilant as forecasts can change due to various factors. For detailed price history and real-time updates, visit the BTCUSD page on Meyka AI.
Bitcoin is currently priced at $101,468.15, with a slight increase noted today of 0.18% from the previous close of $101,290.5. It has a daily range between $98,892.97 and $107,269.85.
Short-term forecasts show potential highs with a monthly target of $142,555.95 and quarterly forecast of $141,151.74. However, a yearly dip to $96,114.59 is expected, with a bullish long-term five-year forecast of $161,345.
Bitcoin’s technical indicators present mixed signals. While RSI is at a balanced 40.72, showing it’s not overbought, MACD and Awesome Oscillator reflect bearish sentiment. ADX shows a strong ongoing trend at 27.80.
Despite recent price drops, market sentiment is moderately positive, reflected in a market cap around $2 trillion and strong trading volumes exceeding averages.
For comprehensive market updates and forecasts on BTCUSD, you can visit the BTCUSD page on Meyka AI, which provides real-time insights.
Disclaimer:
Cryptocurrency markets are highly volatile. This content is for informational purposes only.
The Forecast Prediction Model is provided for informational purposes only and should not be considered financial advice.
Meyka AI PTY LTD provides market data and sentiment analysis, not financial advice.
Always do your own research and consider consulting a licensed financial advisor before making investment decisions.
Jessie A Ellis
Nov 08, 2025 06:57
MATIC price prediction shows potential recovery to $0.45-$0.58 range within 4-6 weeks, though current bearish momentum suggests caution with $0.35 support critical.
Polygon (MATIC) presents a complex technical picture as we analyze the latest data for our comprehensive MATIC price prediction. Trading at $0.38, the token sits near its 52-week low of $0.37, yet several technical indicators suggest a potential recovery scenario could unfold over the coming weeks.
• MATIC short-term target (1 week): $0.40-$0.42 (+5-11%)
• Polygon medium-term forecast (1 month): $0.45-$0.58 range (+18-53%)
• Key level to break for bullish continuation: $0.43 (SMA 20 resistance)
• Critical support if bearish: $0.35 (immediate support) and $0.33 (strong support)
The latest analyst predictions reveal a significant disconnect between short-term forecasts and current market reality. Recent MATIC price prediction models from Changelly suggest modest targets around $0.19-$0.194, while CoinArbitrageBot’s AI models project higher targets near $0.228. However, these predictions appear outdated given MATIC’s current price of $0.38, suggesting either the models haven’t adjusted to recent price action or there’s potential for significant downside risk.
This disparity highlights the challenge in cryptocurrency forecasting, where rapid price movements can quickly invalidate short-term predictions. The consensus among recent forecasts indicates bullish sentiment, but the actual price action tells a different story, with MATIC experiencing a -0.29% decline in the past 24 hours.
Our Polygon technical analysis reveals several key indicators that shape our MATIC price prediction. The RSI reading of 38.00 places MATIC in neutral territory, avoiding oversold conditions but indicating selling pressure remains present. This positioning suggests room for downward movement before reaching truly oversold levels that might trigger buying interest.
The MACD histogram at -0.0045 confirms bearish momentum in the short term, with the MACD line (-0.0246) below the signal line (-0.0202). This technical configuration typically indicates continued selling pressure, though the relatively shallow negative readings suggest the bearish momentum isn’t extremely strong.
Volume analysis shows $1.07 million in 24-hour trading on Binance, which is relatively modest and indicates lack of strong conviction in either direction. This low volume environment could mean that any significant news or technical breakout might result in amplified price movements.
The bullish scenario for our MATIC price target focuses on the token’s position within the Bollinger Bands. At a %B position of 0.29, MATIC trades closer to the lower band ($0.31) than the upper band ($0.56), suggesting potential mean reversion toward the middle band at $0.43.
For the Polygon forecast to turn bullish, MATIC must first reclaim the SMA 20 level at $0.43. This would represent a 13% gain from current levels and could trigger algorithmic buying from trend-following strategies. A successful break above $0.43 opens the path toward the SMA 50 at $0.45, followed by the upper Bollinger Band near $0.56.
The ultimate bullish MATIC price target sits at the strong resistance level of $0.58, which coincides with both technical resistance and the upper Bollinger Band. Reaching this level would represent a 53% gain from current prices and would likely require positive fundamental catalysts alongside technical momentum.
The bearish scenario cannot be ignored in our comprehensive MATIC price prediction analysis. The immediate support at $0.35 represents just an 8% decline from current levels, making it highly vulnerable if selling pressure intensifies. A break below this level would likely trigger stop-loss orders and automated selling.
The critical support level at $0.33 aligns with the strong support identified in our technical analysis. A breakdown below this level would be particularly concerning, as it would represent a new 52-week low and could trigger capitulation selling. Such a scenario might see MATIC testing the $0.30 level, where the lower Bollinger Band provides some mathematical support.
Based on our Polygon technical analysis, the decision to buy or sell MATIC depends heavily on risk tolerance and time horizon. The current price action suggests waiting for either a clear reversal signal or a deeper correction might be prudent.
For aggressive traders, a position could be initiated near current levels with a tight stop-loss below $0.35. This strategy offers a favorable risk-reward ratio if MATIC can reclaim the $0.43 resistance level. Conservative investors might wait for a successful break above $0.43 with increased volume before establishing positions.
Risk management remains crucial given the bearish momentum indicators. Any position should include stop-loss orders below $0.33 to protect against further downside. Position sizing should be conservative, as the technical picture suggests higher volatility ahead.
Our comprehensive MATIC price prediction suggests a cautiously optimistic outlook for the medium term, despite current technical weakness. The most likely scenario sees MATIC consolidating between $0.35-$0.43 over the next 1-2 weeks before attempting to break higher toward our $0.45-$0.58 price targets.
The Polygon forecast carries medium confidence due to conflicting signals in the technical indicators. While RSI levels suggest room for recovery and Bollinger Band positioning indicates potential mean reversion, the negative MACD momentum and proximity to 52-week lows warrant caution.
Key indicators to watch for confirmation include volume expansion above 2 million daily, RSI moving above 50, and most importantly, a decisive break above the SMA 20 at $0.43. Invalidation of this bullish scenario would occur on a close below $0.33, which would likely lead to further downside testing toward $0.30 or lower.
Timeline expectations suggest any significant move higher would likely develop over 4-6 weeks, requiring patience from investors seeking to capitalize on this potential Polygon recovery scenario.
Image source: Shutterstock
As the crypto market buzzes with activity, Bitcoin (BTC) currently trades at $101,468.15, marking a 2.31% dip from the previous day. With a high of $107,269.85 and a low of $98,892.97, investors are closely watching the movements to gauge its next direction. Could Bitcoin reach the projected price of $142,556 by year-end? Let’s delve into the data and predictions.
Bitcoin’s current price of $101,468.15 sits below its 50-day average of $113,119.94 and its 200-day average of $110,046.36. Despite this downturn, forecasts suggest a potential climb to $142,556 by December. However, longer-term projections indicate a dip to $96,114 within a year. Factors contributing to these targets include historical performance trends, with a notable 1,060.81% increase over the past five years.
A dive into technical indicators reveals mixed signals. The RSI stands at 38.96, indicating near oversold conditions, and the ADX at 25.94 shows a strong trend. However, the MACD suggests bearish momentum, as both the MACD line (-2,486.11) and signal line (-1,688.61) are negative, with a histogram at -797.49. Forecasts can change due to macroeconomic shifts, regulations, or unexpected events affecting the crypto market.
The market sentiment around Bitcoin is cautious yet optimistic. The recent decrease in price by 2.31% could be attributed to profit-taking behavior or broader market corrections. An analysis of volume shows a relative increase with a volume of 110,967,184,773, exceeding the average of 718,412,463, suggesting heightened trading activity. Meyka AI provides an interactive platform for assessing these trends, offering investors valuable insights into market movements.
In conclusion, while Bitcoin’s immediate future shows potential for recovery to $142,556, it’s crucial to remain aware of prevailing market conditions and sentiments. The mixed technical outlook suggests careful monitoring is needed before anticipating significant price shifts. As always, the crypto environment is subject to change from various external influences.
As of now, Bitcoin is priced at $101,468.15, reflecting a 2.31% decrease from its previous closing price of $103,869.00.
BTCUSD
Projections are varied, with some forecasts suggesting Bitcoin could rise to $142,556 by December, subject to market conditions and sentiment shifts.
Important indicators include RSI (38.96, near oversold), MACD indicating bearish pressure, and ADX at 25.94 signaling a strong trend.
Recent declines, like the 2.31% drop, might be from profit-taking or market corrections, reflecting broader market trends and investor strategies.
Increased trading volume can indicate strong market interest or anxiety, leading to price volatility. Bitcoin’s current trading volumes are significantly above averages.
Disclaimer:
Cryptocurrency markets are highly volatile. This content is for informational purposes only.
The Forecast Prediction Model is provided for informational purposes only and should not be considered financial advice.
Meyka AI PTY LTD provides market data and sentiment analysis, not financial advice.
Always do your own research and consider consulting a licensed financial advisor before making investment decisions.
Alvin Lang
Nov 07, 2025 20:09
MATIC price prediction suggests potential 18-32% upside to $0.45-$0.50 if bulls can break $0.42 resistance, with critical $0.35 support holding firm in current consolidation phase.
Polygon’s MATIC token sits at a critical juncture as technical indicators paint a mixed picture for the coming weeks. With the token trading at $0.38 and showing signs of potential reversal, our comprehensive MATIC price prediction analysis reveals key levels that could determine the next major move.
• MATIC short-term target (1 week): $0.42 (+10.5%) – Breaking EMA resistance
• Polygon medium-term forecast (1 month): $0.45-$0.50 range (+18-32% upside)
• Key level to break for bullish continuation: $0.42 (EMA 26 resistance)
• Critical support if bearish: $0.35 (immediate support) and $0.33 (strong support)
The latest analyst predictions for MATIC show a notable divergence in short-term versus medium-term outlooks. Blockchain.News presents the most bullish Polygon forecast, targeting $0.45-$0.70 with potential for a breakout above the critical $0.58 resistance level within 4-6 weeks. This MATIC price target aligns with our technical analysis showing strong resistance at this level.
In contrast, more conservative predictions from CoinLore suggest a near-term MATIC price target of $0.3763, while CoinArbitrageBot’s AI-driven model forecasts a bearish scenario toward $0.19876. The consensus appears split between those expecting continued consolidation and analysts anticipating a medium-term recovery contingent on breaking key technical levels.
The most realistic Polygon forecast appears to be in the $0.45-$0.50 range for the next month, assuming current support levels hold and momentum indicators begin to improve.
Current Polygon technical analysis reveals MATIC is positioned just above critical support levels with several indicators suggesting a potential reversal setup. The RSI at 38.00 indicates the token is approaching oversold territory without being extremely bearish, providing room for upward movement.
The MACD histogram at -0.0045 shows bearish momentum is weakening, though not yet turning positive. More importantly, MATIC’s position within the Bollinger Bands at 0.29 suggests the token is in the lower portion of its recent range, historically a zone where reversals often occur.
Volume analysis shows relatively stable trading at $1.07 million on Binance, indicating sustained interest despite the recent price weakness. The key technical setup revolves around MATIC’s ability to reclaim the EMA 26 at $0.42, which would signal the beginning of a more substantial recovery.
The primary bullish MATIC price prediction hinges on breaking above $0.42 (EMA 26) with conviction. Once this level is cleared, the path opens toward $0.45 (SMA 50), representing our initial MATIC price target. A sustained move above $0.45 could trigger momentum toward $0.50-$0.55, bringing MATIC closer to the critical $0.58 resistance level highlighted by multiple analysts.
For this bullish Polygon forecast to materialize, we need to see RSI climbing above 45, MACD turning positive, and volume increasing on any upward moves. The 52-week high at $1.27 remains a distant target, but breaking $0.58 would represent a significant milestone in MATIC’s recovery.
The bearish scenario for our MATIC price prediction involves a breakdown below the immediate support at $0.35. Such a move would likely trigger selling toward the strong support zone at $0.33, representing the lower Bollinger Band level.
A break below $0.33 would invalidate the current consolidation pattern and could lead to a test of the 52-week low at $0.37. This scenario becomes more likely if Bitcoin experiences significant weakness or if broader market sentiment deteriorates sharply.
Based on current Polygon technical analysis, the question of whether to buy or sell MATIC depends heavily on risk tolerance and timeframe. For conservative investors, waiting for a clear break above $0.42 provides better risk-adjusted entry with a stop-loss at $0.37.
More aggressive traders might consider accumulating between $0.36-$0.38 with a tight stop-loss at $0.34. This strategy offers a favorable risk-reward ratio toward our MATIC price target of $0.45-$0.50.
Position sizing should remain conservative given the mixed technical signals. A maximum 2-3% portfolio allocation seems prudent until clearer directional momentum emerges.
Our comprehensive MATIC price prediction suggests a cautiously optimistic outlook for the next 2-3 weeks, with targets of $0.45-$0.50 representing realistic upside potential. This Polygon forecast carries medium confidence given the current technical setup and analyst consensus around these levels.
Key indicators to watch include RSI breaking above 45, MACD turning positive, and most critically, MATIC sustaining above $0.42. Failure to hold $0.35 support would invalidate this bullish thesis and shift focus to lower targets.
The prediction timeline spans 2-4 weeks for initial targets, with the broader $0.58 resistance test potentially occurring within 6-8 weeks if momentum sustains. Investors should monitor Bitcoin’s price action closely, as broader market sentiment will significantly influence MATIC’s ability to achieve these projected levels.
Image source: Shutterstock
 Surge to 2K This Month?")


