The main category of Crypto News.
You can use the search box below to find what you need.
[wd_asp id=1]
The main category of Crypto News.
You can use the search box below to find what you need.
[wd_asp id=1]
XRP price today trades near $2.41, recovering modestly after dipping to $2.09 earlier in the week. The token remains capped under a descending triangle resistance, with volatility tightening as derivatives data shows fading speculative appetite.
The daily chart highlights a narrowing structure with XRP price consolidating between $2.09 support and $2.56 resistance. The long-term ascending trendline continues to act as a base, while repeated rejections from the descending triangle ceiling keep upside moment…
Read The Full Article XRP Price Prediction: Buyers Hold Key Support But Derivatives Signal Weak Momentum On Coin Edition.
The XRP price today hovers around $2.40, marking a modest weekly decline from $2.49 but maintaining a firm technical structure above crucial support levels.
Despite short-term consolidation, XRP continues to attract attention for its resilience, with traders closely monitoring the narrowing price range between $2.33 and $2.44 for the next major move.
XRP price today remains steady around $2.41, showing minimal change over the past 24 hours while daily trading volume slipped by nearly 16% to about $4.18 billion. The subdued activity suggests a period of consolidation, as traders appear to be taking a cautious “wait and watch” stance amid uncertain market catalysts.
XRP was trading at around $2.41, up 0.47% in the last 24 hours at press time. Source: XRP price via Brave New Coin
Over the past week, XRP has gained a modest 0.27%, bringing its market capitalization to approximately $144.2 billion. The drop in trading volume, paired with steady price movement, indicates a phase of market stabilization where investors may be repositioning ahead of potential shifts in the broader crypto landscape.
XRP’s structure remains technically sound despite recent volatility. The token is currently trading within a descending channel bounded by resistance at $2.44 and support at $2.33, signaling that price compression is reaching a tipping point.

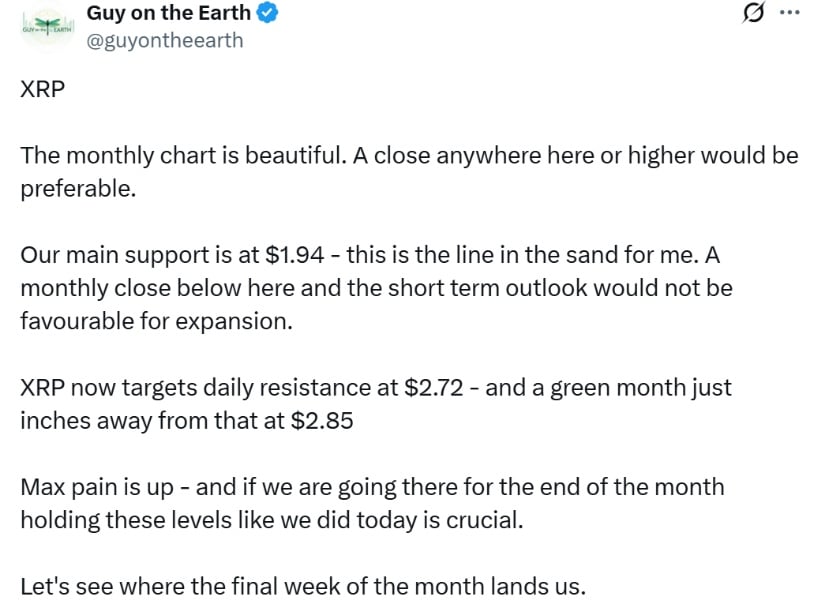
XRP’s monthly chart remains bullish, with key support at $1.94 and targets at $2.72–$2.85, as holding current levels is vital for continued upside momentum. Source: @guyontheearth via X
Momentum indicators, including MACD and Stochastic RSI, are stabilizing near neutral levels—often a precursor to a significant directional move. Hourly charts show XRP stabilizing above midrange support at $2.38, forming a tightening volatility band. Such compressions typically precede breakout phases, and a daily close above $2.41 resistance could ignite a run toward $2.72 and beyond.
A widely circulated TradingView analysis supports this view, highlighting a bullish setup on XRP’s monthly chart. The study identifies $1.94 as a strong historical support, while projecting short-term targets between $2.72 and $2.85. A green monthly close above the $2.42 trendline could signal renewed upward momentum, echoing patterns observed during the 2017 and 2021 bull cycles.
Broader sentiment surrounding Ripple (XRP) remains cautiously optimistic. Many traders link XRP’s recent stability to Ripple’s ongoing regulatory progress, which continues to shape investor expectations for 2026 and beyond.
The XRP SEC lawsuit remains a recurring discussion point within the community, though Ripple’s prior legal victories have improved confidence in its long-term outlook. Analysts suggest that a final resolution—or clarity around a potential XRP ETF approval—could act as a major catalyst for institutional inflows.
The price of XRP today consolidates in a narrow range, but underlying momentum hints at brewing volatility. Technical traders are watching the $2.41 resistance closely; a decisive breakout above that zone could confirm bullish continuation, paving the way toward $2.72–$2.85 in the short term.
XRP is approaching daily resistance at $2.72, with a potential green monthly close near the $2.85 level. Source: @guyontheearth via X
On the other hand, failure to hold above $2.33 might invite a retest of $2.28, though most analysts see limited downside given the robust support around the mid-$2 zone.
With institutional traders monitoring Bitcoin’s stability and gold’s pullback for cross-market cues, XRP’s price trajectory could soon align with broader risk-on sentiment. If bullish volume reaccelerates, XRP could potentially extend its uptrend into late 2025—aligning with optimistic XRP price forecasts for 2025 that anticipate a move above $4.
As October nears its end, XRP’s ability to maintain a green monthly close above the $2.42 trendline may prove pivotal for its next leg higher. Analysts point out that such a close would signal renewed buyer conviction and confirm the asset’s ongoing bullish structure on higher timeframes.
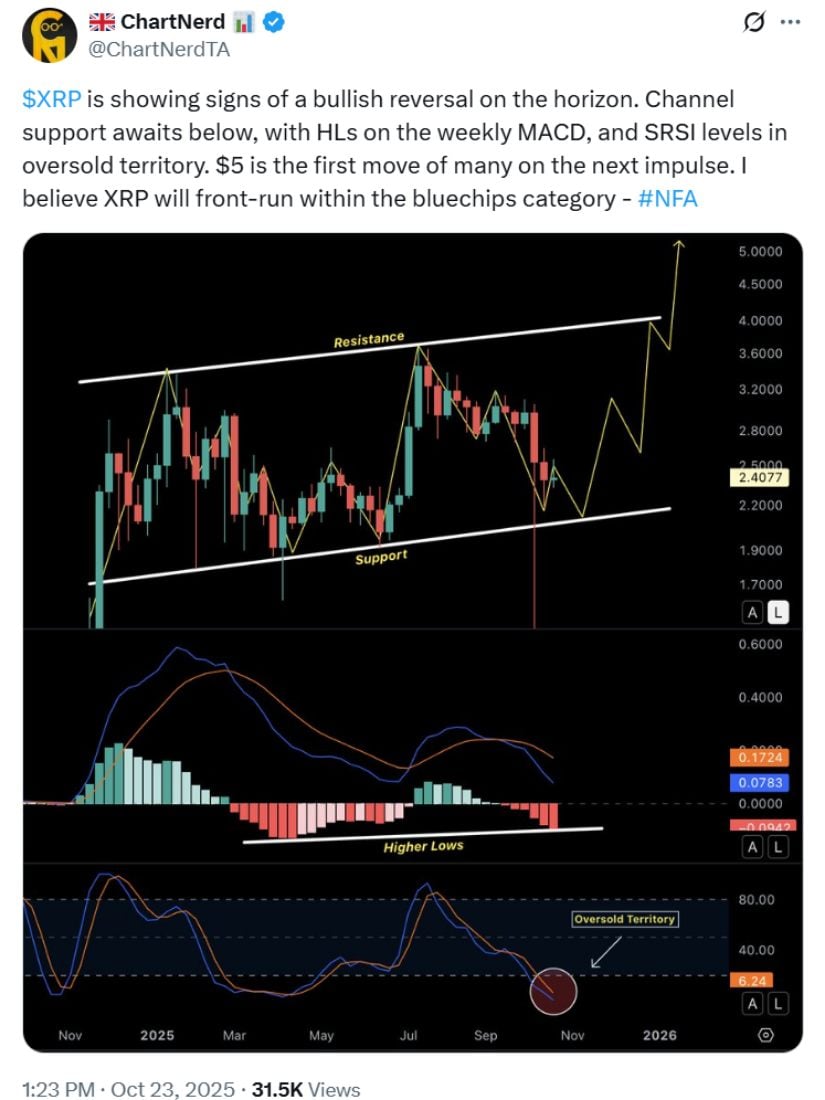
XRP is signaling a bullish reversal, with oversold indicators and rising weekly momentum suggesting a potential breakout toward the $5 level. Source: ChartNerd via X
Despite short-term fluctuations, the Ripple XRP price remains structurally intact, supported by strong fundamentals and improving sentiment within the crypto market. As trading volumes build and volatility compresses, traders anticipate a directional breakout—potentially setting the tone for the next phase of XRP’s 2025 market cycle.
PRESS RELEASE
Published October 23, 2025
The Aave decentralized autonomous organization has introduced a major proposal to establish a token buyback program. The plan would use up to $50 million in annual protocol revenue to repurchase Aave tokens from the open market.
This move by a leading DeFi protocol shows confidence and a focus on returning value to token holders. It creates a positive sentiment that could influence the market, including the Dogecoin price prediction.
As established projects deploy capital, investors are also keenly watching opportunities like DeepSnitch AI. More than $450k has been raised on stage 2 of its presale, which is expected to sell out soon.
The proposal, submitted by the Aave Chan Initiative (ACI), aims to make token buybacks a permanent and ongoing feature of Aave’s economic model. If approved, the Aave Finance Committee (AFC) and TokenLogic would be tasked with executing the program. They would repurchase between $250,000 and $1.75 million worth of Aave tokens each week. The amount will be adjusted based on prevailing market conditions and available liquidity.
This will help institutionalize buybacks, effectively turning the DAO into an active capital allocator that consistently uses protocol revenue to support the token’s value. The proposal will now move through the Aave Request for Comment (ARFC) phase. It will allow the community to provide feedback before it proceeds to a Snapshot vote and a final on-chain governance confirmation.
The ACI explained that this plan depends on the positive results of previous buyback initiatives within the Aave ecosystem. Notably, in April, the price of Aave increased after the community approved a smaller token buyback of $4 million.
The DeepSnitch AI presale is where investors are looking for big potential. It has already raised over $450,000, with its price hitting $0.01992. That’s a 32% gain for its earliest backers. And if history repeats, DeepSnitch AI could benefit from a massive bullish cycle expected in November and December. A similar trend occurred last year, when Bitcoin and ICP increased by 40% and 50%, respectively.
DeepSnitch AI is perfectly positioned to get a large part of the crypto market since half of crypto holders believe AI coins will outperform other crypto sectors in 2025. It is integrating into the AI coin market gap, a sector projected to grow 25 times by 2033. It combines this with the viral power of a meme coin, dedicating a huge 30% of its tokens to marketing to ensure everyone hears about it.
Moreover, it offers an asymmetric upside that giants like Aave or DOGE can no longer match. DeepSnitch AI is still in that tiny presale where even small investments can provide outsized multiples.
Investors believe it could deliver an $80,000 return. Let’s look at the calculation. For a $1,000 investment today to become $80,000, an 80x return is needed. At the current presale price, the DSNT token would only need to reach about $1 after its launch. For an AI project targeting Telegram’s billion users, that goal is firmly within reach.
It’s also built for a massive network effect. By integrating directly with Telegram, where half the crypto conversation happens, it doesn’t need to build an audience from scratch. DeepSnitch AI meets traders right where they are.

Aave remains a cornerstone of the decentralized finance ecosystem. Recent activity shows continued engagement, with the trading firm GSR depositing Aave tokens onto Binance. Many believe this was likely to enhance liquidity and facilitate market activity. This indicates ongoing institutional participation in the Aave market.
Furthermore, Aave is increasing its collateral options by partnering with Maple Finance to integrate institutional assets. This move aims to reduce the gap between traditional finance and DeFi.
Moreover, it could potentially attract a new class of borrowers and lenders to the platform. With approximately $25 billion in outstanding loans on Ethereum and nearly 1,000 unique daily borrowers, Aave’s scale and influence in the DeFi space remain undeniable.

Dogecoin (DOGE) has declined by 3.5% over the past week, slightly underperforming the global cryptocurrency market’s 2.7% decline, although it fared better than most Smart Contract Platform tokens, which fell 5.8%.
In a move mixing crypto culture with sports heritage, the Dogecoin Foundation’s commercial arm, House of Doge, has acquired a majority stake in Italian football club US Triestina Calcio 1918. The acquisition, made alongside Brag House Holdings, aims to support ventures that combine community impact, cultural significance, and sustainable growth. The Dogecoin price prediction in the next 30 days suggests a 13% increase.
The Aave buyback proposal is a sign of strength in DeFi, but the most explosive gains often come from the new crypto projects. DeepSnitch AI offers that opportunity. The math shows a clear path to a potential $80,000 return from a small investment.
With its presale gaining momentum and tapping into the massive AI sector, this project is built for the future. The presale price increases based on countdowns, and many won’t want to miss the chance to get in early.
Visit the official DeepSnitch AI website to secure your presale position today.

A major buyback by a leading DeFi protocol like Aave can improve overall market sentiment. This positive mood could indirectly benefit memecoins like Dogecoin, potentially improving the Dogecoin forecast 2025.
There have been no Elon Musk Dogecoin updates recently. Elon Musk posted a recent video, but it was targeted at Floki Inu.
The current DOGE future outlook is mixed. Apparently, the meme coin faces strong bearish technical pressure.
DeepSnitch AI uses a network effect by integrating its tools directly into Telegram. Since Telegram hosts a massive user base already engaged in crypto discussions, it increases adoption.
Disclaimer:
This article is provided for informational and educational purposes only and does not constitute financial, investment, or trading advice. Cryptocurrency investments are highly volatile and involve significant risk, including the potential loss of your capital. Always conduct independent research and consult with a qualified financial advisor before making investment decisions.
The projects mentioned, including DeepSnitch AI, Chainlink, and Polkadot, are referenced for informational purposes only. Any references to performance, returns, or price forecasts are speculative and not guaranteed.
The author and publisher are not responsible for any losses incurred as a result of reliance on this content. Readers are encouraged to verify all information independently before participating in any presale, token purchase, or investment opportunity.
![]()
COMTEX_469742002/2909/2025-10-23T11:40:51
Cardano price today trades around $0.63, holding slightly above a key ascending trendline that has supported its structure since late 2024. Despite sustained selling pressure and weak inflows, the coin remains within a broader symmetrical triangle that continues to compress between resistance near $0.77 and long-term support at $0.60.
The daily chart shows Cardano price action respecting the lower boundary of its multi-month ascending support, even after repeated rejections from the upper tre…
Read The Full Article Cardano Price Prediction: Traders Await Key Breakout After $1.34M Net Outflows On Coin Edition.
XRP ETFs could experience significant growth if they capture just half of Bitcoin ETF inflows over the next two years. Market watchers believe that once the U.S. Securities and Exchange Commission (SEC) approves XRP ETFs, they will experience substantial inflows of capital. This could result in significant price movements for XRP. Analysts expect that these inflows could result in a significant surge in XRP’s market capitalization.
The SEC has yet to approve multiple XRP spot ETFs due to the ongoing U.S. government shutdown. Several filings, including those from Grayscale, 21Shares, and Bitwise, have faced delays, with deadlines ranging from October 18 to October 20. However, other firms, such as CoinShares and Franklin Templeton, have later filing deadlines. Despite the setbacks, experts like Oliver Michel, CEO of Tokentus, remain optimistic about future approval once the government shutdown ends.
Industry leaders, including Steven McClurg, CEO of Canary Capital, anticipate that XRP ETFs will attract substantial capital inflows. McClurg predicts inflows ranging between $5 billion $10 billion in the first month after launch. Should this forecast materialize, it would mark a significant milestone for XRP ETFs.
If XRP ETFs capture 50% of the $26.6 billion in Bitcoin ETF inflows from 2025, it would represent $13.3 billion for XRP. Ethereum ETFs experienced net inflows of $14.57 billion in just over a year. These figures demonstrate that capturing a portion of Bitcoin’s inflows is within reason for XRP ETFs.
However, capital inflows do not always translate directly into price increases. The inflow-to-valuation multiplier often results in larger spikes in market capitalization. For instance, a $61 million capital inflow raised XRP’s market cap by $16.6 billion in May. This multiplier effect is vital to consider when projecting future price movements.
Ever wondered how much money it takes to cause a 16.6B increase in $XRP market cap?
Since I am tracking every trade on all major spot exchanges, I have the exact $ figure
61M USD. Thats the net market buying pressure we saw over the last 13 hours.
So yes, 61M USD of buy… pic.twitter.com/XDt6FMB0g9
— Dom (@traderview2) May 12, 2025
With a conservative multiplier of 90x, XRP’s market cap could increase by $1.205 trillion over two years. This increase would result in a price of $22.48 per XRP, an 844% rise from its current value of $2.38. Such a dramatic price increase shows the potential impact of large inflows into XRP ETFs.
XRP’s current market cap stands at $143 billion. With an additional $1.205 trillion in market cap, XRP could reach a valuation of $1.348 trillion. This would significantly alter the market dynamics for XRP, making it a major contender in the crypto space.
If XRP ETFs capture a fraction of Bitcoin ETF inflows, the price of XRP could soar. As more institutions and investors turn to XRP ETFs, the price could experience unprecedented growth. The upcoming SEC approval will be crucial in determining how much capital XRP ETFs can attract.
Terrill Dicki
Oct 23, 2025 14:47
MATIC price prediction shows potential 18% upside to $0.45 within 4 weeks, with analysts divided on short-term outlook ranging from $0.20 to $0.80.
Polygon’s MATIC token sits at a critical juncture as technical indicators paint a mixed picture for the Layer-2 scaling solution. With the current price at $0.38, our comprehensive MATIC price prediction analysis suggests a potential recovery toward $0.45 over the next month, representing an 18% upside opportunity.
• MATIC short-term target (1 week): $0.41 (+8%) – Testing EMA 12 resistance
• Polygon medium-term forecast (1 month): $0.43-$0.47 range – Approaching SMA 20 levels
• Key level to break for bullish continuation: $0.43 (SMA 20 resistance)
• Critical support if bearish: $0.35 (immediate support) and $0.33 (strong support)
The latest analyst forecasts reveal significant divergence in MATIC price prediction models. Changelly presents the most conservative outlook with a $0.204 short-term target, suggesting a potential 46% downside from current levels. This bearish stance contrasts sharply with CoinLore’s $0.3712 prediction and PricePredictions.com’s ambitious $0.804742 medium-term forecast.
The wide spread between these Polygon forecast estimates – ranging from $0.20 to $0.80 – reflects the current market uncertainty surrounding MATIC’s direction. However, the consensus gravitates toward cautious optimism, with most analysts acknowledging MATIC’s oversold conditions while remaining wary of broader market headwinds.
Our analysis suggests the market consensus underestimates MATIC’s technical setup for a moderate recovery, particularly given its proximity to key support levels and oversold RSI conditions.
The current Polygon technical analysis reveals a token in transition from oversold conditions toward potential stabilization. MATIC’s RSI of 38.00 sits in neutral territory but leans toward oversold levels, historically presenting buying opportunities for patient investors.
The MACD histogram at -0.0045 indicates bearish momentum is weakening, though it hasn’t yet crossed into positive territory. This suggests the selling pressure that drove MATIC down 70% from its 52-week high of $1.27 may be exhausting itself.
MATIC’s position within the Bollinger Bands at 0.29 confirms it’s trading in the lower portion of its recent range, with the current price sitting between the middle band at $0.43 and lower band at $0.31. This positioning often precedes mean reversion moves toward the middle band.
The key technical development is MATIC’s proximity to its immediate support at $0.35. A successful defense of this level could trigger a bounce toward the SMA 20 at $0.43, aligning with our MATIC price target for the coming month.
The primary bullish scenario for our MATIC price prediction centers on a break above the SMA 20 at $0.43. This would signal the end of the current downtrend and potentially trigger a move toward $0.47-$0.50, where the SMA 50 acts as the next major resistance.
For this Polygon forecast to materialize, MATIC needs to see increased buying volume above the current $1.07 million daily average. A volume surge above $2 million would provide the confirmation needed for sustained upward momentum.
The ultimate bullish target remains the strong resistance at $0.58, which would represent a 53% gain from current levels. However, this scenario requires broader market cooperation and significant fundamental catalysts for Polygon’s ecosystem.
The bearish case for MATIC involves a break below the immediate support at $0.35, which would likely trigger a test of the strong support at $0.33. A failure to hold this level could see MATIC declining toward the Bollinger Band lower boundary at $0.31.
The most concerning scenario aligns with Changelly’s $0.204 prediction, which would materialize if MATIC breaks below all technical support levels. This would require a broader cryptocurrency market decline and would push MATIC near its 52-week low of $0.37.
Risk factors to monitor include sustained trading volume below $1 million, RSI falling below 30, and any break below the $0.33 strong support level.
Based on our technical analysis, the current price level presents a moderate buying opportunity for investors with a 4-6 week investment horizon. The optimal entry strategy involves dollar-cost averaging between $0.36-$0.38, with a stop-loss placed at $0.32 (below strong support).
For aggressive traders, a breakout strategy above $0.43 with volume confirmation offers better risk-reward dynamics. This approach targets the $0.47-$0.50 resistance zone while limiting downside risk through the SMA 20 support.
Position sizing should remain conservative given the mixed technical signals. A 2-3% portfolio allocation represents prudent risk management while allowing participation in potential upside moves.
The buy or sell MATIC decision ultimately depends on individual risk tolerance, but the current technical setup favors patient accumulation over aggressive position building.
Our comprehensive analysis points to a $0.45 MATIC price target within the next month, representing an 18% upside potential. This Polygon forecast carries medium confidence based on the oversold RSI conditions, weakening bearish momentum, and proximity to established support levels.
Key indicators to monitor include the RSI crossing above 40 (bullish confirmation), MACD histogram turning positive, and trading volume exceeding $1.5 million daily. Conversely, a break below $0.35 would invalidate this prediction and suggest further downside toward $0.30-$0.33.
The timeline for this MATIC price prediction extends through late November 2025, with initial confirmation expected within 7-10 trading days. Investors should prepare for continued volatility as MATIC navigates between critical support and resistance levels in the coming weeks.
Image source: Shutterstock
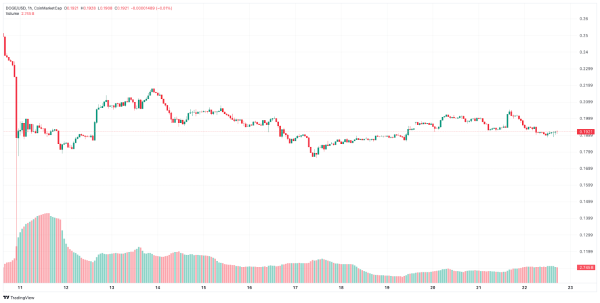
Selling pressure on DOGE appears to have eased in the past 24 hours as the token has retreated by less than 0.1%. The $0.19 level appears to be acting as strong support for now, favoring a bullish Dogecoin price prediction.
Dogecoin has seen its price plummet by nearly 21% in the past month as the market’s appetite for meme coins has been relatively weak this year.
Except for a handful of exotic tokens like MemeCore (M) and Fartcoin (FARTCOIN), the overall performance of tokens in this category has been underwhelming.
However, one development in particular could change things around for $DOGE. According to a prominent X account from the pseudonymous user @Investments_CEO, BlackRock could soon launch a Dogecoin ETF.
This account is followed by more than 600,000 users, so this could reach some ears and end up catalyzing a short-term uptick in DOGE’s price.
In the meantime, the REX-Osprey Dogecoin ETF ($DOJE), the only spot ETF linked to this meme coin and listed in the United States thus far, has attracted over $30 million in assets since its launch.
Looking at the daily chart, Dogecoin has bounced off its trend line support lately and seems ready to restart its uptrend.
There seems to be strong support at around $0.17 and $0.19, and the token could have entered a phase of accumulation as the market waits for the next driver.
Next week’s interest rate decision from the Federal Reserve could provide a boost for cryptocurrencies if the U.S. central bank opts to cut rates as expected.
In that case, DOGE could rapidly rise to $0.23, the key resistance to watch at the moment, and continue to move upwards if positive momentum gains enough traction.
As the crypto market shakes off the latest wave of negative momentum, top crypto presales like Pepenode ($PEPENODE) continue to gain traction as investors keep looking for the next crypto that can deliver 10X or even 100X gains.
Mining cryptocurrencies no longer requires expensive hardware investments as Pepenode ($PEPENODE) has introduced a new trend called mine-to-earn (M2E) that makes this activity fun and hassle-free.
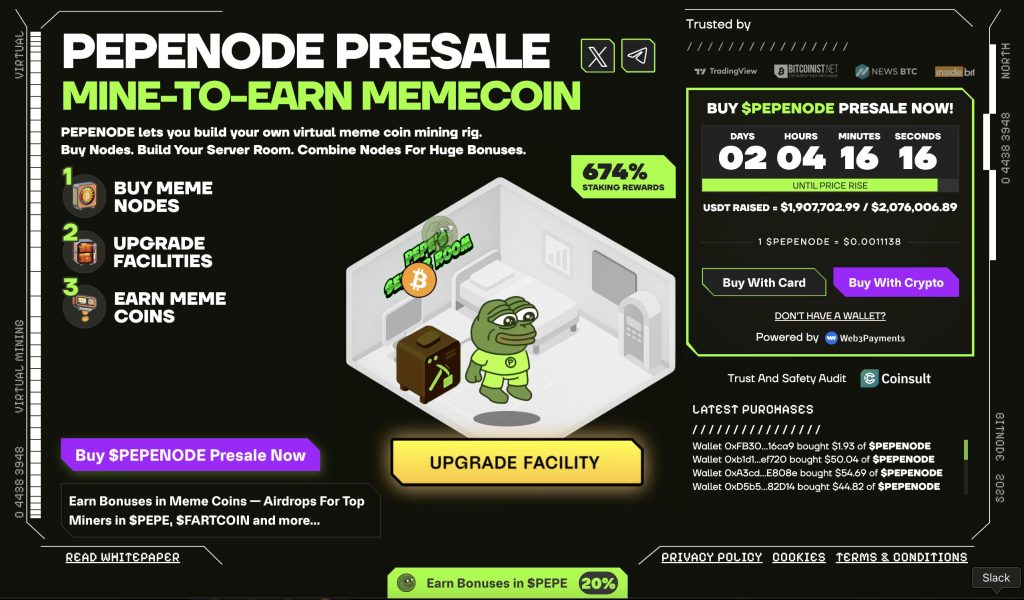
By buying $PEPENODE, players can set up a virtual server and launch as many rigs as they want to earn meme coins. The project introduces a competitive environment and rewards top miners with surprising airdrops of tokens like Bonk ($BONK) and Shiba Inu ($SHIB).
These rigs can be upgraded to increase their output by buying additional $PEPENODE tokens.
As the game’s popularity increases, so will the demand for its utility token, and early buyers will reap the highest returns once that happens.
To buy $PEPENODE and start mining, simply head to the official Pepenode website and connect an Ethereum wallet like Best Wallet.
You can either swap USDT or ETH for this token or use a bank card to invest.
The post Dogecoin Price Prediction: DOGE Down Barely 1% in 24H, Is a Reversal Happening Now? appeared first on Cryptonews.
The XRP market is drawing fresh attention as a concentrated bullish options spike hints at a major altcoin rotation. Traders and institutions are repositioning from Bitcoin and Ethereum, with XRP and Solana emerging as high-conviction plays that could drive outsized short-term gains and renewed XRP momentum.
Derivative platforms such as Deribit, OKX and CME show a notable rise in call option volumes and open interest on XRP and SOL, signaling elevated bullish positioning in crypto options flow. On-chain data from Glassnode and Santiment records earlier BTC and ETH inflows to exchanges, followed by net outflows into altcoin-focused liquidity pools-consistent with a Bitcoin to altcoin shift.
Historical rotations from BTC/ETH into liquid altcoins typically align with sustained call-heavy options flows, tighter implied volatility skews, and subsequent price appreciation. This pattern underpins current XRP news and the growing narrative that XRP momentum could accelerate if capital continues rotating into majors like XRP and SOL.
XRP Price Prediction and Market Context
Recent market flows show a clear shift in attention toward XRP after a surge in call buying and rising open interest on derivatives platforms. Traders cite concentrated options activity in near- and mid-term expiries as a catalyst for short-term volatility and potential squeezes when liquidity thins.
On-chain metrics back the trade narrative. Increased transfers, higher active address counts and swelling wallet activity point to renewed utility and speculative demand that often precede price moves.
At the same time, broader sentiment across the altcoin space has turned notably risk-on – a factor further fueled by the growing buzz around early-stage projects such as PEPENODE Presales https://pepenode.io/. These presales are attracting significant attention from retail and early investors seeking exposure to utility-driven ecosystems before listings. This surge in presale participation reflects a wider shift toward diversification beyond the top assets like XRP and ETH.
While XRP’s near-term outlook hinges on liquidity flows and macro sentiment, parallel momentum from presale-driven projects like PEPENODE https://pepenode.io/ underscores the market’s appetite for innovation and community-led value creation. Both trends – established assets gaining speculative traction and emerging tokens drawing presale demand – illustrate a synchronized phase of renewed optimism within the crypto sector.
Current market dynamics driving XRP interest
Derivatives data reveal outsized call purchases at strike bands above recent levels, pushing open interest XRP higher versus the 30-day average. Market makers watching options flows may adjust hedges in ways that pressure the spot market.
Correlation patterns have changed. The XRP correlation BTC ETH has weakened on intraday and weekly readings, suggesting altcoin independence and the potential for isolated rallies disconnected from Bitcoin and Ether.
Technical outlook for XRP
XRP technical analysis highlights key zones to watch. Immediate support rests near recent swing lows while a resistance band sits at prior multi-month highs and round-number clusters that attract liquidity.
Moving averages matter. Short-term XRP moving averages such as the 10-20 EMA crossing above 50-100 MA would confirm bullish momentum. Traders track XRP RSI shifts from neutral toward overbought during rapid, options-driven moves.
Tactical considerations include exchange orderbook depth at resistance and the presence of institutional block trades that can amplify short-term moves.
Macro factors and regulatory developments
Macro liquidity crypto conditions shape risk appetite. Easier liquidity, lower Treasury yields and risk-on equity sentiment tend to favor capital rotation into higher-beta coins like XRP and Solana.
Regulatory direction remains a major variable. Any statements from the SEC XRP or new U.S. regulatory decisions XRP can rapidly change sentiment, affecting inflows and liquidity for the token.
Traders should monitor macro headlines and legal updates closely as sudden enforcement actions or adverse rulings could undo options-driven rallies and reverse flows into safer assets.
Altcoin Rotation: Why XRP and SOL Could Outperform BTC and ETH
The market shows signs of capital shifting into select altcoins. Recent flow data points to a concentrated options activity that can push spot markets. Traders must watch how these flows intersect with on-chain and macro signals to time exposure.
Interpretation of the bullish options spike
Large surges in call volume relative to puts signal trader conviction for upside. Dealers hedging heavy call flows can create gamma-driven moves that lift the underlying asset. When open interest clusters near key strikes and options expiries crypto approach, market makers may rebalance, producing squeezes toward those strikes.
Comparative strengths of XRP and Solana
XRP fundamentals rest on settlement speed and payments use cases that appeal to banks and remittance firms. Solana throughput gives it an edge for high-frequency dApps and low-fee trading, supporting NFTs and DeFi activity. Comparing XRP vs Solana highlights different utility vectors that can attract distinct capital sources.
Institutional and retail demand shifts
Institutional flows crypto, custody integrations, and new exchange listings XRP can reduce friction for large buyers. Retail sentiment XRP often shows up earlier in search trends and social volumes, creating momentum that complements institutional accumulation. Combined inflows from both channels can amplify options-driven price moves XRP and SOL.
Risks and mitigations for traders and investors
Altcoin volatility can spike around expiries and illiquid strikes, raising options risk and widening spreads. Good crypto risk management means sizing positions to account for that volatility. Use stop-losses, stagger entry across expiries, and hedge large spot positions with protective puts to limit downside.
Monitor open interest distribution and flow reports to anticipate options-driven price moves XRP.
Track developer activity and on-chain metrics as altcoin fundamentals signals for longer-term conviction.
Apply position sizing best practices and avoid over-leveraging during rotations.
Buchenweg 15, Karlsruhe, Germany
For more information about Pepenode (PEPENODE) visit the links below:
Website: https://pepenode.io/
Whitepaper: https://pepenode.io/assets/documents/whitepaper.pdf
Telegram: https://t.me/pepe_node
Twitter/X: https://x.com/pepenode_io
Disclosure: Crypto is a high-risk asset class. This article is provided for informational purposes and does not constitute investment advice.
CryptoTimes24 is a digital media and analytics platform dedicated to providing timely, accurate, and insightful information about the cryptocurrency and blockchain industry. The enterprise focuses on delivering high-quality news coverage, market analysis, project reviews, and educational resources for both investors and enthusiasts. By combining data-driven journalism with expert commentary, CryptoTimes24 aims to become a trusted global source for emerging trends in decentralized finance (DeFi), NFTs, Web3 technologies, and digital asset markets.
This release was published on openPR.
Solana price predictions are flooding crypto forums and investor groups this week, and for good reason. As the DeFi project appeal of Solana (SOL) grows, its institutional adoption has hit record levels, with over $4 billion locked in major treasuries, according to multiple tracking platforms.
Many analysts call it one of the best cryptos to buy now, yet others are warning: the big breakout might not arrive until 2026.
Interestingly, while SOL’s fundamentals are undeniably strong, a new cross-chain DeFi project called Remittix (RTX) https://remittix.io is stealing whispers in the same circles, drawing investors who feel Solana’s upside may already be priced in.
Why SOL Might Wait Until 2026 to Soar
SOL is trading at $186.27, which is a decrease of 1.82% in the day as the stock challenges the major support at 190. Recent price action shows that it is weak in the short term since it was rejected at the $200 zone. Nevertheless, the RSI of 0.37 indicates that there is a possibility of oversold conditions, which means that a turnaround may be in sight once the buying force has returned. A decisive close of above $195 would bring back the bullish spirit and a breakdown of below $185 would be the gateway to further correction to the support of $175.
So, while SOL has a rock-solid foundation, the explosive rally many expect might be a story reserved for 2026.
Takeaway for Investors
Solana’s growth arc is long-form, a slow and confident climb built on deep fundamentals. Analysts project $250-$300 as a feasible price range by late 2026, assuming consistent network expansion and stable macro sentiment. For long-term investors, that’s still a meaningful gain. But for those seeking faster growth or undervalued entries, it’s worth looking at alternative high-growth crypto opportunities in earlier phases, and that’s exactly where Remittix comes in.
Why Remittix (RTX) Could Be the Under-the-Radar Alternative
While Solana’s story is about patience, Remittix is about timing. Built as a cross-chain DeFi project with real-world payment rails, RTX allows users to send crypto directly to bank accounts in 30+ countries, in seconds.
It merges the power of crypto with everyday finance, creating what many in the market are calling a “next 100x crypto” in 2025.
You can currently buy Remittix https://remittix.io for $0.1166, but that price will soon be increasing, with over 40,000 investors acquiring RTX in recent months. Unlike many speculative tokens, RTX is targeting practical adoption, with a mobile-first wallet launch coming in Q3 and partnerships with major payment processors underway.
Why Remittix Is Gaining Traction
● Global Reach: fiat payouts to 30+ countries
● Real-World Utility: instant crypto-to-bank rails for businesses and freelancers
● Security First: Ranked #1 by CertiK for pre-launch tokens, a huge trust signal
● Wallet Launch Imminent: Q3 mobile wallet with live FX conversion and fiat on-ramp
Compared to large-cap cryptos like SOL, Remittix feels early, an undervalued crypto project that could see exponential traction once mainstream adoption kicks in.
The Remittix Referral & Giveaway Wave
Remittix has recently introduced a new system of allows its rapidly expanding community to earn daily rewards. All you need to do is log in to Remittix, take your personal link, and begin earning by inviting your network. Each referral strengthens the ecosystem and rewards you directly with 15% of all purchases in USDT.
With its CertiK-verified team, global exposure, and top ranking for blockchain security, Remittix is fast becoming the best DeFi altcoin to watch, and you do not want to miss out.
Discover the future of PayFi with Remittix by checking out their project here:
Website: https://remittix.io/
Socials: https://linktr.ee/remittix
$250,000 Giveaway: https://gleam.io/competitions/nz84L-250000-remittix-giveaway
Disclaimer: This article is for informational purposes only and does not constitute financial advice. Cryptocurrency investments carry risk, including total loss of capital. Readers should conduct independent research and consult licensed advisors before making any financial decisions.
Crypto Press Release Distribution by https://btcpresswire.com
This release was published on openPR.
Cardano price today trades around $0.63, holding slightly above a key ascending trendline that has supported its structure since late 2024. Despite sustained selling pressure and weak inflows, the coin remains within a broader symmetrical triangle that continues to compress between resistance near $0.77 and long-term support at $0.60.
The daily chart shows Cardano price action respecting the lower boundary of its multi-month ascending support, even after repeated rejections from the upper trendline drawn from April’s highs. Price has so far held above the 0.236 Fibonacci level at $0.605, which aligns with the base of this structure.
Clustered EMA resistance levels—the 20-day at $0.69, the 50-day at $0.76, and the 100-day at $0.77—define the overhead barrier zone. A clean break above this band could reestablish upside momentum toward the 0.382 Fibonacci retracement at $0.82 and potentially the 0.5 level at $0.92, both of which capped prior rallies.
At the same time, Parabolic SAR dots remain above the candles, confirming that near-term control rests with sellers. For buyers to regain momentum, ADA must close decisively above $0.70 in the coming sessions.

Data from Coinglass shows consistent negative spot netflows through October, including a $1.34 million outflow on October 23 as ADA price hovered near $0.63. These outflows indicate coins moving back to exchanges, often a sign of cautious positioning or profit-taking.
Despite the weak inflow profile, the absence of large liquidation spikes suggests no broad capitulation. This indicates that long-term holders are still maintaining positions, while shorter-term traders remain defensive.
In a notable development, the Cardano Foundation confirmed plans to apply for the .ada and .cardano generic top-level domains (gTLDs). The move comes ahead of the Internet Corporation for Assigned Names and Numbers (ICANN) application window opening in early 2026, marking the first such opportunity in over a decade.
The initiative, fully funded by the Foundation, aims to strengthen Cardano’s digital identity and expand its ecosystem across Web2 and Web3. If approved, users could register domains such as wallet.ada or dapp.cardano, potentially increasing accessibility and branding appeal.
For now, Cardano price prediction remains balanced between the resilience of its long-term support and the weight of persistent resistance overhead. If ADA holds the $0.60 zone and reclaims $0.70, buyers could target the $0.82 to $0.92 range in the near term.
Failure to hold the ascending trendline could open the door toward $0.55 or even a retest of $0.51, where the next Fibonacci base aligns with prior consolidation.
With on-chain flows still showing outflows but fundamentals turning constructive, the next few sessions will determine whether ADA’s current pause becomes a setup for recovery or a deeper retest before a late-year rebound.
| Metric | Level / Reading | Bias |
| Current Price | $0.630 | Neutral |
| Immediate Support | $0.605 / $0.55 | Bullish defense zone |
| Immediate Resistance | $0.70 / $0.76 | Bearish cluster |
| RSI (Daily) | 41 | Neutral-bearish |
| MACD | Below signal line | Bearish momentum |
| Fibonacci Levels | 0.236 – $0.605, 0.382 – $0.82, 0.5 – $0.92 | Key reaction zones |
| EMA Cluster (20/50/100) | $0.69 / $0.76 / $0.77 | Overhead resistance |
| Parabolic SAR | $0.75 | Bearish signal |
| On-chain Netflow (Oct 23) | -$1.34M | Outflows persist |
Disclaimer: The information presented in this article is for informational and educational purposes only. The article does not constitute financial advice or advice of any kind. Coin Edition is not responsible for any losses incurred as a result of the utilization of content, products, or services mentioned. Readers are advised to exercise caution before taking any action related to the company.


