The main category of Crypto News.
You can use the search box below to find what you need.
[wd_asp id=1]
The main category of Crypto News.
You can use the search box below to find what you need.
[wd_asp id=1]
Solana price gains renewed momentum after Hong Kong’s ETF approval, with bulls defending key support levels and eyeing a breakout towards the $200 zone.
Solana price latest rally is drawing fresh excitement across the crypto market. Following Hong Kong’s landmark approval of the first Solana ETF, investor confidence has surged as traders eye the network’s expanding global footprint.
Hong Kong’s recent approval of the first Solana ETF has added a strong bullish undertone to the market. The announcement shared by Ash Crypto has quickly ignited interest across institutional and retail circles, marking Solana’s first major regulatory milestone in Asia.
This approval underscores Solana’s transition from a high-growth network to a globally recognized asset class. As ETFs typically enhance accessibility and legitimacy, many believe this move could open the door for further adoption and regional liquidity inflows throughout Q4.
Market data shows Solana leading all crypto assets in ETF filings since 2024, totaling 23 applications, as highlighted by CryptoCurb. This surpasses even Bitcoin and Ethereum, signaling an unusual level of institutional interest for a non-BTC chain.
Solana leads the market with 23 ETF filings, surpassing Bitcoin and Ethereum in institutional interest. Source: CryptoCurb via X
More ETF filings often precede structural market maturity, suggesting Solana may be gearing up for broader global exposure.
Technical setups continue to show strength near $182, where buyers have repeatedly stepped in to defend structure. James notes that price is respecting a long-term descending trendline and appears to be compressing tightly towards an imminent breakout zone.

Solana holds firm near $182 support as bulls eye a potential breakout towards the $200–$210 resistance zone. Source: James via X
A breakout above the trendline could trigger a sharp move towards $200 to $210, with short-term resistance around $195 acting as the initial test. Maintaining higher lows above $182 to $184 will be crucial to confirm continuation and invalidate any near-term bearish pressure.
Chart formations shared by Kamran Asghar highlight Solana’s triangle consolidation pattern, reflecting tightening volatility before potential liftoff. The Solana price structure shows clear higher lows forming against flat resistance, a textbook setup for a bullish breakout.
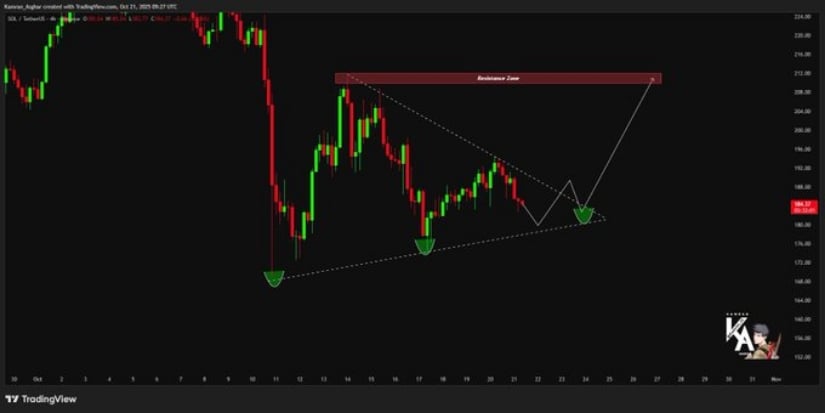
Solana’s triangle pattern signals tightening volatility, with a breakout above resistance potentially driving price toward $210–$220. Source: Kamran Asghar via X
If the triangle resolves upward, measured move projections suggest a possible run towards $210 to $220, with the lower boundary support resting around $178 to $180. Failure to hold that zone, however, could briefly retest prior liquidity pools near $170 before any recovery attempt.
Solana’s on-chain growth remains a core pillar behind its ongoing resilience. Data shared by Capital Markets shows the network leading the industry with $2.1B in annual revenue, growing an impressive 212% year-over-year, far surpassing competing blockchains.
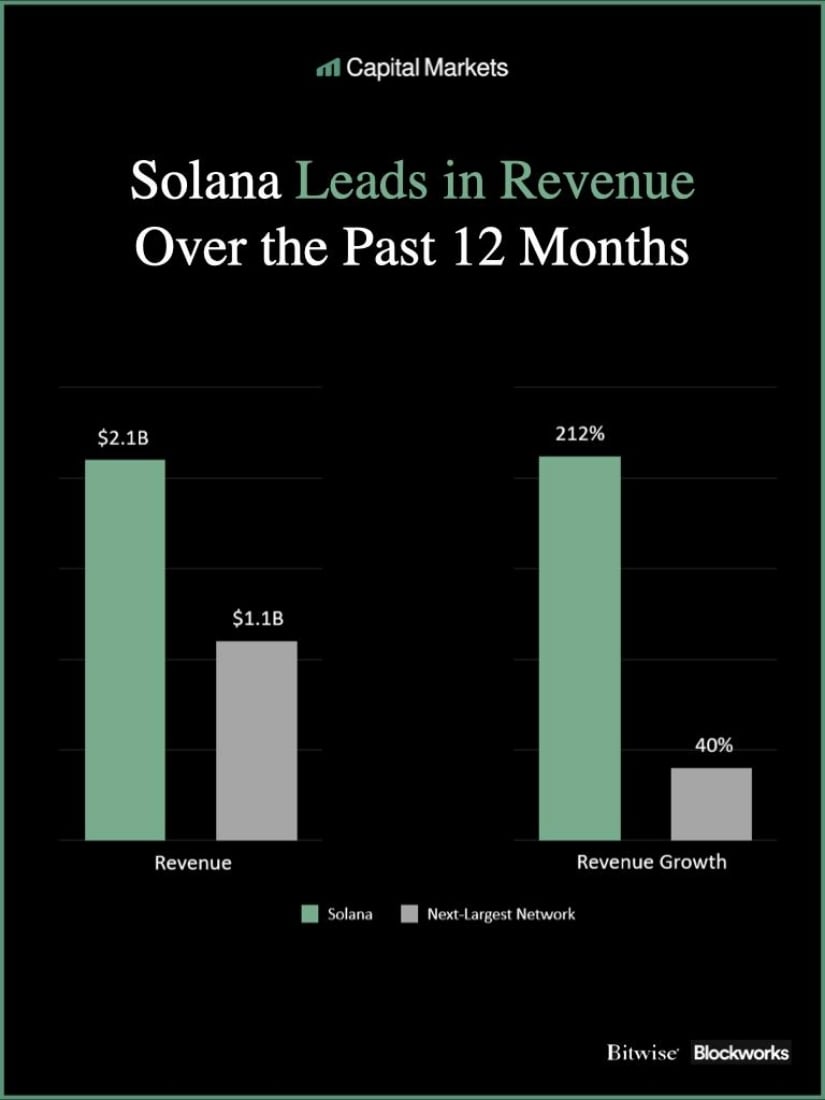
Solana leads all major blockchains with $2.1B in annual revenue, marking a 212% year-over-year growth. Source: Capital Markets via X
These metrics reinforce Solana’s price position as not just a high-throughput chain, but a profitable ecosystem with real economic activity. Sustained revenue and network growth provide a strong backdrop for long-term holders, aligning well with the ongoing ETF momentum and bullish technical structures.
From ETF approvals to leading on-chain performance, Solana price continues to stand out as one of the most fundamentally and structurally strong assets in the market. The combination of regulatory recognition, investor demand, and technical strength provides a firm setup heading into year-end.
If $182 support holds and the breakout above $195 to $200 confirms, SOL Solana price could easily revisit the $220 to $240 range in the coming weeks. With institutional participation expanding and ecosystem metrics at record highs, the Solana price prediction is aiming for a bullish rally.
Joerg Hiller
Oct 17, 2025 05:27
MATIC price prediction shows mixed signals with analysts targeting $0.21-$0.72 range. Current technical indicators suggest caution before next bullish move toward $0.48.
With Polygon trading at $0.38 amid conflicting technical signals, our MATIC price prediction reveals a complex landscape where short-term bearish momentum could give way to medium-term recovery. Recent analyst forecasts paint a picture of potential volatility before the next significant move higher.
• MATIC short-term target (1 week): $0.35-$0.40 range (-8% to +5%) • Polygon medium-term forecast (1 month): $0.42-$0.52 range (+11% to +37%) • Key level to break for bullish continuation: $0.43 (SMA 20 resistance) • Critical support if bearish: $0.33 (strong support level)
The latest MATIC price prediction data reveals significant divergence among analysts. CoinCodex presents the most conservative near-term outlook with a $0.214786 target by October 18, 2025, representing a concerning -43% decline from current levels. This bearish short-term view is supported by technical indicators showing RSI at 40.90 and a Fear & Greed Index of 38.
Conversely, PricePredictions.com offers a more optimistic Polygon forecast with an average October price of $0.715326, suggesting an 88% upside potential. CoinArbitrageBot’s AI-driven analysis targets $0.48489 by year-end, representing a 28% gain that appears more realistic given current market conditions.
The consensus emerges around medium-term bullish potential despite short-term headwinds, with price targets clustering between $0.48-$0.72 for the remainder of 2025.
Current Polygon technical analysis reveals a cryptocurrency caught between competing forces. The RSI at 38.00 sits in neutral territory but leans bearish, while the MACD histogram at -0.0045 confirms weakening momentum. However, this technical weakness may be setting up an oversold bounce opportunity.
The Bollinger Bands analysis shows MATIC trading at 0.2879 position, closer to the lower band at $0.31, suggesting the token is oversold relative to its 20-day moving average. This positioning often precedes reversals, supporting our medium-term bullish MATIC price target.
Volume analysis from Binance shows $1.07 million in 24-hour trading, which remains relatively modest and suggests accumulation rather than distribution. The 14-day ATR of $0.03 indicates manageable volatility for position sizing.
The primary MATIC price target for bulls centers on reclaiming the $0.43 SMA 20 level, which would trigger a move toward $0.48-$0.52. Breaking above the $0.56 upper Bollinger Band would confirm the bullish scenario and target the $0.58 strong resistance level.
For this bullish Polygon forecast to materialize, MATIC needs to hold above the $0.35 immediate support while RSI recovers above 50. The convergence of the EMA 12 and EMA 26 near $0.39-$0.42 creates a technical setup for a momentum shift.
The bearish scenario activates if MATIC breaks below the $0.33 strong support level, which would expose the 52-week low at $0.37. A deeper correction could target the $0.31 lower Bollinger Band and potentially the analysts’ $0.21 downside target.
Key bearish triggers include RSI falling below 30, MACD histogram deepening into negative territory, and trading volume increasing on downside moves.
Current technical levels suggest a measured approach rather than aggressive accumulation. The optimal buy or sell MATIC strategy involves waiting for either a bounce from $0.35 support or a breakout above $0.43 resistance.
Conservative entry points include: – Primary entry: $0.35-$0.36 (support zone test) – Aggressive entry: $0.40-$0.41 (if momentum shifts positive) – Stop-loss: $0.32 (below strong support) – Take-profit: $0.48 (medium-term target)
Position sizing should account for the 14-day ATR of $0.03, allowing for normal volatility while maintaining risk management discipline.
Our comprehensive MATIC price prediction assigns a MEDIUM confidence level to a $0.48 target by December 2025, representing a 26% upside from current levels. This forecast aligns with the AI-driven analysis while acknowledging short-term technical weakness.
Key indicators to monitor include RSI recovery above 45, MACD histogram turning positive, and sustained trading above the $0.35 support level. The Polygon forecast timeline suggests 6-8 weeks for this prediction to materialize, contingent on broader cryptocurrency market stability.
The critical decision point arrives at the $0.33 support level – a break below invalidates the bullish scenario and opens the door to the $0.21 downside target. Conversely, reclaiming $0.43 would confirm the path toward our $0.48 MATIC price target and potentially the more optimistic $0.72 level suggested by technical analysts.
Image source: Shutterstock
A major bullish pattern is quietly emerging on the XRP chart, and traders are closely watching the $2.45 neckline.
If confirmed, this setup could trigger a strong rally toward $3.10, potentially setting the stage for one of XRP’s most notable breakout attempts in recent months.
Behind the scenes, whale accumulation, growing trading volumes, and optimistic market sentiment are adding weight to this technical signal. With price consolidating at a critical range, the next move could shape the token’s outlook heading into the last quarter of 2025.
The latest analysis on TradingView shows a clear Inverse Head and Shoulders pattern developing since early October 2025. The structure has its neckline positioned around $2.45, with an upside projection toward $3.10 once a breakout occurs. The base of the formation is anchored near recent lows of $2.20, suggesting a healthy accumulation phase underneath the surface.
XRP is forming a classic inverse head and shoulders pattern, aiming for a breakout toward the $3.10 resistance level. Source: Kamran Asghar via X
Market participants have historically viewed this pattern as a bullish reversal signal. A decisive move above the neckline often sparks renewed buying interest, which can quickly accelerate price momentum in trending markets.
Despite mild intraday weakness, XRP price today remains resilient. The token recently recorded a 24-hour trading volume exceeding $5.1 billion, reflecting heightened market activity and investor engagement. XRP has swung between $2.21 and $2.64 over the past week, maintaining its position among the top-performing cryptocurrencies by market capitalization. It currently ranks #5 with a market cap of approximately $145.25 billion.

XRP was trading at around $2.40, down 0.65% in the last 24 hours at press time. Source: XRP price via Brave New Coin
The current XRP price sits just above its 50-day exponential moving average (EMA) of $2.40, while the 200-day EMA remains at $2.54. This narrow range has created a standoff between short-term traders taking profits and long-term holders positioning for a larger upside.
On-chain data from Santiment provides further support for the bullish thesis. In the 24 hours ending October 22, whale wallets accumulated more than 30 million XRP, valued at around $74 million. This spike in large-holder transactions (100,000 to 10 million coins) coincides with price stabilization near $2.40, often a sign that institutional players are quietly building positions.
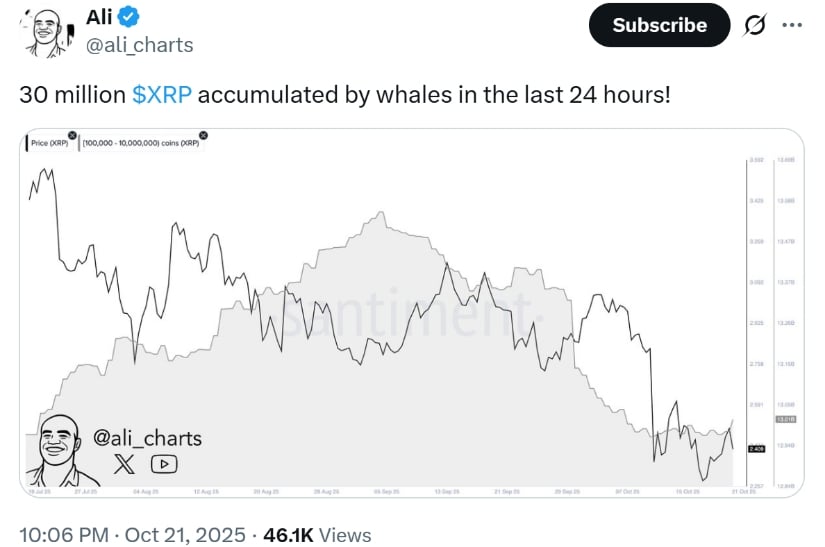
Whales have accumulated 30 million XRP in the past 24 hours, signaling renewed large-scale investor interest. Source: Ali Martinez via X
Market observers are speculating that this accumulation could be linked to anticipated regulatory catalysts, including potential developments around the U.S. Securities and Exchange Commission and discussions tied to a possible Grayscale XRP ETF approval window between October 18 and November 14.
The XRP/USD pair is trading in a tight range, with the Relative Strength Index (RSI) sitting at a neutral 46. This neither strongly favors bulls nor bears but points to a potential volatility spike ahead. Candlestick patterns such as Doji and spinning tops are emerging on the chart—a classic sign of market indecision before a major directional move.
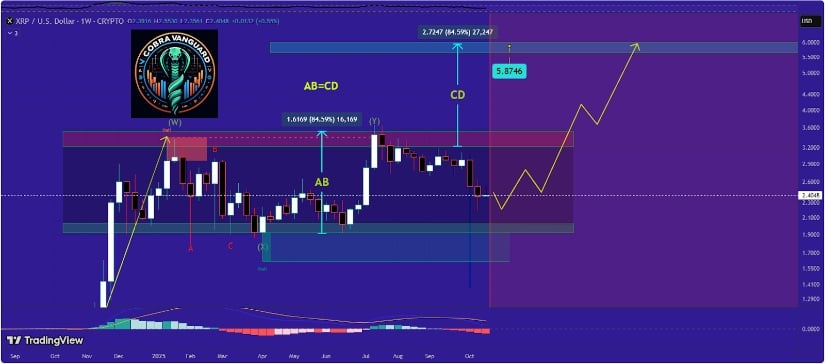
XRP price remains range-bound, but a breakout from the upper channel could set the stage for a potential $5 target. CobraVanguard on TradingView
If the XRP price closes decisively above $2.48, analysts believe this could spark renewed momentum, with immediate targets near $2.64 and $2.70. On the flip side, a close below $2.40 would weaken the bullish outlook and expose the $2.21 support zone as the next key level to watch.
The broader XRP community remains optimistic, with several traders pointing to potential price targets well above $3 if the current pattern confirms. Many cite multi-year technical structures, regulatory progress around the XRP lawsuit, and growing institutional interest as reasons for the bullish sentiment. Still, volatility across the crypto market and retail selling pressure could shape short-term fluctuations.
For traders, this is a classic “wait-and-see” scenario. A breakout above the $2.45 neckline could open the door to a swift rally toward the XRP price target of $3.10. Conversely, a failure to defend support may trigger a corrective move back to lower levels.
The market is at a decision point, and both technical and on-chain data suggest that the next major move could come soon. Whether it’s ETF speculation, whale accumulation, or pattern confirmation, XRP seems poised for a defining moment in its price trajectory.
Key points:
Bitcoin bulls are attempting to sustain the price above $107,000, but the bears have continued to exert selling pressure.
The recovery in most major altcoins has fizzled out, indicating that the bears continue to sell on minor rallies.
Buyers have managed to keep Bitcoin BTCUSD above the vital $107,000 support level, but the lack of a solid rebound suggests that the bears have maintained their pressure. The short-term uncertainty has divided the analysts on BTC’s next directional move.
Standard Chartered’s global head of digital assets research, Geoff Kendrick, told Cointelegraph that BTC remains on track to hit $200,000 by the end of 2025. Kendrick believes the investors will consider the recent sell-off as a buying opportunity, propelling BTC higher.
On the other end of the spectrum is veteran trader Peter Brandt, who sees similarities between BTC’s chart and the soybean market of the 1970s, which nosedived 50% after global supply exceeded demand. Brandt told Cointelegraph that BTC is forming a broadening top chart pattern, “famous for tops,” which could pull the price down to about $60,000.
What are the critical support levels to watch out for in BTC and the major altcoins? Let’s analyze the charts of the top 10 cryptocurrencies to find out.
Bitcoin price prediction
BTC rallied sharply on Tuesday, but the bears cut short the recovery attempt at the 50-day simple moving average ($114,137).
Sellers will try to strengthen their position by pulling the Bitcoin price below the $107,000 support. If they succeed, the risk of a drop in the psychological support of $100,000 increases. Buyers are expected to defend the $100,000 level with all their might because the failure to do so could start a new downtrend.
The first sign of strength will be a break and close above the $116,000 level. That suggests the ![]()
![]() BTCUSDT pair could remain within the $107,000 to $126,199 range for some more time.
BTCUSDT pair could remain within the $107,000 to $126,199 range for some more time.
Ether price prediction
Ether ![]() ETHUSD turned down from the 20-day exponential moving average ($4,062) on Tuesday, signaling the bears are selling on minor rallies.
ETHUSD turned down from the 20-day exponential moving average ($4,062) on Tuesday, signaling the bears are selling on minor rallies.
The bears will try to sink the Ether price below the support line of the descending channel pattern. If they manage to do that, the selling could pick up, and the ![]()
![]() ETHUSDT pair risks dropping to $3,350.
ETHUSDT pair risks dropping to $3,350.
Buyers will have to drive the price above the moving averages to suggest that the pair could remain inside the channel for a while longer. The bulls will gain the upper hand on a close above the resistance line.
BNB price prediction
BNB ![]() BNBUSD has been trading between the moving averages since Friday, indicating a tough battle between the bulls and the bears.
BNBUSD has been trading between the moving averages since Friday, indicating a tough battle between the bulls and the bears.
The downsloping 20-day EMA ($1,122) and the RSI in the negative territory indicate a slight edge to the bears. A close below the 50-day SMA ($1,041) signals the start of a new downtrend to $932.
Contrarily, a close above the 20-day EMA indicates that the bulls have overpowered the bears. That opens the doors for a relief rally to the 50% Fibonacci retracement level of $1,198.
XRP price prediction
XRP’s ![]() XRPUSD bounce off the $2.30 support fizzled out at the 20-day EMA ($2.55) on Tuesday, indicating a negative sentiment.
XRPUSD bounce off the $2.30 support fizzled out at the 20-day EMA ($2.55) on Tuesday, indicating a negative sentiment.
The bears will try to build upon their advantage by pulling the XRP price below the $2.19 support level. If they can pull it off, the ![]()
![]() XRPUSDT pair may tumble to $2.06 and subsequently to $1.90.
XRPUSDT pair may tumble to $2.06 and subsequently to $1.90.
Buyers will have to swiftly drive the price above the 20-day EMA to signal a comeback. The pair may then climb to the 50-day SMA ($2.79) and later to the downtrend line. A close above the downtrend line suggests the end of the corrective phase. The pair may then ascend toward $3.38.
Solana price prediction
Solana ![]() SOLUSD turned down from the 20-day EMA ($198) on Tuesday, indicating that the bears are attempting to retain control.
SOLUSD turned down from the 20-day EMA ($198) on Tuesday, indicating that the bears are attempting to retain control.
The ![]()
![]() SOLUSDT pair could slide to the support line of the descending channel pattern, where the buyers are expected to step in. The bulls will have to drive the Solana price above the 20-day EMA to suggest that the pair may remain inside the channel for a while longer. A new up move could begin on a close above the resistance line.
SOLUSDT pair could slide to the support line of the descending channel pattern, where the buyers are expected to step in. The bulls will have to drive the Solana price above the 20-day EMA to suggest that the pair may remain inside the channel for a while longer. A new up move could begin on a close above the resistance line.
Sellers are likely to have other plans. They will try to sink the price below the support line. If they can pull it off, the pair could plunge to $155 and then to $145.
Dogecoin price prediction
Dogecoin ![]() DOGEUSD failed to rise above the 20-day EMA ($0.21), indicating that the bears are selling on minor rallies.
DOGEUSD failed to rise above the 20-day EMA ($0.21), indicating that the bears are selling on minor rallies.
The Dogecoin price could dip to $0.18, which is a crucial support to watch out for. If bears pull the ![]()
![]() DOGEUSDT pair below $0.18, the next stop is likely to be $0.16 and eventually $0.14.
DOGEUSDT pair below $0.18, the next stop is likely to be $0.16 and eventually $0.14.
Contrary to this assumption, if the price turns up sharply and breaks above the 20-day EMA, it suggests that the selling pressure is reducing. The pair could climb to the 50-day SMA ($0.23) and later to the stiff overhead resistance at $0.29.
Cardano price prediction
Cardano’s (ADA) recovery attempt could not even reach the 20-day EMA ($0.70), indicating a lack of demand at higher levels.
The bears will attempt to increase their advantage by pulling the Cardano price below the $0.59 support. If they succeed, the ![]()
![]() ADAUSDT pair could plummet to the critical support at $0.50. Buyers are expected to defend the $0.50 level with all their might because a close below it clears the path for a fall to $0.40.
ADAUSDT pair could plummet to the critical support at $0.50. Buyers are expected to defend the $0.50 level with all their might because a close below it clears the path for a fall to $0.40.
This negative view will be invalidated in the near term if the price turns up and rises above the breakdown level of $0.75. The pair may then climb to the downtrend line.
Hyperliquid price prediction
Hyperliquid (HYPE) turned down from the neckline of the head-and-shoulders pattern, indicating that the bears remain in control.
The downsloping 20-day EMA ($40.09) and the RSI in the negative territory increase the likelihood of further downside. There is support at $33.28, but if the level cracks, the HYPE/USDT pair could descend to $30.50 and then to $28.
The bulls will have to drive and maintain the Hyperliquid price above the neckline to signal that the selling pressure is reducing. The pair may rally to the 50-day SMA ($46.42) and then to $51.
Chainlink price prediction
Chainlink (LINK) dipped near the support line of the descending channel pattern after buyers failed to push the price above the 20-day EMA ($19.02).
Sellers will attempt to sink the price below the support line and retest the $15.43 level. Repeated retest of a support level tends to weaken it. If the $15.43 level gives way, the Chainlink price may tumble to $12.73.
The bulls will have to push and sustain the price above the 20-day EMA to indicate strength. The ![]()
![]() LINKUSDT pair could then rally to the resistance line, where the bears are expected to sell aggressively.
LINKUSDT pair could then rally to the resistance line, where the bears are expected to sell aggressively.
Stellar price prediction
The bears stalled Stellar’s (XLM) relief rally near the 20-day EMA ($0.34) on Tuesday, indicating a negative sentiment.
The ![]()
![]() XLMUSDT pair risks falling to $0.29, which is a critical support to watch out for. If the $0.29 support breaks down, the selling could accelerate, and the Stellar price may decline to $0.25.
XLMUSDT pair risks falling to $0.29, which is a critical support to watch out for. If the $0.29 support breaks down, the selling could accelerate, and the Stellar price may decline to $0.25.
Buyers will have to push and maintain the price above the breakdown level of $0.34 to signal strength. The pair could then rise to the downtrend line, where the bears are expected to pose a strong challenge. A close above the downtrend line signals a potential trend change.
This article does not contain investment advice or recommendations. Every investment and trading move involves risk, and readers should conduct their own research when making a decision.
Disclaimer: This is a Press Release provided by a third party who is responsible for the content. Please conduct your own research before taking any action based on the content.
The crypto market’s crash on Friday, Oct. 10, and inability to show sustained recovery mark a turning point for the industry. Long-standing blue-chip assets like Ripple (XRP) are now facing tempered expectations. Analysts who once predicted that XRP would trade above $4 before the end of the year are now trimming their outlook to the low-$3 range.
In contrast, analysts are prioritizing their time and effort in identifying new crypto startups that offer the potential for outsized returns. One project attracting attention is Digitap ($TAP), the creator of the world’s first “omni-bank,” which is part crypto broker and part fiat bank.
Digitap created what some analysts describe as a financial super-app or global money app. Users can hold multiple currencies (both crypto and fiat) in one account. Inside the app, users can send, receive, save, invest, and spend their money through a Visa-integrated card.
The app is already live on both the Apple App Store and Google Play Store. The app is available globally, and an optional no-KYC sign-up process allows users to access basic products without needing to provide identification.
Digitap’s target market extends beyond crypto-native users and non-crypto users who want to part ways with legacy banks in favor of new startups. There are an estimated 1.4 billion people worldwide who are unbanked or underbanked, meaning they don’t have a bank account or access to banking services. Digitap offers a global money app that doesn’t require an ID to sign up.
There are also an estimated 800 million people worldwide who rely on remittance transfers from friends and family. Legacy money remitters charge an average of 6.2%, but Digitap users can transact with each other at a rate as low as sub-1%.
Digitap’s presale is ongoing, with a current token price of $0.0194, which will rise to $0.0268 in the next stage. Over 60 million $TAP tokens have been sold, reflecting a growing consensus among investors that it is one of the best new cryptos to invest in 2025.
 Builds for 100x Growth") Given a fixed supply of 2 billion tokens, Digitap’s valuation stands at less than $40 million. Some forecasts suggest a 100x price increase from current presale levels, bringing its price to roughly $2. This is not only a realistic outlook but also quite tame by crypto standards.
Given a fixed supply of 2 billion tokens, Digitap’s valuation stands at less than $40 million. Some forecasts suggest a 100x price increase from current presale levels, bringing its price to roughly $2. This is not only a realistic outlook but also quite tame by crypto standards.
Binance (BNB) is a fair comparison story. While not a direct competitor with Digitap, Binance does overlap and offers some similar crypto services. Since Binance’s very early days, the token has gained a mind-boggling 950,000%.
Aave (AAVE), which is not a direct competitor but is a crypto platform engaged in financial services, has seen its token skyrocket from around $0.25 in 2017 to an all-time high of around $660 in 2021.
These examples show that the market would gladly re-rate undervalued banking and finance tokens 100x, if not more, if they can demonstrate real-life utility.
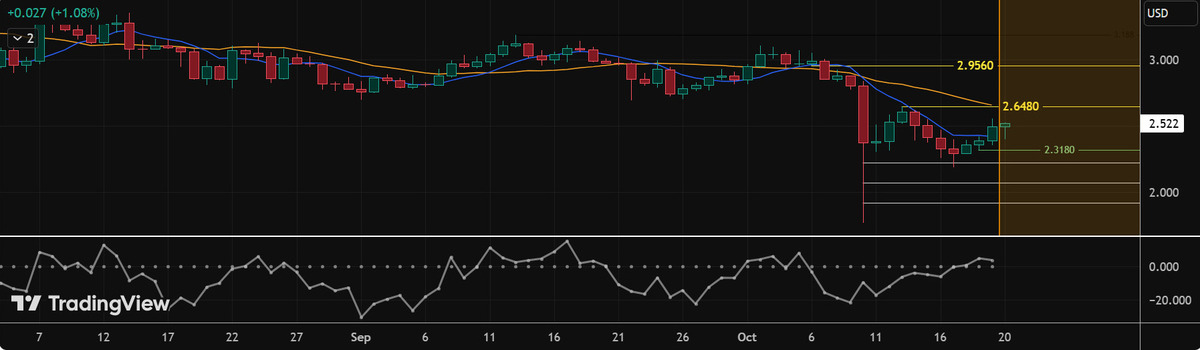
After a strong start to 2025, XRP’s rally has lost momentum. Currently trading below the key $2.50 level, the stock is causing concern among chart watchers and technical analysts. The current price is much closer to the $2.30 support level than the $2.90 resistance level.
Recent catalysts to jolt the token back to life have not played out as many had hoped. Most recently, the $1 billion acquisition of GTreasury, a fintech treasury management software provider, was mostly ignored by investors.
Also, a Ripple-backed company called Evernorth is raising more than $1 billion to buy XRP tokens. However, this figure is relatively small, as it will not offset the $5.4 billion worth of XRP tokens whales have been selling in recent weeks, although the pace of selling has eased in recent days.
As investors shunned recent developments, XRP’s price prediction through the end of the year has become much less aggressive. A $3.20 price target is a reasonable outlook, but analysts note it requires XRP to show investors that recent moves are economically beneficial and accretive to its long-term goals.
Analysts are openly calling $TAP one of the best cryptos to invest in now, citing its working app, Visa integration, and its low market cap. If Digitap’s omni-bank vision gains traction and shows consistent monthly active user growth, a 100x gain is on the low end of its potential.
Digitap is making all the right moves today to convince investors it is well-positioned for growth. Meanwhile, larger alts like XRP are slowing down and scrambling to invest heavily in growth through acquisitions.
Presale https://presale.digitap.app
Website: https://digitap.app
Social: https://linktr.ee/digitap.app
Disclaimer: This media platform provides the content of this article on an “as-is” basis, without any warranties or representations of any kind, express or implied. We assume no responsibility for any inaccuracies, errors, or omissions. We do not assume any responsibility or liability for the accuracy, content, images, videos, licenses, completeness, legality, or reliability of the information presented herein. Any concerns, complaints, or copyright issues related to this article should be directed to the content provider mentioned above.
/div>
Solana’s price continues to trade under pressure, consolidating near the $184 mark as investors weigh renewed market volatility and an upcoming exchange-traded fund (ETF) listing in Hong Kong.
The short-term structure suggests ongoing consolidation after October’s correction, but technical data indicates potential accumulation beneath key resistance levels. While momentum remains cautious, institutional activity around Solana’s derivatives and spot markets continues to expand, hinting at possible shifts in investor sentiment.
Solana trades below the 20-day exponential moving average (EMA) at $188 and the 50-day EMA at $191. This shows the near-term trend is slightly bearish, though the broader structure still supports recovery.
The asset failed to reclaim the $195–$197 zone, which aligns with the 38.2% Fibonacci retracement level from the decline between $237.7 and $169.8. The rejection at this level reinforced short-term selling pressure.
Immediate support lies between $184 and $185, a zone that must hold to preserve Solana’s bullish mid-term outlook. Losing this level could expose the $175 and $170 zones, which acted as strong bases during October’s correction.
On the upside, the $195 level remains the first key resistance, followed by $203 and $211. A sustained close above these zones could signal a fresh breakout toward $223 and $237.
Consequently, Solana’s futures open interest has surged to $8.55 billion as of October 22, 2025. This marks one of the highest levels of speculative positioning this year. The increase highlights strong participation among institutional traders who appear to be positioning ahead of a potential market move.

While price consolidation continues, the consistent rise in open interest reflects capital rotation rather than widespread liquidation. Maintaining these levels could set the stage for volatility expansion once directional conviction returns.
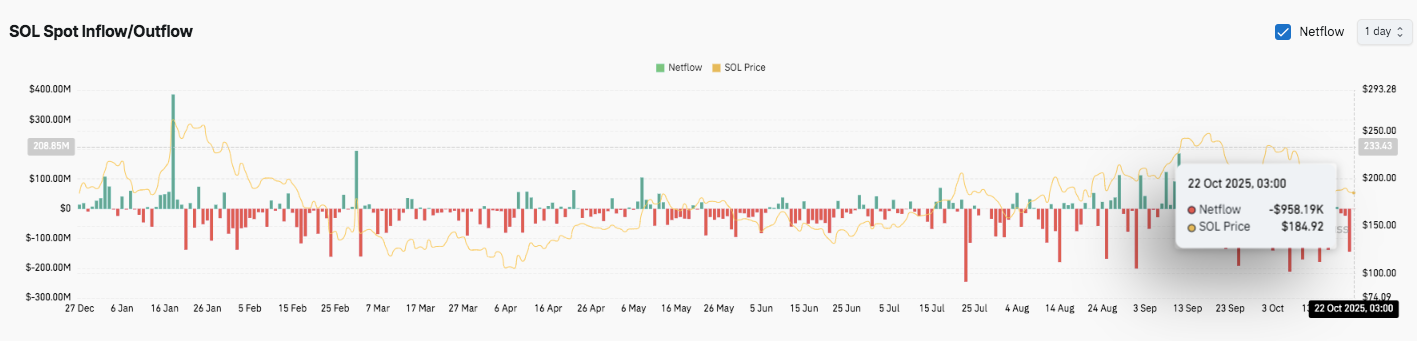
Meanwhile, Solana recorded a net outflow of nearly $958,000 on October 22, signaling mild profit-taking by traders. The move follows several weeks of alternating inflows and outflows across spot exchanges. However, long-term accumulation trends remain intact, particularly when considering earlier inflow peaks in January and July.
Moreover, Hong Kong’s securities regulator recently approved the first Solana spot ETF, managed by China Asset Management (Hong Kong). Trading begins on October 27, positioning Solana alongside Bitcoin and Ethereum as one of the few digital assets with regulated ETF exposure in Asia a development that may strengthen investor confidence and long-term market visibility.
Key levels remain clearly defined as Solana enters late October trading with muted momentum but firm structural support. Upside targets include $195.8 and $203.8 as immediate resistance levels, both aligned with the 0.382 and 0.5 Fibonacci retracements. A breakout above $203.8 could extend gains toward $211.8 and $223, marking the next key supply zones.
On the downside, Solana holds initial support at $185, coinciding with the 0.236 Fibonacci zone, followed by $175 and $170 areas that previously cushioned pullbacks during October’s correction. Losing these supports may invite deeper retracement toward $160.
The current structure shows Solana compressing between the $184 and $195 range, forming a short-term consolidation wedge. This setup signals potential volatility expansion as traders await confirmation from either side.
Solana’s near-term direction depends on whether buyers can defend the $184–$185 support cluster and regain momentum above $195. Sustained closes beyond $200 could trigger renewed bullish sentiment, targeting the $211–$223 range. However, failure to hold the $184 floor risks another test of $175, possibly extending toward $170.
Market data suggests derivative activity remains elevated, reflecting investor anticipation of a breakout. With Hong Kong’s approval of a Solana spot ETF adding institutional tailwinds, price behavior around the $184–$200 band may determine whether the next move favors recovery or deeper correction.
Disclaimer: The information presented in this article is for informational and educational purposes only. The article does not constitute financial advice or advice of any kind. Coin Edition is not responsible for any losses incurred as a result of the utilization of content, products, or services mentioned. Readers are advised to exercise caution before taking any action related to the company.
Crypto markets are buzzing again after Elon Musk dropped another cryptic Shiba meme on X. As usual, this pushed Dogecoin back in the spotlight. The meme coin surged in trading volume overnight, making it one of the top-trending cryptocurrencies this week.
Analysts now debate whether this renewed hype could lead to a sustainable move or just another short-lived spike. Meanwhile, investors seeking stronger fundamentals are turning their attention to Remittix (RTX), the PayFi altcoin touted as the next big gainer.

DOGE is trading around $0.19 as of today. It briefly touched $0.20 in the wake of Musk’s post. The post read “Floki is back on the job as X CEO.” The billionaire’s Shiba-related meme instantly sent trading volume soaring more than 60%, with social dominance spiking across X and Reddit.
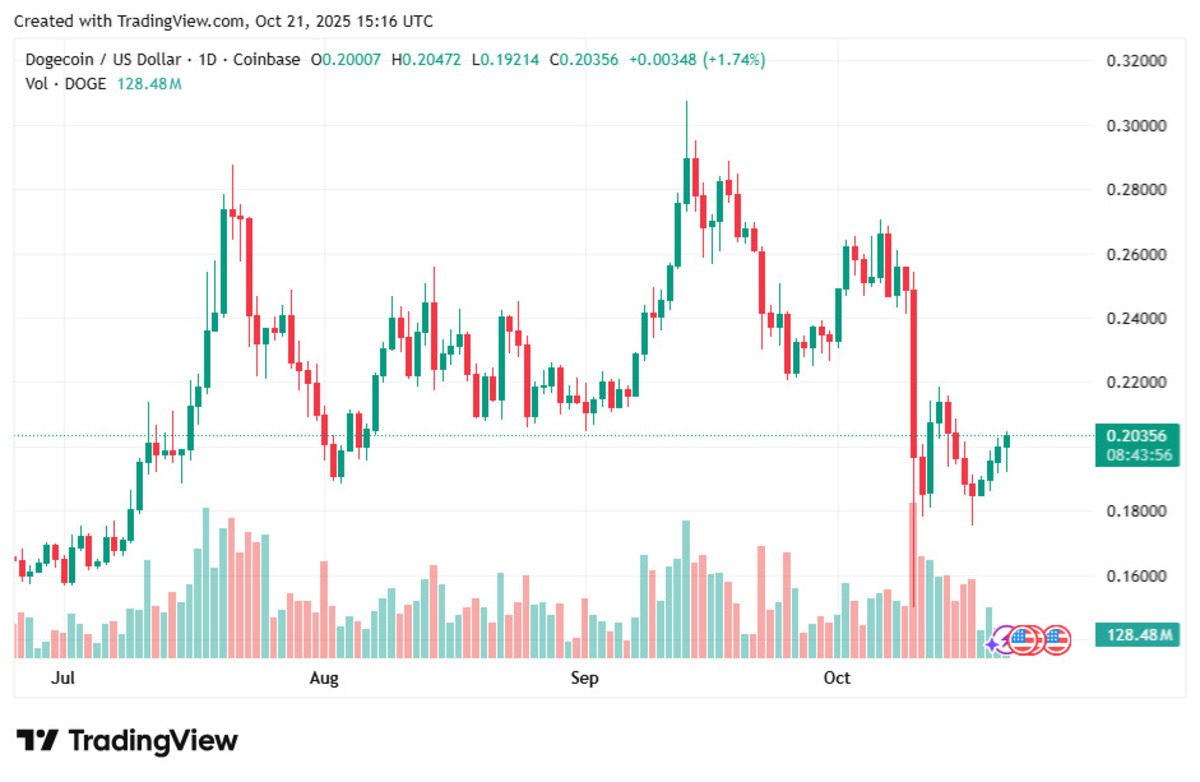
DOGE/USD 1D Price|Source: TradingView
Musk-linked social sentiment remains a wildcard. Historically, even subtle posts have triggered multi-day rallies, though they often fade without follow-up news. Still, renewed optimism around DOGE’s potential inclusion in X’s payment ecosystem gives the current rally more substance.
Another news is fueling the rally. Dogecoin’s commercial arm, House of DOGE, also just announced purchasing majority stakes in one of Italy’s professional football clubs, U.S Triestina 1918.
This move was made towards “its mission of ‘Doing Only Good Everyday’ by backing projects and brands that carry community, cultural relevance, and long-term value.”
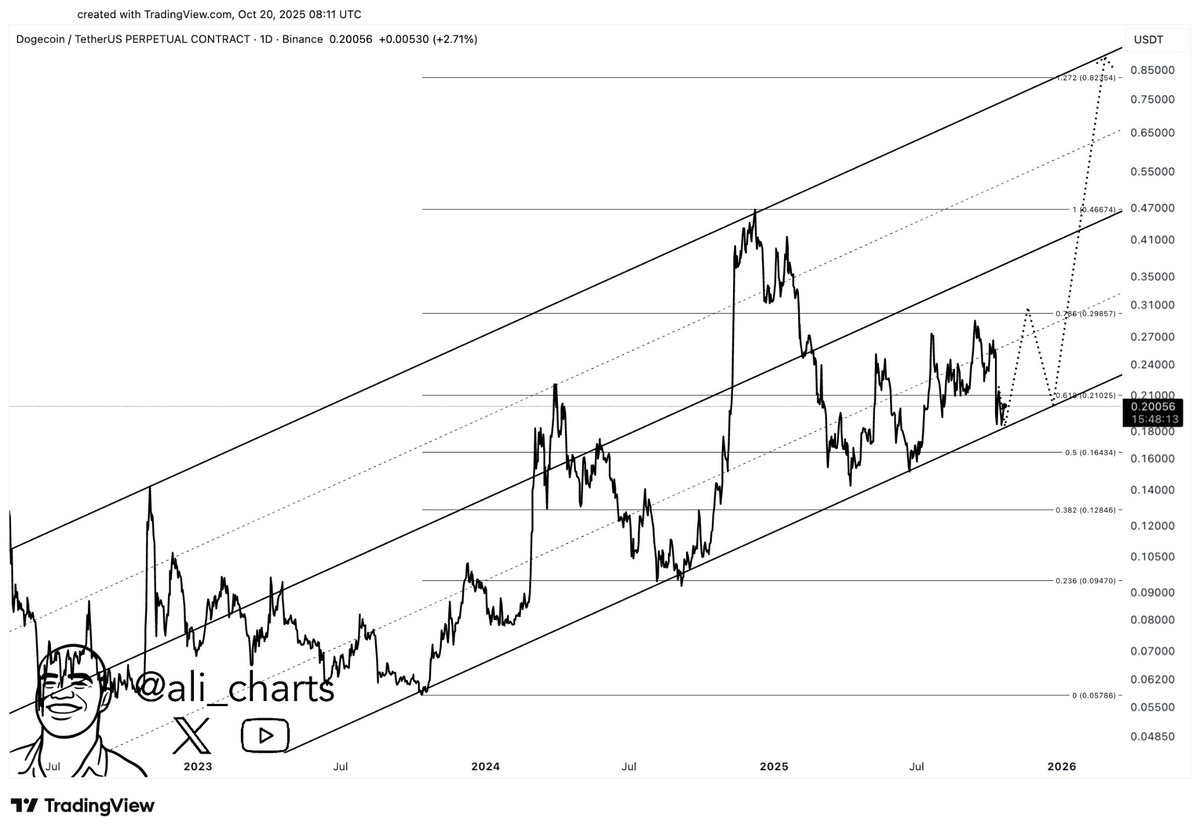
DOGE Just Bounced Off the Channel Support|Source: Ali_Charts on X
Price-wise, Ali Martinez believes DOGE just bounced off the channel support. This is expected to lead to a rally, with $0.29 as the first target. If momentum continues amidst the current hype, he expects DOGE to hit $0.86 soon.

While Dogecoin thrives on social energy, Remittix (RTX) is gaining attention for its functional PayFi model, which combines cryptocurrency and traditional banking.
The project’s beta wallet is now live, allowing users to test key features. This is a leap few projects achieve before launch.
Core PayFi features include:
Remittix has already raised $27.5m, selling 679m tokens, which shows huge demand for the new PayFi solution. You can now buy Remittix for $0.1166.
However, the price is expected to rise soon, as over 40,000 investors have acquired Remittix in recent months. It’s CertiK-verified and confirmed for listings on BitMart and LBank.
Analysts project 30x–50x upside by 2026, citing its tested product, transparent tokenomics, and community traction. This positions Remittix as a rare mix of utility and exponential potential.
Website: https://remittix.io/
Socials: https://linktr.ee/remittix
$250,000 Giveaway: https://gleam.io/competitions/nz84L-250000-remittix-giveaway
This article contains information about a cryptocurrency presale. Crypto Economy is not associated with the project. As with any initiative within the crypto ecosystem, we encourage users to do their own research before participating, carefully considering both the potential and the risks involved. This content is for informational purposes only and does not constitute investment advice.
The market is glued to one topic right now: the XRP price prediction. Momentum has cooled after a rapid climb, and traders want to know if strength can stretch or if the next leg belongs to newer payment tokens. There is a rising PayFi altcoin quietly pulling liquidity toward itself, and seasoned investors are watching it for the next powerful move. That altcoin is Remittix.
The XRP price prediction sits at the center stage because the token anchors cross-border narratives and liquidity flows. Yet capital rotates fast when fresh utility arrives, and the hunt for real-world settlement at low cost is creating a narrow window for early entries elsewhere. Keep that in mind as we look at the data.

XRP trades near $2.48 after a choppy week. That keeps the daily gain around 4.15%, but the tape shows signs of range behavior. Several desks frame their XRP price prediction in a band between $2.39 and $2.48 through October 2025, with a possible push toward $2.77 if volumes return. Others flag cooling order books and sideways chop while Fear and Greed slips.
Even with mixed sentiment, liquidity networks and exchange access still support the bull case. The key test is whether catalysts can refresh demand quickly. Without a new spark, the conservative XRP price prediction favors consolidation before any renewed extension. With one, the path opens to a retest of overhead zones into November.

Now to that fast moving contender. Priced at $0.1166 today, Remittix is built for direct crypto to fiat settlement and has become a quiet favorite among early stage allocators. The team is verified by CertiK, and the project is currently ranked number 1 on CertiK for pre-Launch Tokens, which is a trust signal institutions notice.
Wallet beta testing is live with community users already putting it through real transactions. Compared with XRP, the angle here is speed to everyday usage and breadth of payout rails. Support spans more than 40 cryptocurrencies and 30 fiat currencies with real time FX conversion.
You can currently buy RTX at $0.1166, but pricing will not sit still if adoption keeps climbing. More than 40,000 investors have acquired RTX in recent months, and over $27.5 million has been raised with more than 679 million tokens sold.
If the XRP price prediction plays out as a range while the market waits for a fresh catalyst, the door is open for capital to chase newer payment rails that move faster, cost less, and already have users in a live wallet beta. With verified security, confirmed listings, and a still accessible entry, Remittix is the contender many believe can outpace the next phase while XRP reassesses its trend.
This article contains information about a cryptocurrency presale. Crypto Economy is not associated with the project. As with any initiative within the crypto ecosystem, we encourage users to do their own research before participating, carefully considering both the potential and the risks involved. This content is for informational purposes only and does not constitute investment advice.
Jakarta, Pintu News – As of October 22, 2025, Cardano’s ADA token (ADA) is trading at around $0.64, having declined by around 4.7% in the past 24 hours.
Market participants continue to closely monitor technical indicators and institutional developments as the fourth quarter progresses.
Technical analysis shows that ADA is forming a symmetrical triangle pattern, which often appears before major price movements occur. Currently, the token price is moving in a range between $0.64 to $0.67, with resistance levels around $0.73.
Read also: Solana Co-Founder Launches New Perpetual DEX to Rival Aster and Hyperliquid
If the price manages to break above that level, ADA has the potential to rise to the range of $0.86 to $1.12. However, if the price drops below $0.61, there is a risk of a further decline towards around $0.50.
Some market watchers highlighted the potential for an upward movement, noting that a successful break of resistance could bring significant gains. One Cardano-focused analyst mentioned that ADA could experience a sizable price spike if the current technical trend continues. However, this projection is speculative and highly dependent on market conditions.
Institutional participation in ADA has also increased, as seen by the token’s inclusion in indices such as the S&P Digital Markets 50. ADA’s daily trading volume occasionally surpasses $1 billion, reflecting increased liquidity.
This has attracted interest from both retail and institutional investors, while the market continues to monitor regulatory developments in the United States that could affect crypto asset valuations.
The Cardano network continues to expand, with over 2.5 million active addresses and significant progress on the Midnight mainnet development. This update is focused on improving scalability and privacy, to support decentralized finance (DeFi) and non-fungible token (NFT) applications.
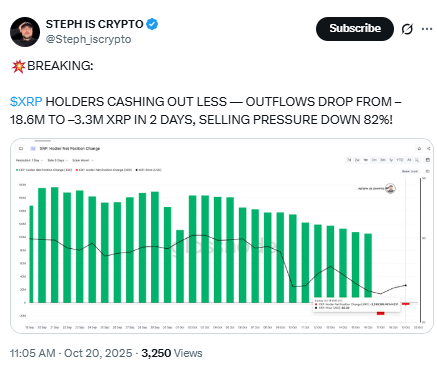
Read also: XRP Bullish Signal: Selling Pressure Down 82%, XRP Only Needs 5% Push to Breakout?
Large investors, known as “whales,” have accumulated a significant amount of ADA – approximately 140 million ADA in a three-day period. While this is no guarantee of price direction in the short term, it does provide a snapshot of liquidity distribution and investor behavior.
Overall, the direction in which ADA moves towards the end of 2025 is influenced by technical factors, institutional interest, and the growth of its ecosystem. Market participants remain vigilant on macroeconomic conditions as well as specific developments of the Cardano project that may affect the adoption and usage of the token.
Analysts also caution that the crypto market is highly volatile, and changes in regulation or market sentiment can have a major impact on price movements.
That’s the latest information about crypto. Follow us on Google News to get the latest crypto news about crypto projects and blockchain technology. Also, learn crypto from scratch with complete discussion through Pintu Academy and stay up-to-date with the latest crypto market such as bitcoin price today, xrp coin price today, dogecoin and other crypto asset prices through Pintu Market.
Enjoy an easy and secure crypto trading experience by downloading Pintu crypto app via Google Play Store or App Store now. Also, get a web trading experience with various advanced trading tools such as pro charting, various types of order types, and portfolio tracker only at Pintu Pro.
*Disclaimer
This content aims to enrich readers’ information. Pintu collects this information from various relevant sources and is not influenced by outside parties. Note that an asset’s past performance does not determine its projected future performance. Crypto trading activities have high risk and volatility, always do your own research and use cold cash before investing. All activities of buying and selling bitcoin and other crypto asset investments are the responsibility of the reader.
Reference:
XRP trades around $2.40 on October 22, 2025, as desks focused on a break above a multi-year descending trendline and documented whale accumulation of 30,000,000 XRP in a span of just 24 hours. This setup has shifted the near-term XRP focus to a $2.60 daily close and the $2.85 to $3.00 pocket that often attracts profit-taking.
CryptoKaleo, a market analyst, brought out the details on XRP finally breaking above the multi-year descending resistance trendline. This breakout, he stated, mirrors the 2017 pattern that preceded the token’s explosive surge toward $3.50. He noted that the coin’s structure now shows regained momentum, supported by a decisive reclaim of long-term resistance.
The price currently faces resistance between $3.30 and $3.50, while the next major support rests around $1.00–$1.20. A sustained move above the $3.50 mark could open a path toward higher extension zones between $5.00 and $7.00. The chart setup reflects renewed investor optimism and potential continuation of XRP’s historical price cycle.
Related: XRP Crowd Sentiment Collapses to Extreme Low: Historic Buy Opportunity Ahead?
Ali Martinez, another market analyst, highlighted a sharp increase in whale activity as a key confirmation of strength. Wallets holding between 100,000 and 10,000,000 XRP collectively added 30 million tokens in the last 24 hours. This surge in accumulation coincided with a rebound from $2.25 to $2.40, showing investor confidence at lower levels.
On shorter timeframes, CryptoKaleo added that XRP has confirmed a breakout near $2.48 after multiple failed attempts along the descending trendline. Immediate support now lies around $2.42, while resistance is seen at $2.60. A consistent close above this level could accelerate gains toward $2.85 and $3.00, completing a full reversal structure.
However, if XRP dips below $2.40, a retest of $2.25 remains open for today. Despite short-term volatility, accumulation patterns suggest steady buyer interest. The price structure indicates that market participants are positioning for potential continuation, similar to the buildup seen before previous rally phases.
Related: XRP Price Prediction: $1B Treasury Sparks Debate While Price Tests Key Support
Disclaimer: The information presented in this article is for informational and educational purposes only. The article does not constitute financial advice or advice of any kind. Coin Edition is not responsible for any losses incurred as a result of the utilization of content, products, or services mentioned. Readers are advised to exercise caution before taking any action related to the company.


